| Param | Original file | Final file |
|---|---|---|
| Filename | modeM0/AS1T01_135T01_9000000632_04983cztM0_level2.evt | modeM0/AS1T01_135T01_9000000632_04983cztM0_level2_quad_clean.evt |
| Size (bytes) | 357,500,160 | 61,274,880 |
| Size | 340.9 MB | 58.4 MB |
| Events in quadrant A | 2,496,651 | 378,015 |
| Events in quadrant B | 2,659,201 | 375,756 |
| Events in quadrant C | 2,414,065 | 364,731 |
| Events in quadrant D | 2,875,558 | 345,105 |
| Mode M0 | |||
|---|---|---|---|
| Quadrant | BADHDUFLAG | Total packets | Discarded packets |
| A | 0 | 11375 | 3 |
| B | 0 | 11714 | 9 |
| C | 0 | 11262 | 4 |
| D | 0 | 12686 | 0 |
| Mode SS | |||
|---|---|---|---|
| Quadrant | BADHDUFLAG | Total packets | Discarded packets |
| A | 0 | 112 | 0 |
| B | 0 | 112 | 0 |
| C | 0 | 112 | 0 |
| D | 0 | 112 | 0 |
| Quadrant | Total seconds | Saturated seconds | Saturation percentage |
|---|---|---|---|
| A | 5597 | 11 | 0.196534% |
| B | 5594 | 18 | 0.321773% |
| C | 5596 | 4 | 0.071480% |
| D | 5598 | 81 | 1.446945% |
Noise dominated data is calculated using 1-second bins in cleaned event files. If a bin has >2000 counts, and if more than 50% of those come from <1% of pixels, then it is considered to be noise-dominated and hence unusable.
| Quadrant | # 1 sec bins | Bins with >0 counts | Bins with >2000 counts | High rate bins dominated by noise | Noise dominated (total time) | Noise dominated (detector-on time) | Marked lightcurve |
|---|---|---|---|---|---|---|---|
| A | 5598 | 5597 | 1 | 1 | 0.02% | 0.02% | 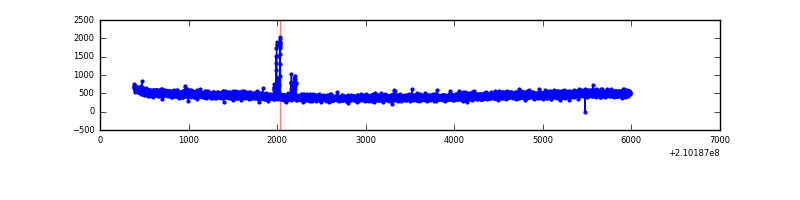 |
| B | 5598 | 5596 | 9 | 9 | 0.16% | 0.16% | 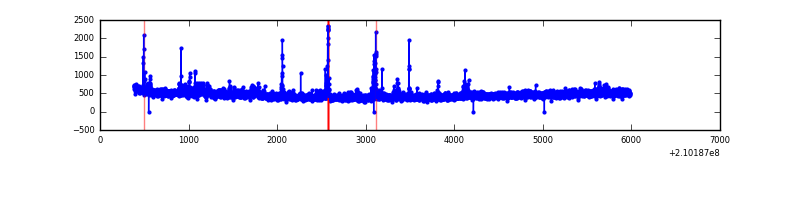 |
| C | 5597 | 5596 | 0 | 0 | 0.00% | 0.00% | 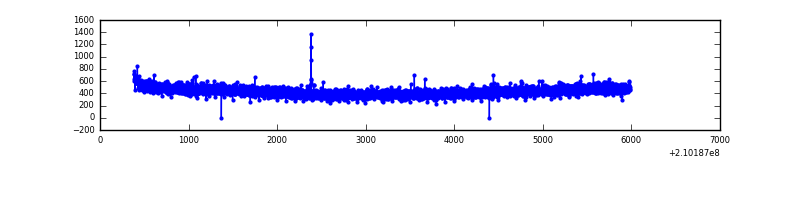 |
| D | 5598 | 5598 | 77 | 77 | 1.38% | 1.38% | 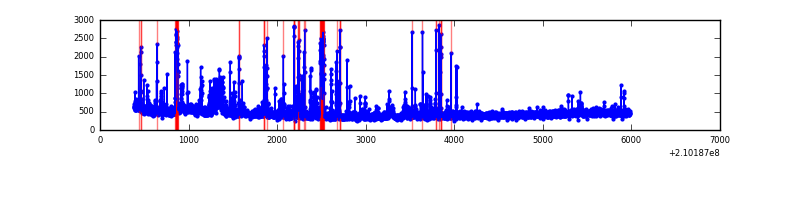 |
Top three noisy pixels from each quadrant. If the there are fewer than three noisy pixels in the level2.evt file, extra rows are filled as -1
| Pixel properties | Quadrant properties | ||||||
|---|---|---|---|---|---|---|---|
| Quadrant | DetID | PixID | Counts | Sigma | Mean | Median | Sigma |
| A | 0 | 50 | 36894 | 274.68 | 639 | 626 | 132.0 |
| A | 12 | 194 | 6446 | 44.08 | 639 | 626 | 132.0 |
| A | 0 | 226 | 6283 | 42.84 | 639 | 626 | 132.0 |
| B | 0 | 219 | 157446 | 1254.77 | 642 | 627 | 125.0 |
| B | 12 | 111 | 11688 | 88.5 | 642 | 627 | 125.0 |
| B | 11 | 111 | 9014 | 67.11 | 642 | 627 | 125.0 |
| C | 13 | 61 | 5031 | 30.38 | 616 | 618 | 145.3 |
| C | 9 | 54 | 4731 | 28.32 | 616 | 618 | 145.3 |
| C | 12 | 4 | 2489 | 12.88 | 616 | 618 | 145.3 |
| D | 13 | 235 | 234577 | 1551.53 | 611 | 594 | 150.8 |
| D | 13 | 239 | 142963 | 944.04 | 611 | 594 | 150.8 |
| D | 10 | 15 | 64571 | 424.23 | 611 | 594 | 150.8 |
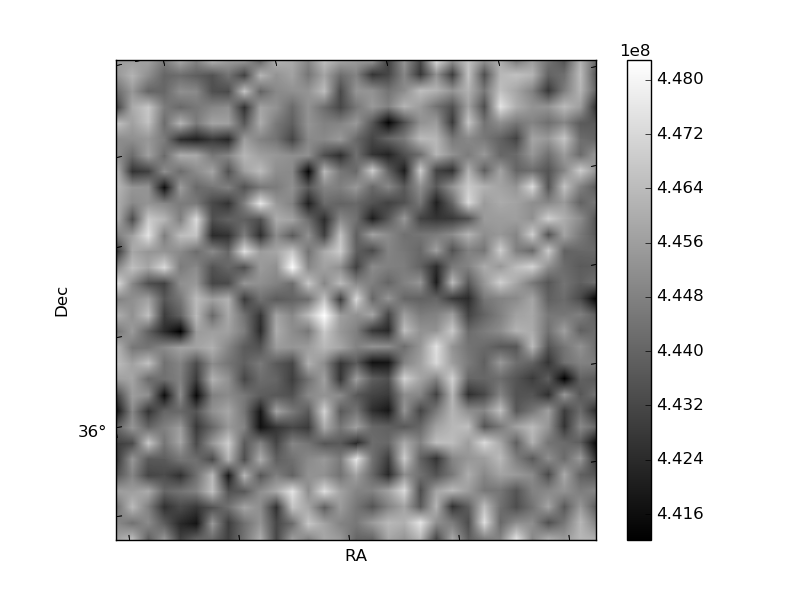
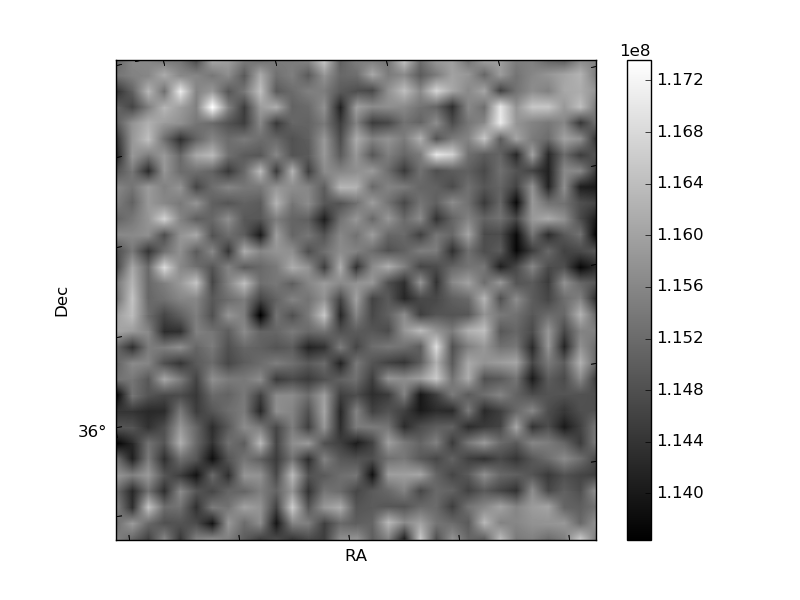
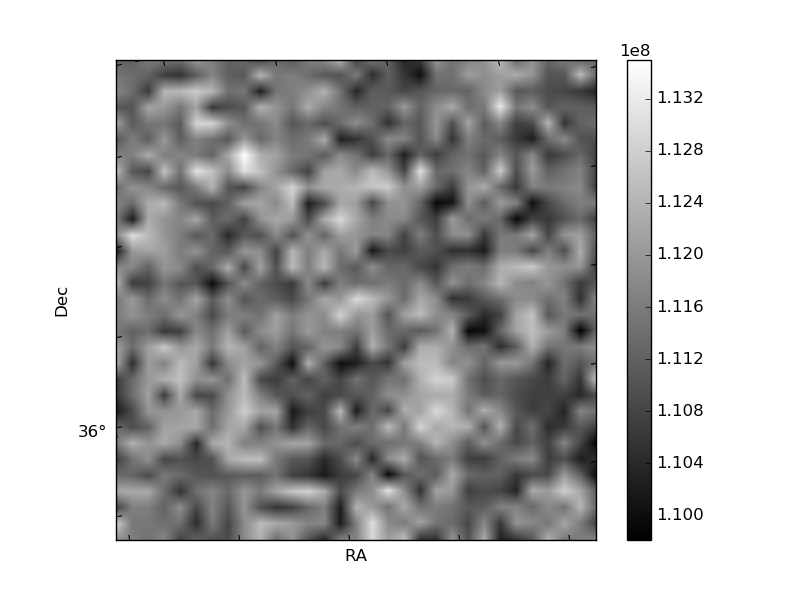
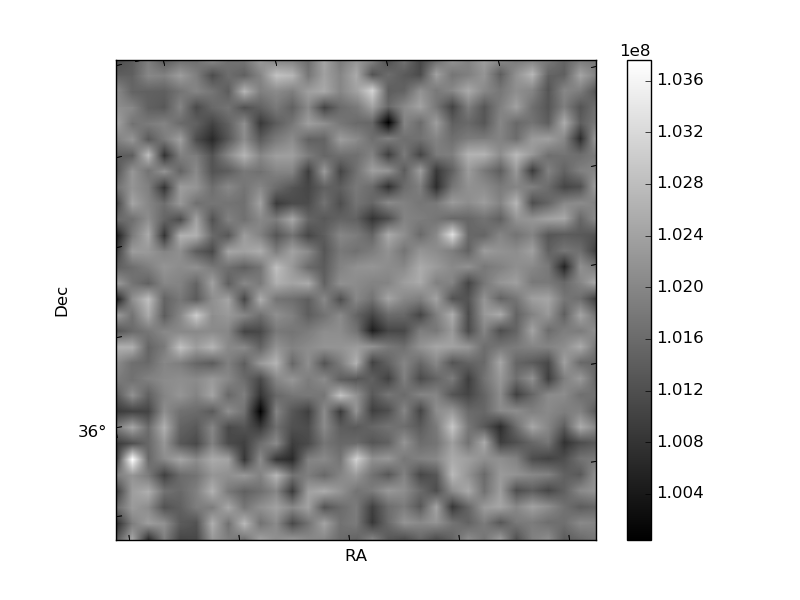
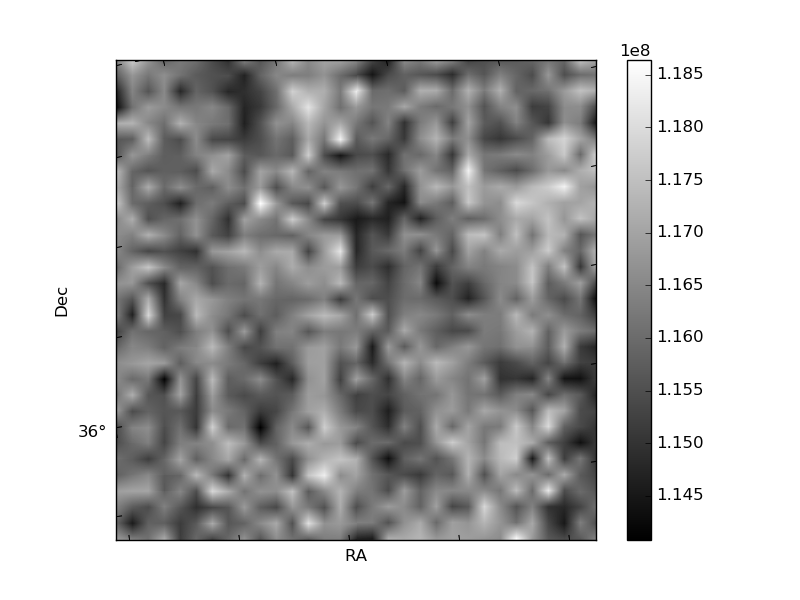
Histogram calculated using DETX and DETY for each event in the final _common_clean file
| Quadrant A | 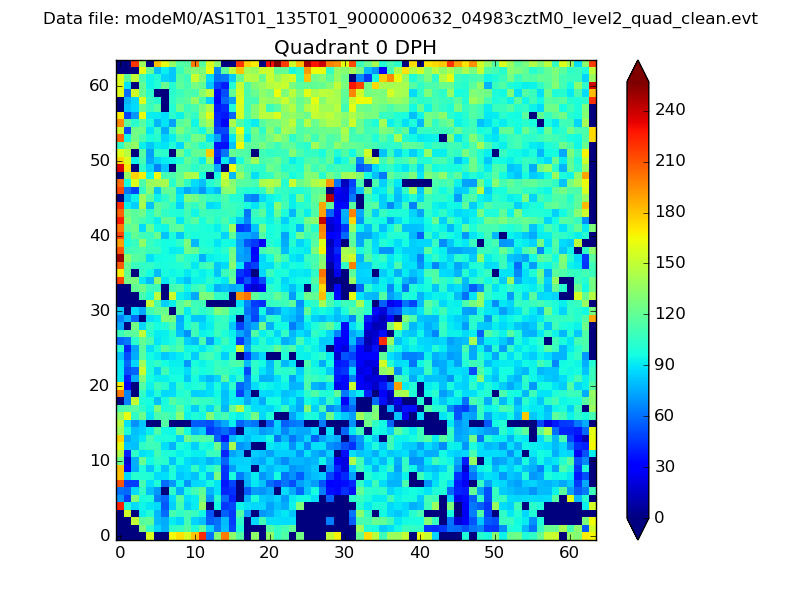 |
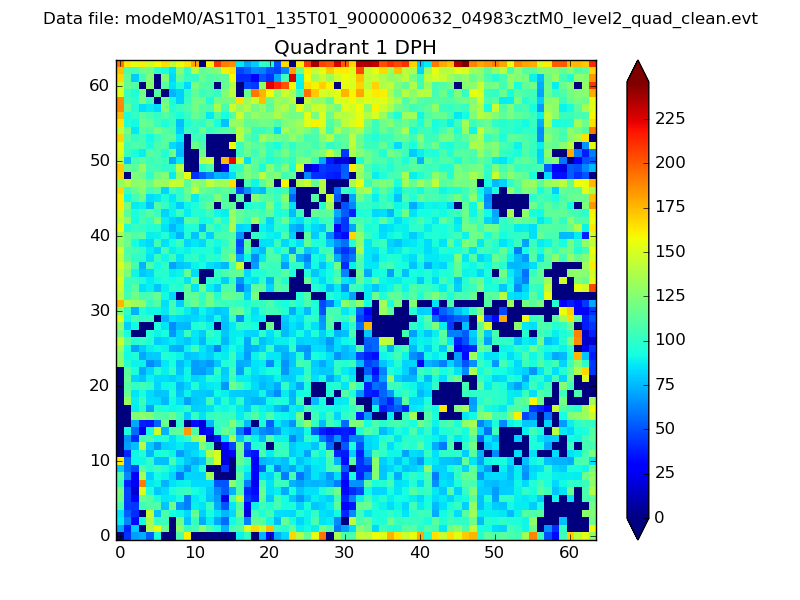 |
Quadrant B |
|---|---|---|---|
| Quadrant D | 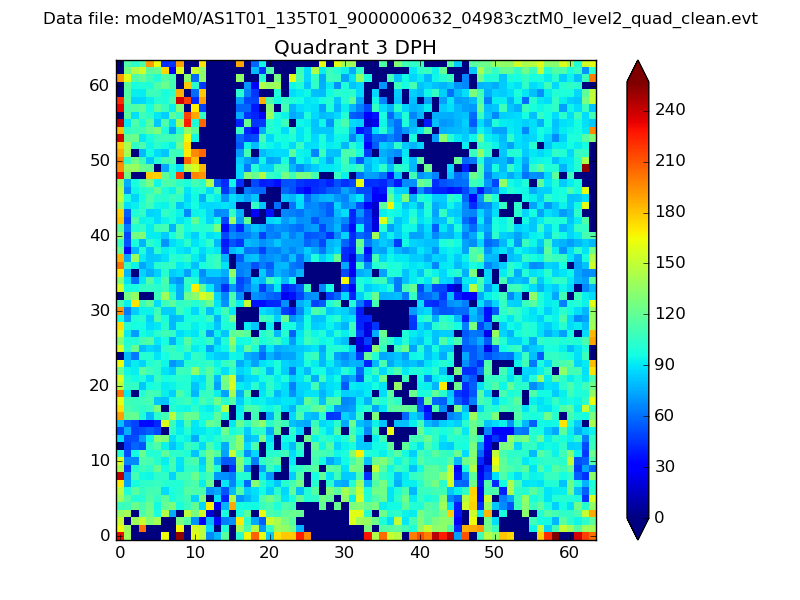 |
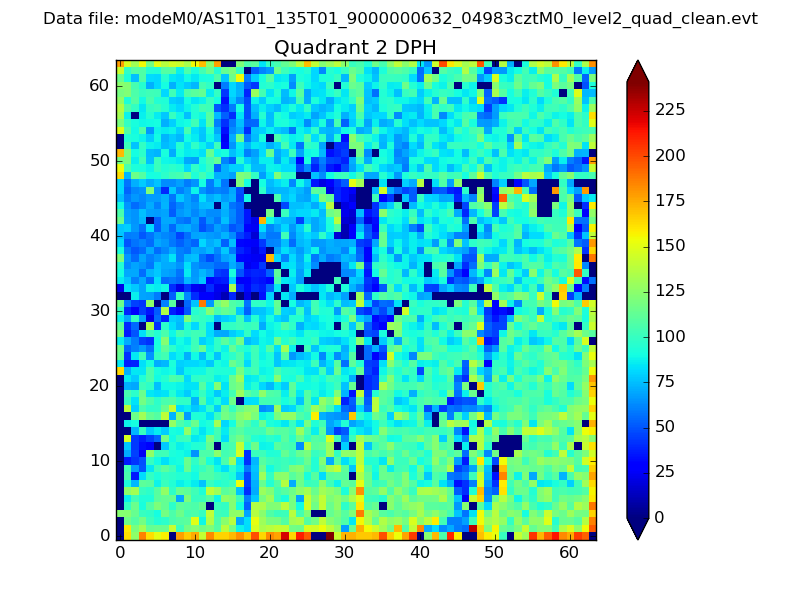 |
Quadrant C |
| Plot type | Count rate plots | Images |
|---|---|---|
| Comparison with Poisson distribution Blue bars denote a histogram of data divided into 1 sec bins. Red curve is a Poisson curve with rate = median count rate of data. |
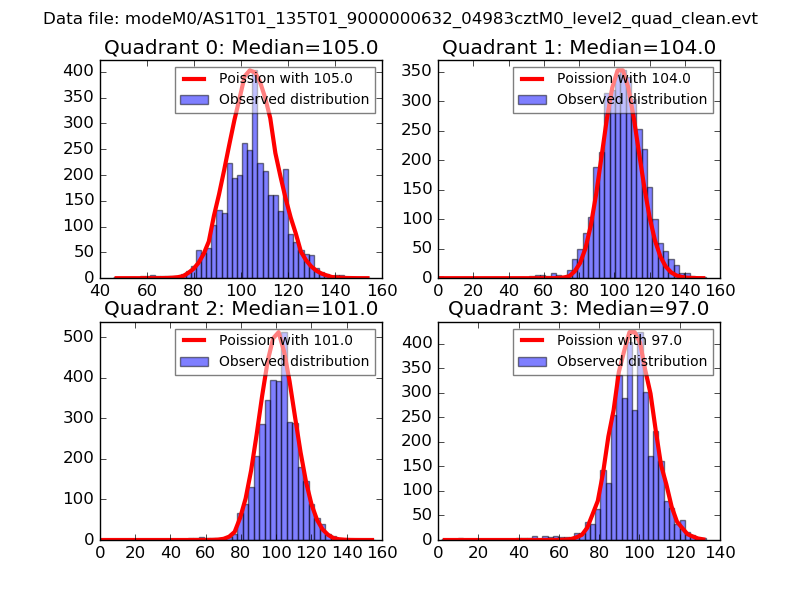 |
 |
| Quadrant-wise count rates Data is divided into 100 sec bins |
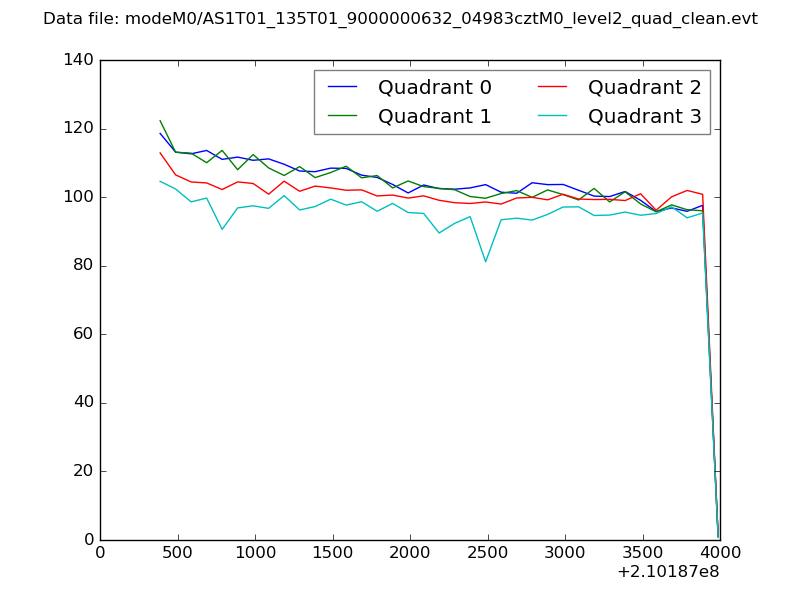 |
|
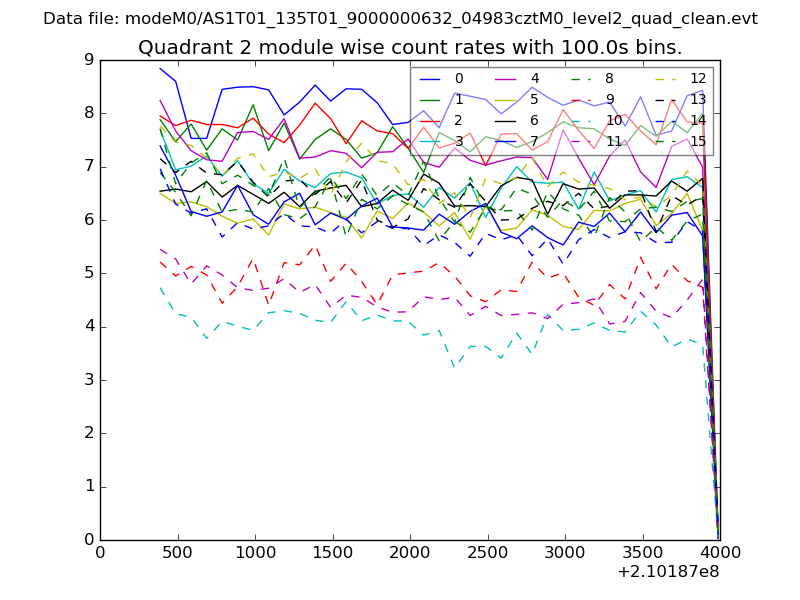
| Module-wise count rates for Quadrant A Data is divided into 100 sec bins |
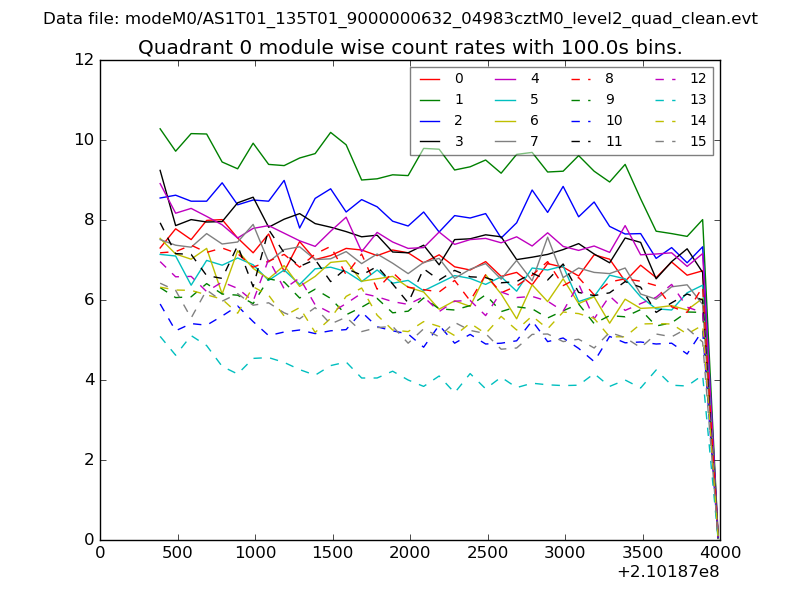 |
 |
| Module-wise count rates for Quadrant B Data is divided into 100 sec bins |
 |
 |
| Module-wise count rates for Quadrant C Data is divided into 100 sec bins |
 |
 |
| Module-wise count rates for Quadrant D Data is divided into 100 sec bins |
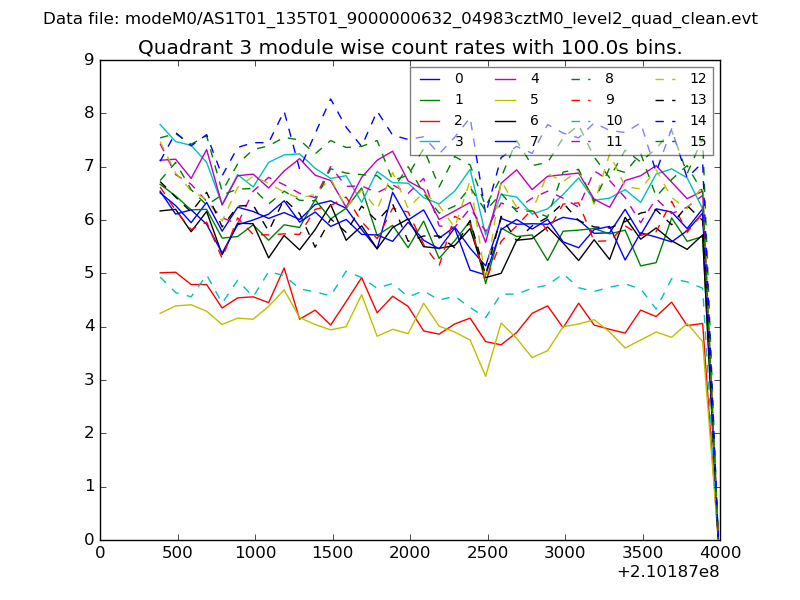 |
 |
| Parameter | Plot |
|---|---|
| CZT HV Monitor | 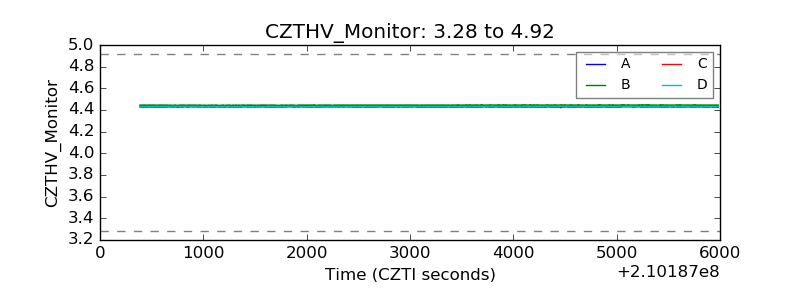 |
| D_VDD | 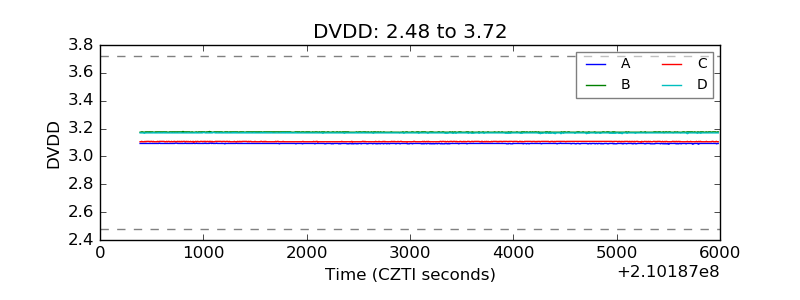 |
| Temperature 1 | 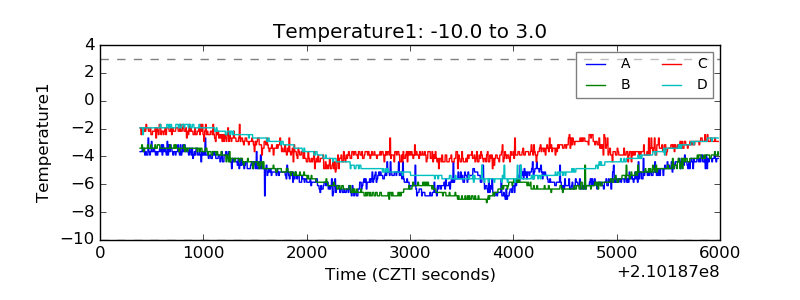 |
| Veto HV Monitor | 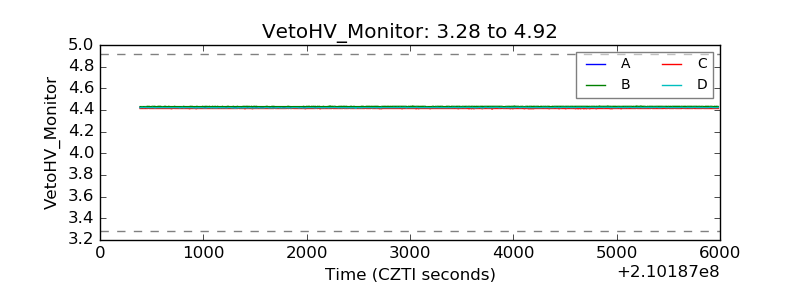 |
| Veto LLD | 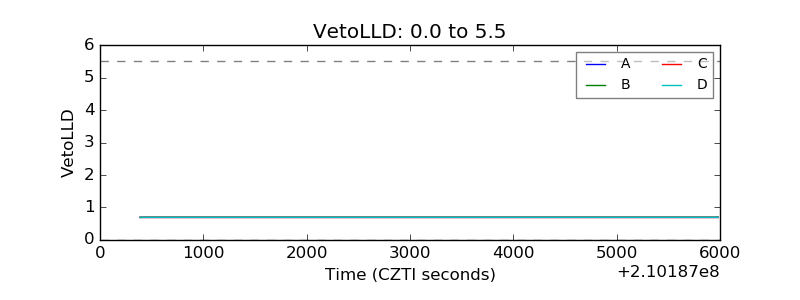 |
| Alpha Counter | 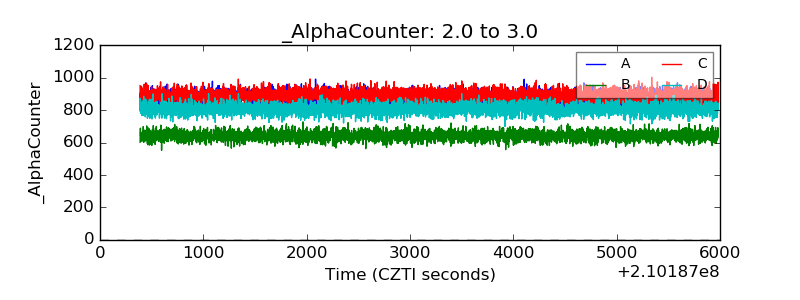 |
| _CPM_Rate | 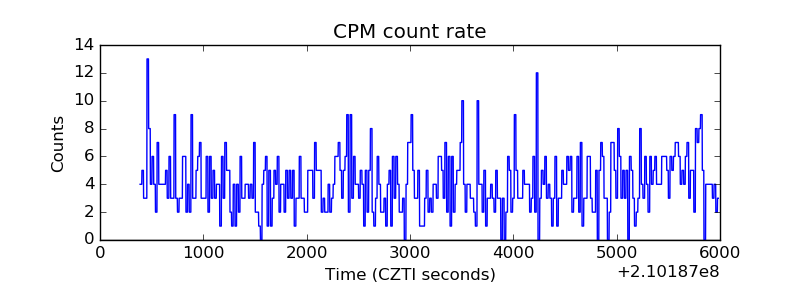 |
| CZT Counter | 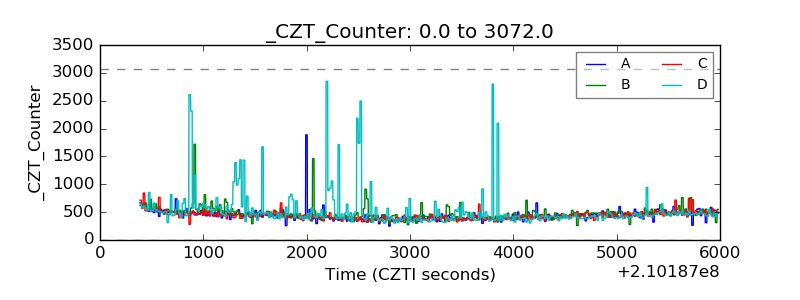 |
| +2.5 Volts monitor |  |
| +5 Volts monitor | 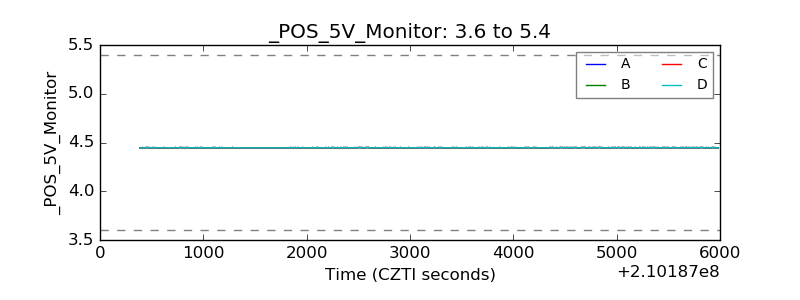 |
| _ROLL_ROT | 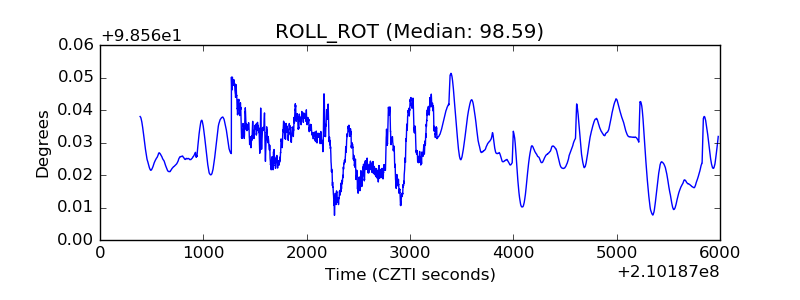 |
| _Roll_DEC | 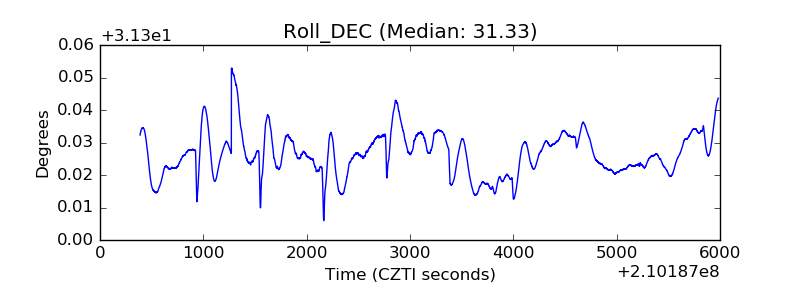 |
| _Roll_RA | 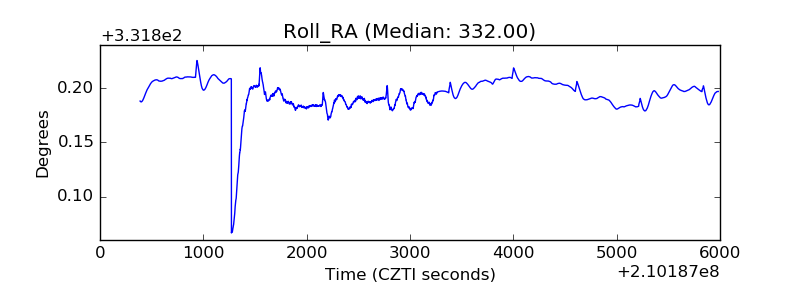 |
| Veto Counter | 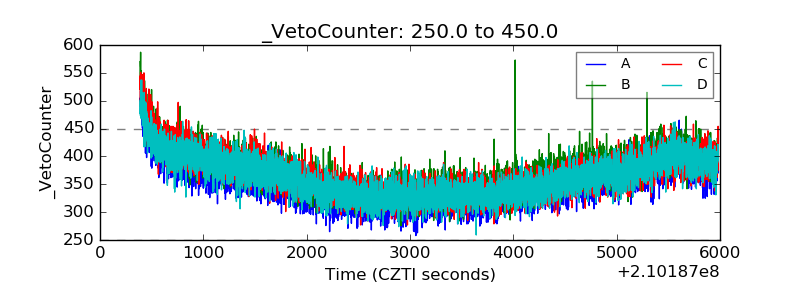 |