| Param | Original file | Final file |
|---|---|---|
| Filename | modeM0/AS1T01_135T01_9000000632_04984cztM0_level2.evt | modeM0/AS1T01_135T01_9000000632_04984cztM0_level2_quad_clean.evt |
| Size (bytes) | 268,781,760 | 38,471,040 |
| Size | 256.3 MB | 36.7 MB |
| Events in quadrant A | 1,949,385 | 233,840 |
| Events in quadrant B | 2,012,710 | 233,774 |
| Events in quadrant C | 1,913,537 | 223,018 |
| Events in quadrant D | 2,009,810 | 210,438 |
| Mode M0 | |||
|---|---|---|---|
| Quadrant | BADHDUFLAG | Total packets | Discarded packets |
| A | 0 | 8193 | 0 |
| B | 0 | 8352 | 6 |
| C | 0 | 8139 | 0 |
| D | 0 | 8478 | 0 |
| Mode SS | |||
|---|---|---|---|
| Quadrant | BADHDUFLAG | Total packets | Discarded packets |
| A | 0 | 74 | 0 |
| B | 0 | 74 | 0 |
| C | 0 | 74 | 0 |
| D | 0 | 74 | 0 |
| Quadrant | Total seconds | Saturated seconds | Saturation percentage |
|---|---|---|---|
| A | 3722 | 164 | 4.406233% |
| B | 3720 | 226 | 6.075269% |
| C | 3722 | 104 | 2.794197% |
| D | 3722 | 171 | 4.594304% |
Noise dominated data is calculated using 1-second bins in cleaned event files. If a bin has >2000 counts, and if more than 50% of those come from <1% of pixels, then it is considered to be noise-dominated and hence unusable.
| Quadrant | # 1 sec bins | Bins with >0 counts | Bins with >2000 counts | High rate bins dominated by noise | Noise dominated (total time) | Noise dominated (detector-on time) | Marked lightcurve |
|---|---|---|---|---|---|---|---|
| A | 3721 | 3721 | 0 | 0 | 0.00% | 0.00% | 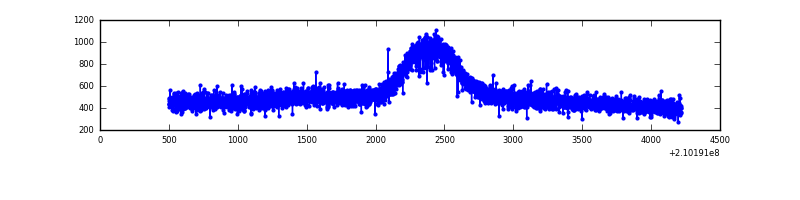 |
| B | 3722 | 3720 | 0 | 0 | 0.00% | 0.00% | 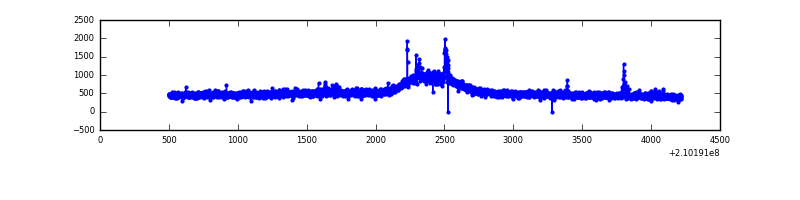 |
| C | 3721 | 3721 | 0 | 0 | 0.00% | 0.00% |  |
| D | 3721 | 3721 | 9 | 9 | 0.24% | 0.24% | 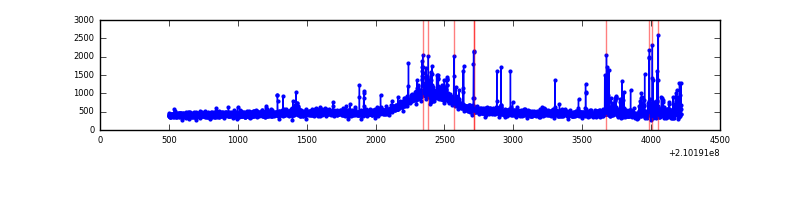 |
Top three noisy pixels from each quadrant. If the there are fewer than three noisy pixels in the level2.evt file, extra rows are filled as -1
| Pixel properties | Quadrant properties | ||||||
|---|---|---|---|---|---|---|---|
| Quadrant | DetID | PixID | Counts | Sigma | Mean | Median | Sigma |
| A | 12 | 194 | 5087 | 43.42 | 506 | 495 | 105.8 |
| A | 0 | 226 | 4985 | 42.46 | 506 | 495 | 105.8 |
| A | 3 | 137 | 1270 | 7.33 | 506 | 495 | 105.8 |
| B | 0 | 219 | 50178 | 484.67 | 505 | 491 | 102.5 |
| B | 12 | 111 | 9822 | 91.02 | 505 | 491 | 102.5 |
| B | 11 | 111 | 7598 | 69.33 | 505 | 491 | 102.5 |
| C | 13 | 61 | 4006 | 29.82 | 489 | 492 | 117.9 |
| C | 12 | 4 | 2369 | 15.93 | 489 | 492 | 117.9 |
| C | 8 | 222 | 1780 | 10.93 | 489 | 492 | 117.9 |
| D | 13 | 235 | 109661 | 888.06 | 487 | 471 | 123.0 |
| D | 2 | 234 | 34451 | 276.37 | 487 | 471 | 123.0 |
| D | 13 | 239 | 17990 | 142.49 | 487 | 471 | 123.0 |
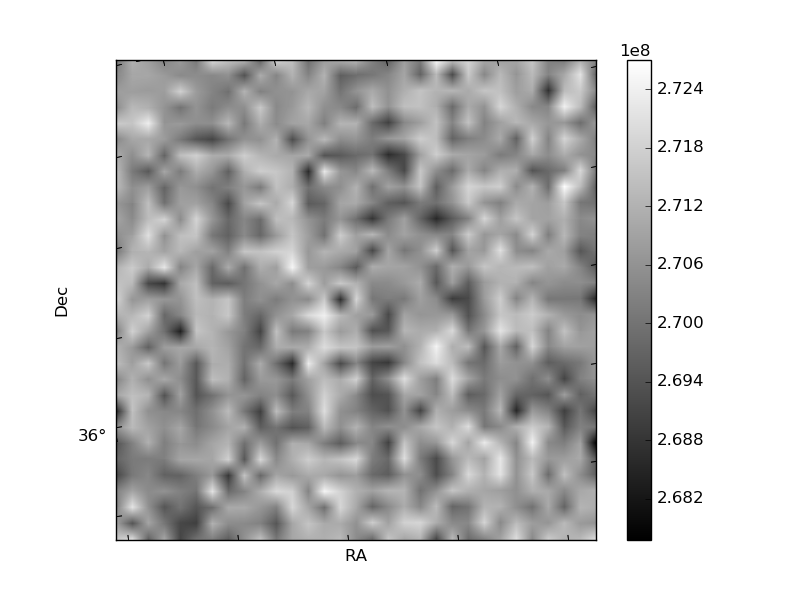
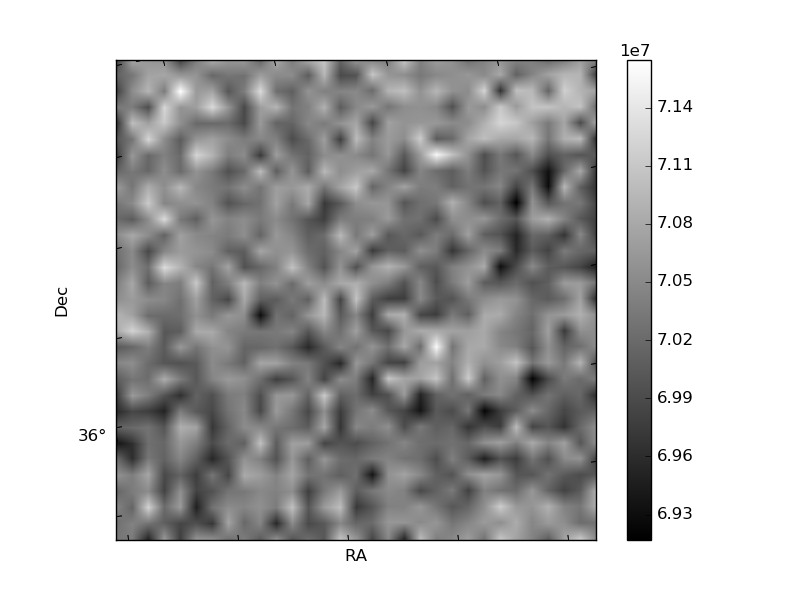
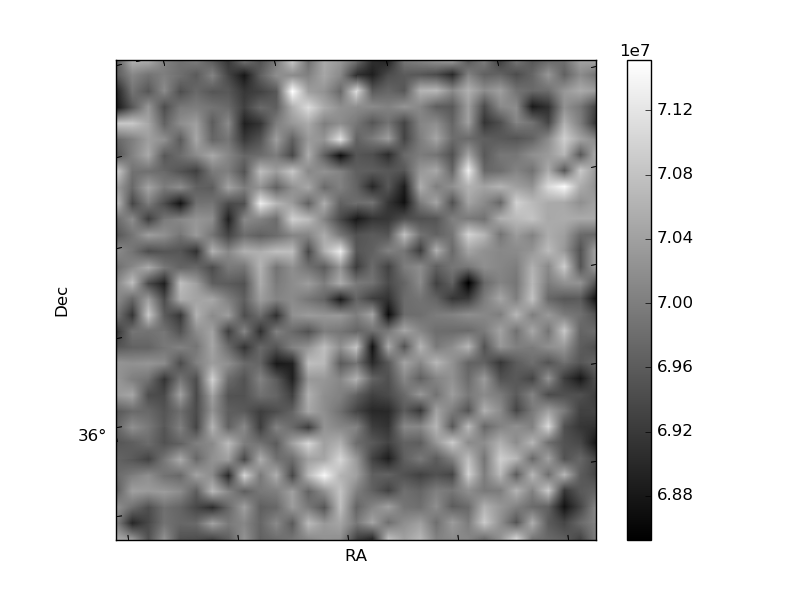
Histogram calculated using DETX and DETY for each event in the final _common_clean file
| Quadrant A | 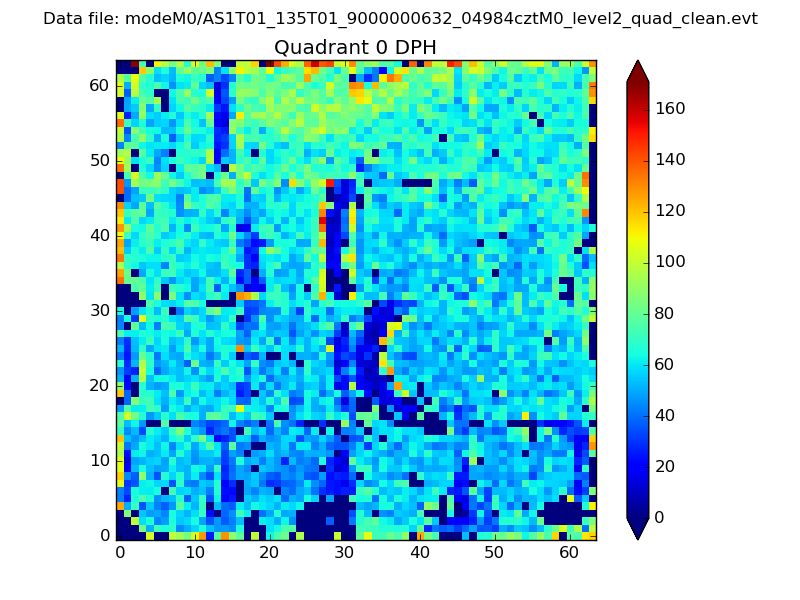 |
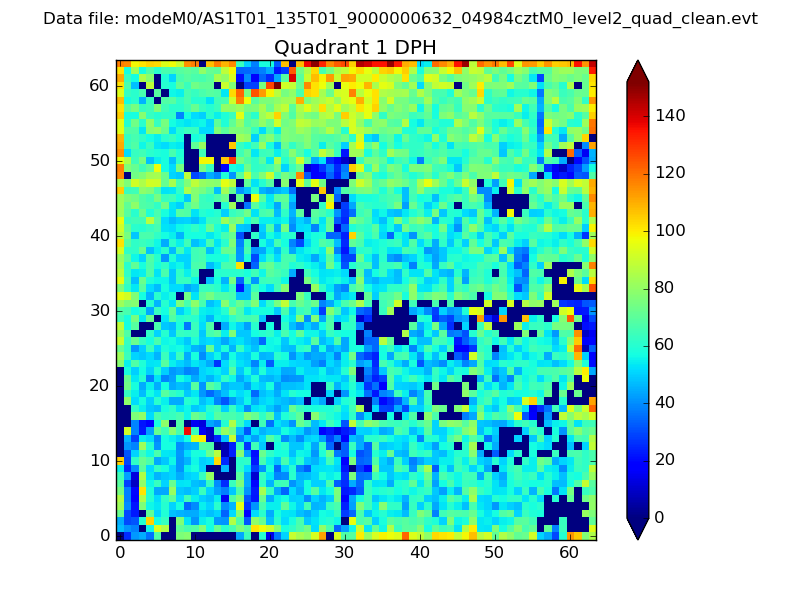 |
Quadrant B |
|---|---|---|---|
| Quadrant D | 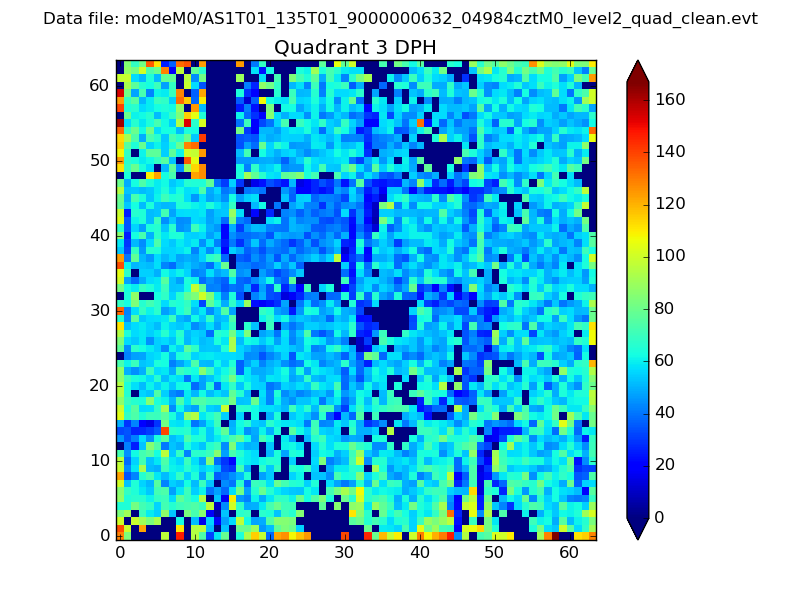 |
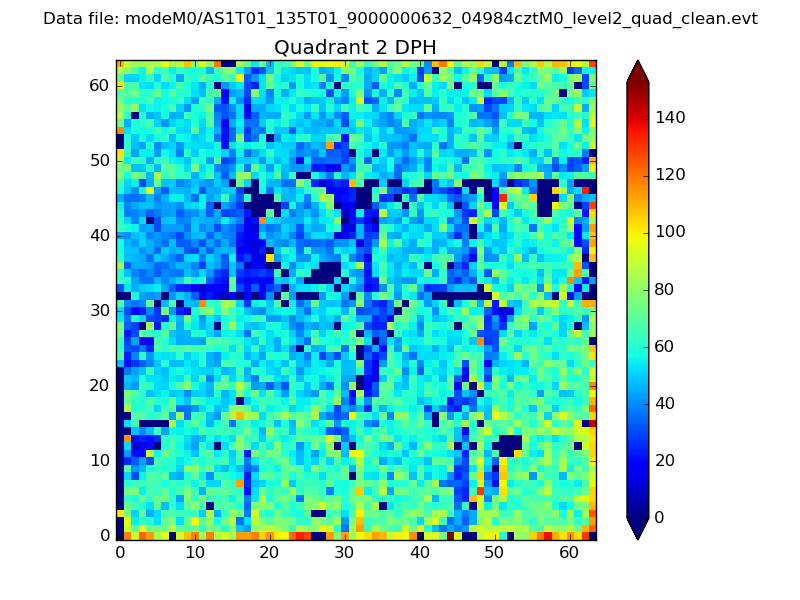 |
Quadrant C |
| Plot type | Count rate plots | Images |
|---|---|---|
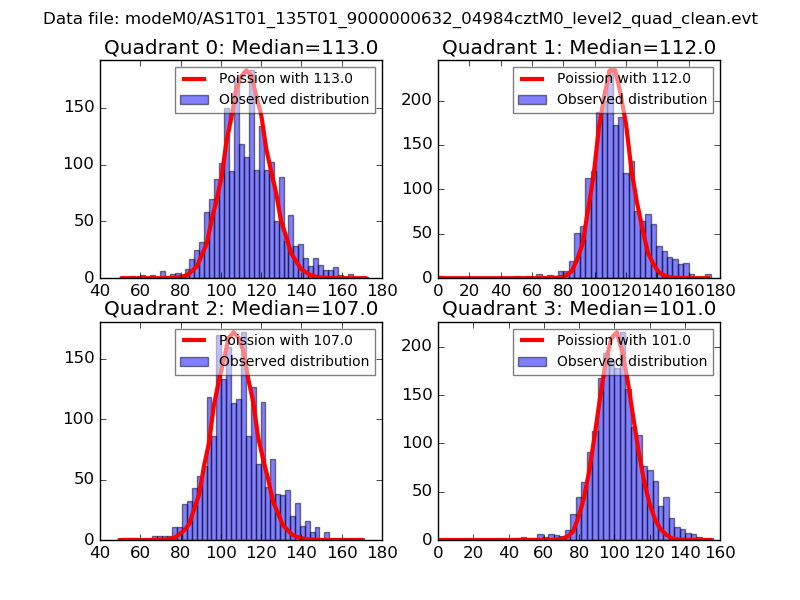
| Comparison with Poisson distribution Blue bars denote a histogram of data divided into 1 sec bins. Red curve is a Poisson curve with rate = median count rate of data. |
 |
 |
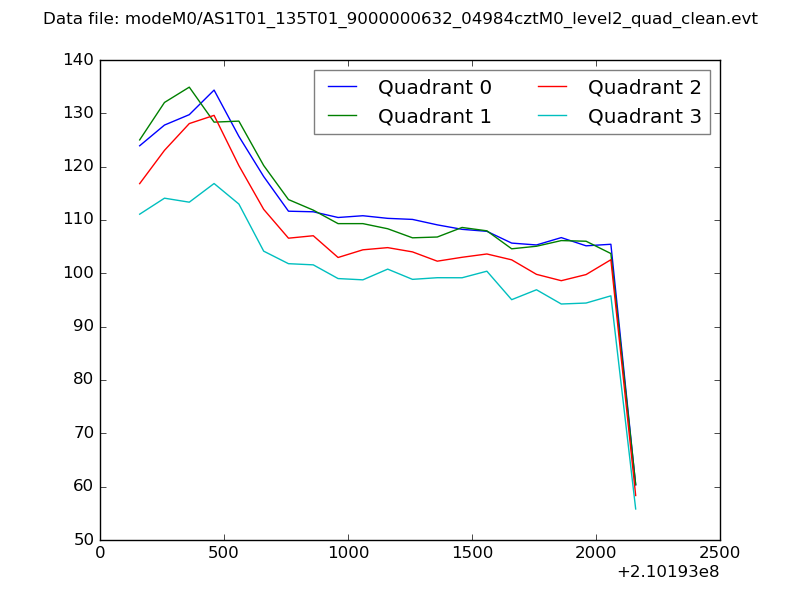
| Quadrant-wise count rates Data is divided into 100 sec bins |
 |
|
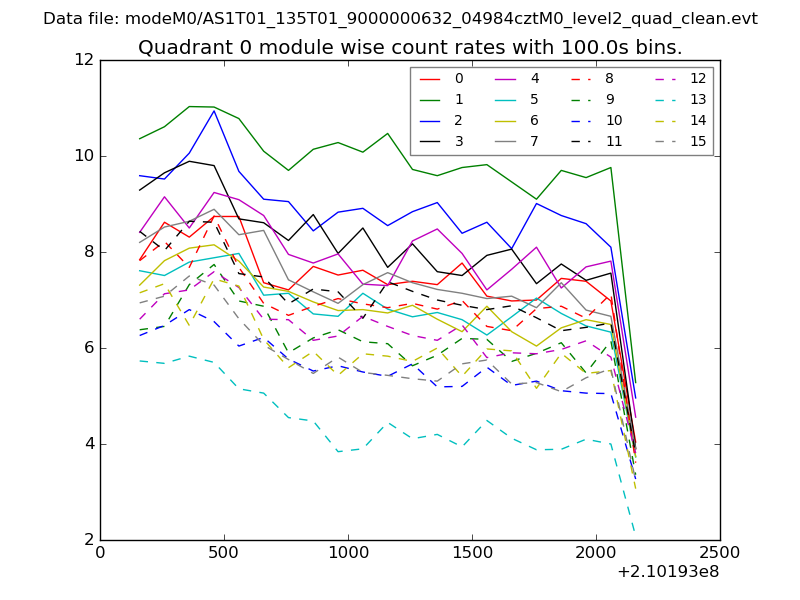
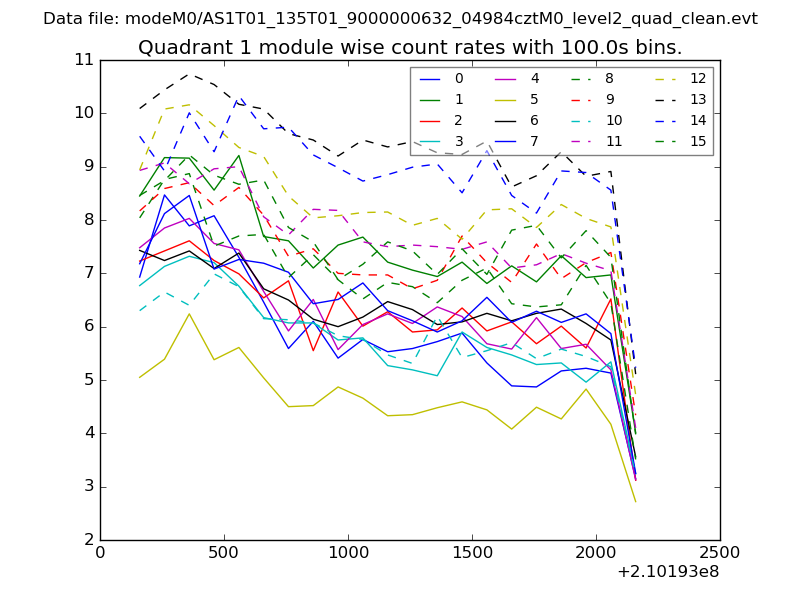
| Module-wise count rates for Quadrant A Data is divided into 100 sec bins |
 |
 |
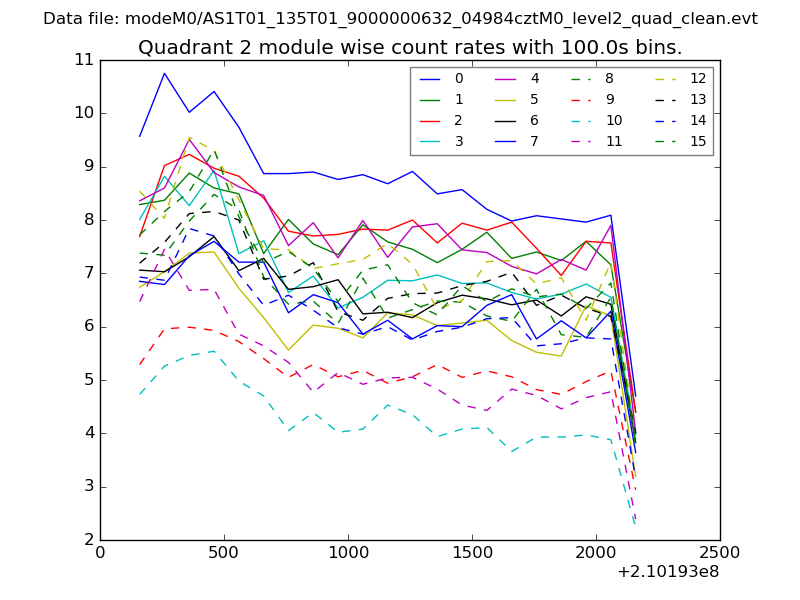
| Module-wise count rates for Quadrant B Data is divided into 100 sec bins |
 |
 |
| Module-wise count rates for Quadrant C Data is divided into 100 sec bins |
 |
 |
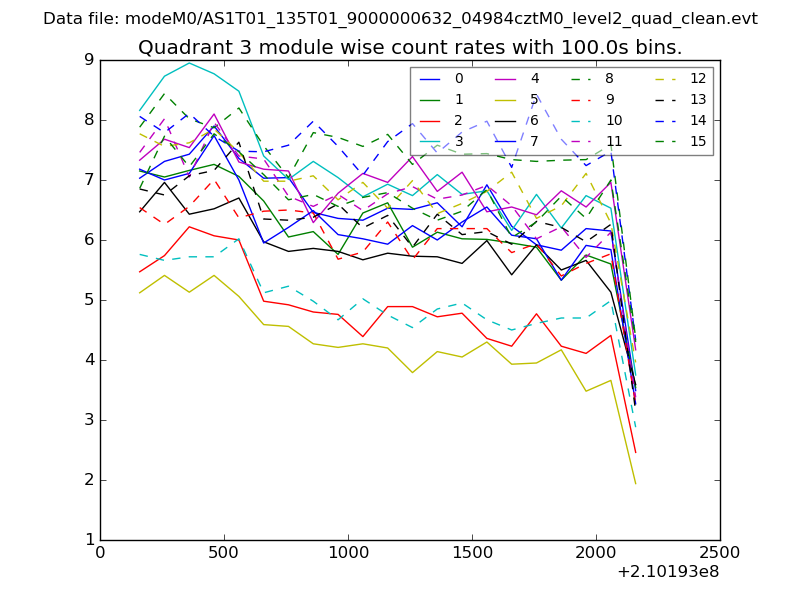
| Module-wise count rates for Quadrant D Data is divided into 100 sec bins |
 |
 |
| Parameter | Plot |
|---|---|
| CZT HV Monitor | 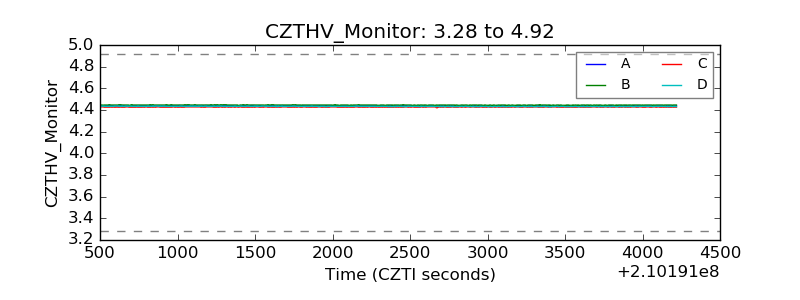 |
| D_VDD | 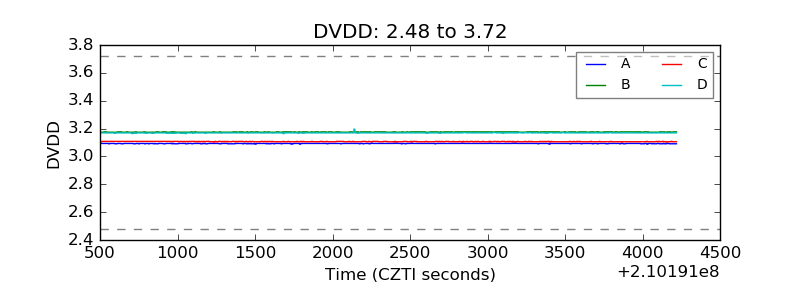 |
| Temperature 1 | 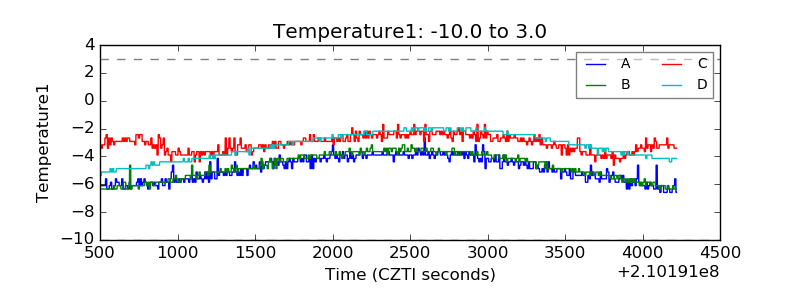 |
| Veto HV Monitor | 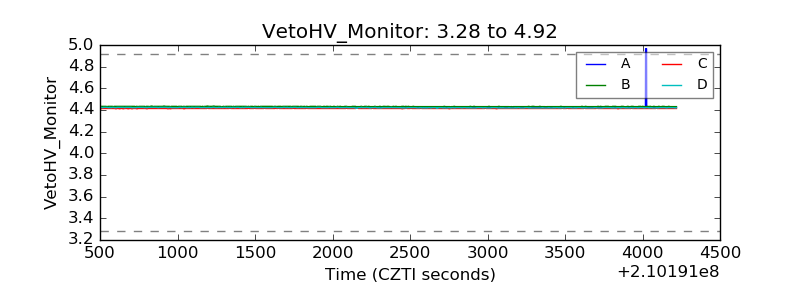 |
| Veto LLD | 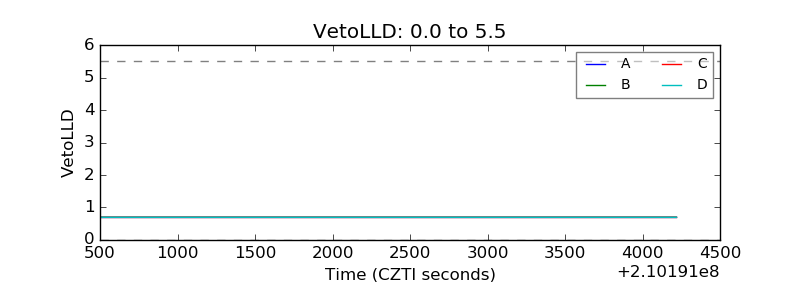 |
| Alpha Counter | 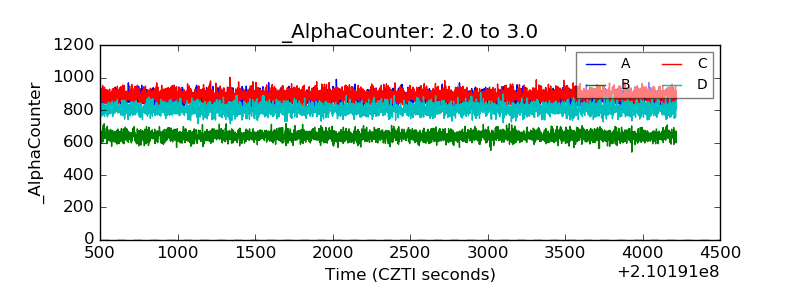 |
| _CPM_Rate | 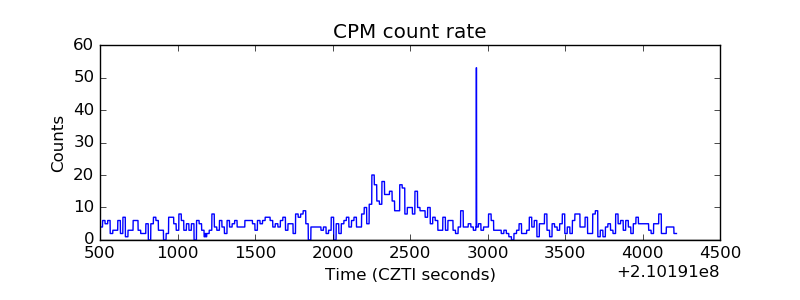 |
| CZT Counter | 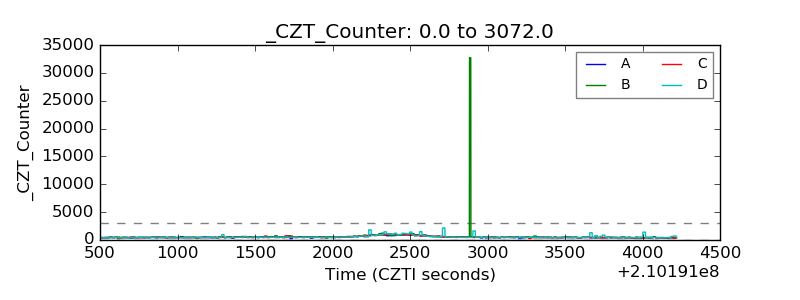 |
| +2.5 Volts monitor |  |
| +5 Volts monitor |  |
| _ROLL_ROT | 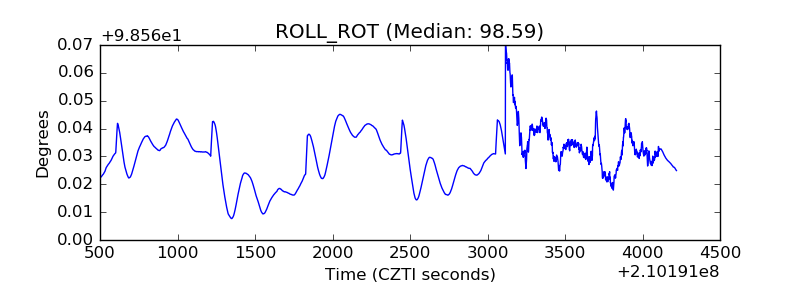 |
| _Roll_DEC | 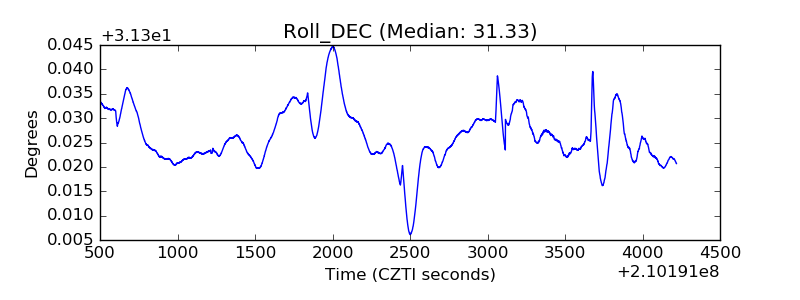 |
| _Roll_RA | 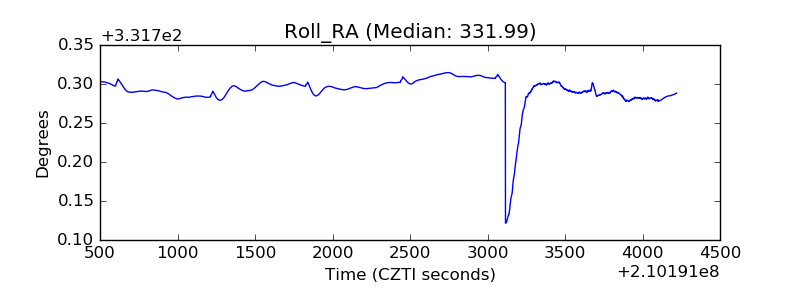 |
| Veto Counter | 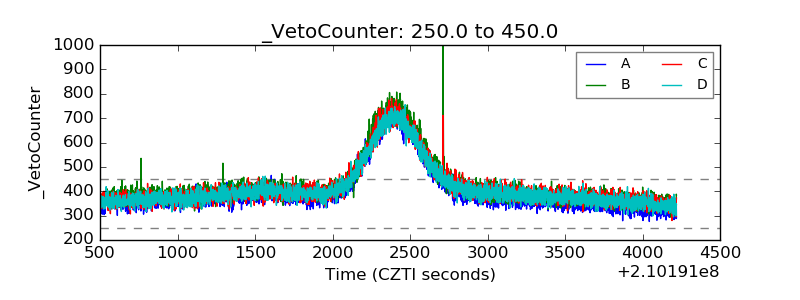 |