| Param | Original file | Final file |
|---|---|---|
| Filename | modeM0/AS1T01_132T01_9000000636cztM0_level2.fits | modeM0/AS1T01_132T01_9000000636cztM0_level2_quad_clean.evt |
| Size (bytes) | 626,155,200 | 554,302,080 |
| Size | 597.1 MB | 528.6 MB |
| Events in quadrant A | 3,790,490 | 3,178,339 |
| Events in quadrant B | 3,639,432 | 3,184,376 |
| Events in quadrant C | 3,726,550 | 3,060,543 |
| Events in quadrant D | 3,123,806 | 2,683,264 |
| Mode SS | |||
|---|---|---|---|
| Quadrant | BADHDUFLAG | Total packets | Discarded packets |
| A | 0 | 1395 | 0 |
| B | 0 | 1394 | 0 |
| C | 0 | 1392 | 0 |
| D | 0 | 1388 | 0 |
| Mode M0 | |||
|---|---|---|---|
| Quadrant | BADHDUFLAG | Total packets | Discarded packets |
| A | 0 | 143662 | 0 |
| B | 0 | 157521 | 0 |
| C | 0 | 141165 | 0 |
| D | 0 | 184412 | 0 |
| Mode M9 | |||
|---|---|---|---|
| Quadrant | BADHDUFLAG | Total packets | Discarded packets |
| A | 0 | 96 | 0 |
| B | 0 | 94 | 0 |
| C | 0 | 95 | 0 |
| D | 0 | 94 | 0 |
| Quadrant | Total seconds | Saturated seconds | Saturation percentage |
|---|---|---|---|
| A | 68328 | 896 | 1.311322% |
| B | 68247 | 1285 | 1.882867% |
| C | 68331 | 538 | 0.787344% |
| D | 68049 | 4379 | 6.435069% |
Noise dominated data is calculated using 1-second bins in cleaned event files. If a bin has >2000 counts, and if more than 50% of those come from <1% of pixels, then it is considered to be noise-dominated and hence unusable.
| Quadrant | # 1 sec bins | Bins with >0 counts | Bins with >2000 counts | High rate bins dominated by noise | Noise dominated (total time) | Noise dominated (detector-on time) | Marked lightcurve |
|---|---|---|---|---|---|---|---|
| A | 97251 | 68963 | 0 | 0 | 0.00% | 0.00% | 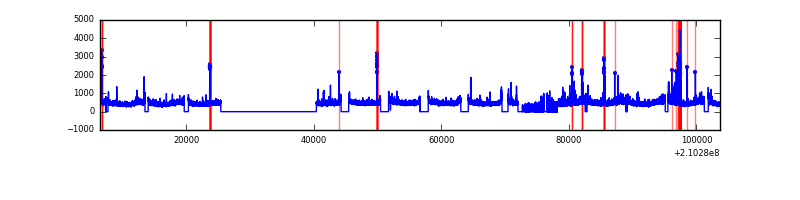 |
| B | 97252 | 68867 | 0 | 0 | 0.00% | 0.00% |  |
| C | 97252 | 68957 | 0 | 0 | 0.00% | 0.00% |  |
| D | 97252 | 68426 | 0 | 0 | 0.00% | 0.00% | 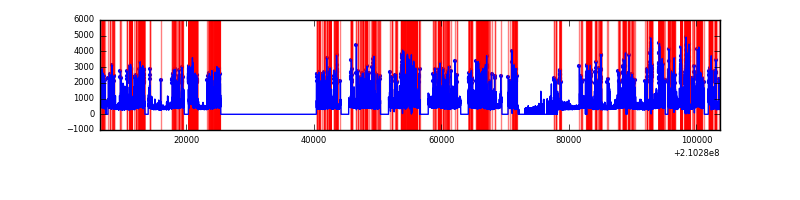 |
Top three noisy pixels from each quadrant. If the there are fewer than three noisy pixels in the level2.evt file, extra rows are filled as -1
| Pixel properties | Quadrant properties | ||||||
|---|---|---|---|---|---|---|---|
| Quadrant | DetID | PixID | Counts | Sigma | Mean | Median | Sigma |
| A | 0 | 29 | 3733 | 11.19 | 985 | 917 | 251.7 |
| A | 7 | 110 | 3126 | 8.78 | 985 | 917 | 251.7 |
| A | 9 | 19 | 2896 | 7.86 | 985 | 917 | 251.7 |
| B | 2 | 9 | 3184 | 11.75 | 959 | 911 | 193.5 |
| B | 14 | 254 | 2626 | 8.86 | 959 | 911 | 193.5 |
| B | 12 | 226 | 2585 | 8.65 | 959 | 911 | 193.5 |
| C | 1 | 80 | 2721 | 6.95 | 985 | 910 | 260.4 |
| C | 12 | 241 | 2688 | 6.83 | 985 | 910 | 260.4 |
| C | 1 | 81 | 2671 | 6.76 | 985 | 910 | 260.4 |
| D | 11 | 82 | 2501 | 7.17 | 888 | 805 | 236.7 |
| D | 3 | 14 | 2315 | 6.38 | 888 | 805 | 236.7 |
| D | 1 | 19 | 2307 | 6.35 | 888 | 805 | 236.7 |
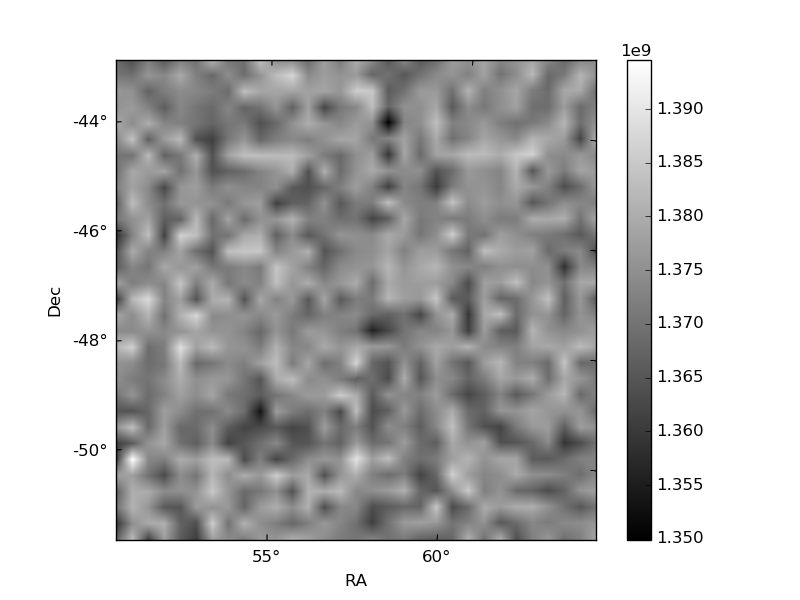
Histogram calculated using DETX and DETY for each event in the final _common_clean file
| Quadrant A | 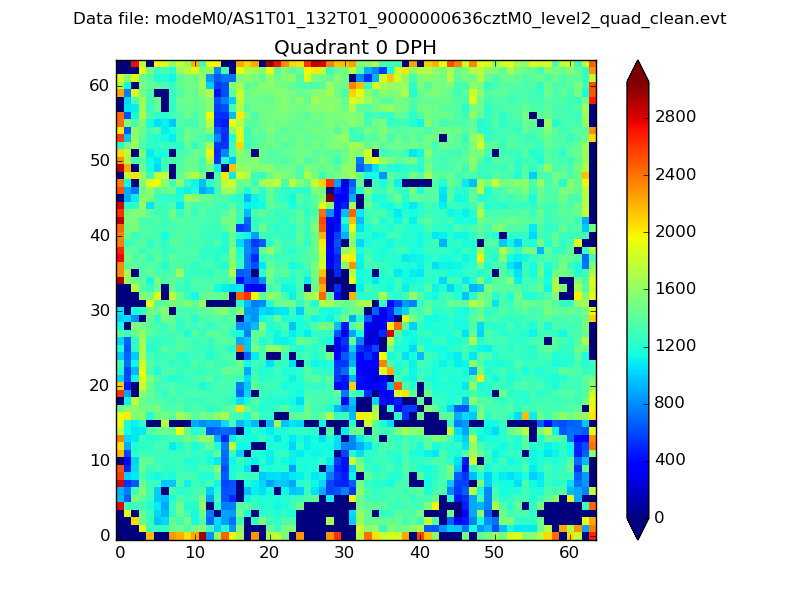 |
 |
Quadrant B |
|---|---|---|---|
| Quadrant D |  |
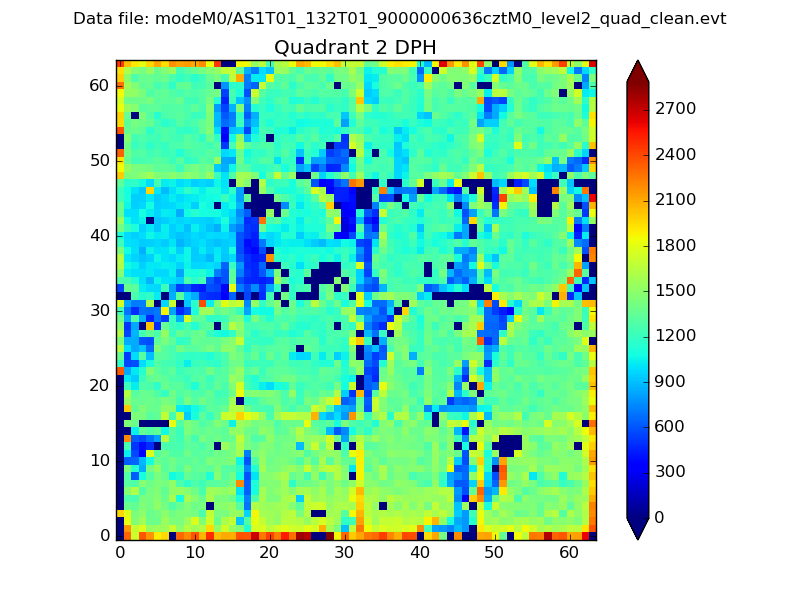 |
Quadrant C |
| Plot type | Count rate plots | Images |
|---|---|---|
| Comparison with Poisson distribution Blue bars denote a histogram of data divided into 1 sec bins. Red curve is a Poisson curve with rate = median count rate of data. |
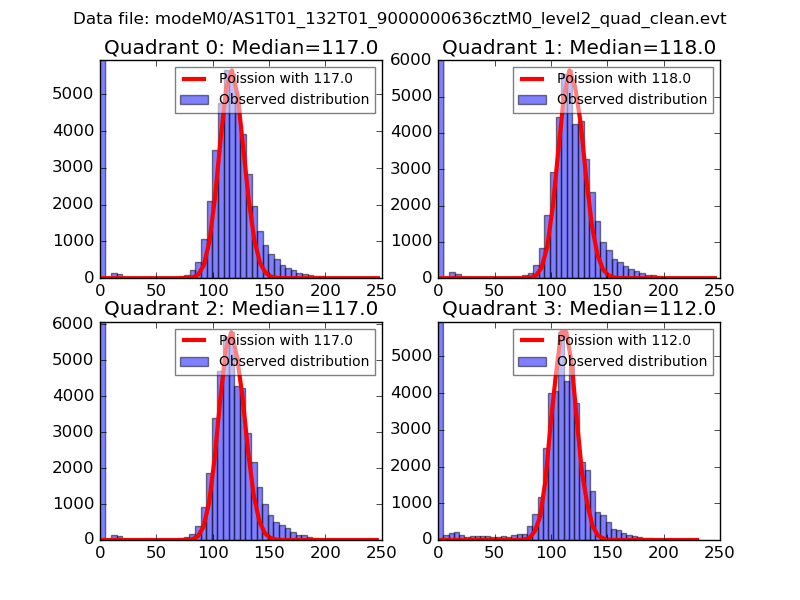 |
 |
| Quadrant-wise count rates Data is divided into 100 sec bins |
 |
|
| Module-wise count rates for Quadrant A Data is divided into 100 sec bins |
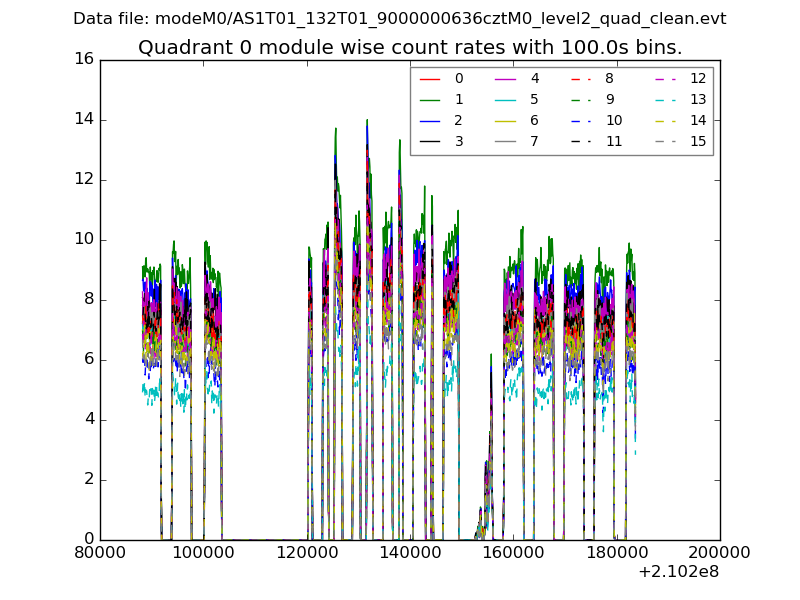 |
 |
| Module-wise count rates for Quadrant B Data is divided into 100 sec bins |
 |
 |
| Module-wise count rates for Quadrant C Data is divided into 100 sec bins |
 |
 |
| Module-wise count rates for Quadrant D Data is divided into 100 sec bins |
 |
 |
| Parameter | Plot |
|---|---|
| CZT HV Monitor |  |
| D_VDD | 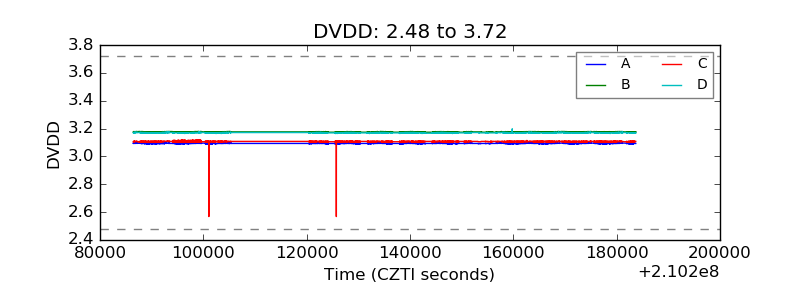 |
| Temperature 1 |  |
| Veto HV Monitor | 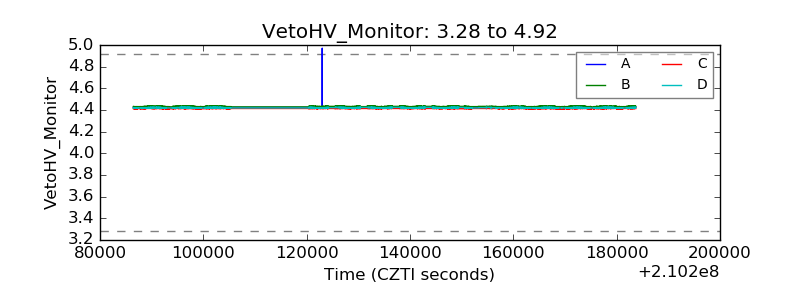 |
| Veto LLD |  |
| Alpha Counter | 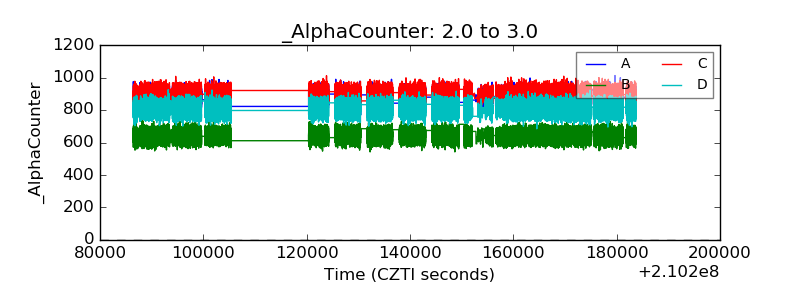 |
| _CPM_Rate |  |
| CZT Counter |  |
| +2.5 Volts monitor | 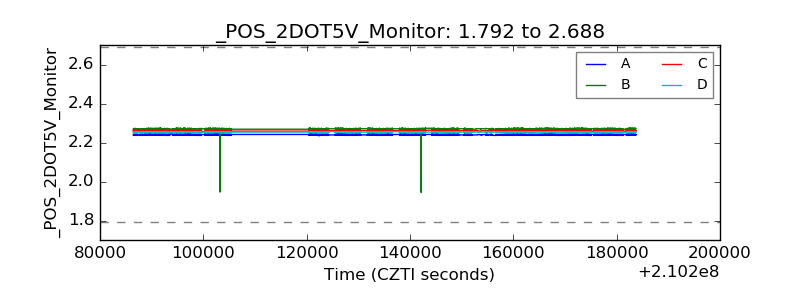 |
| +5 Volts monitor |  |
| _ROLL_ROT |  |
| _Roll_DEC |  |
| _Roll_RA | 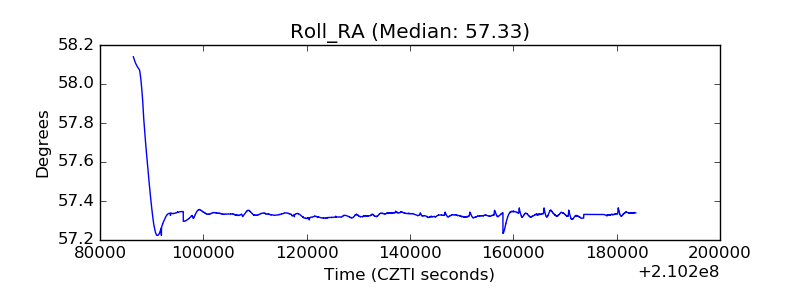 |
| Veto Counter |  |