| Param | Original file | Final file |
|---|---|---|
| Filename | modeM0/AS1T01_132T01_9000000636_05007cztM0_level2.evt | modeM0/AS1T01_132T01_9000000636_05007cztM0_level2_quad_clean.evt |
| Size (bytes) | 2,022,701,760 | 290,609,280 |
| Size | 1.9 GB | 277.1 MB |
| Events in quadrant A | 13,011,569 | 1,747,248 |
| Events in quadrant B | 15,172,683 | 1,755,904 |
| Events in quadrant C | 12,693,466 | 1,748,349 |
| Events in quadrant D | 18,491,738 | 1,626,569 |
| Mode SS | |||
|---|---|---|---|
| Quadrant | BADHDUFLAG | Total packets | Discarded packets |
| A | 0 | 568 | 0 |
| B | 0 | 568 | 0 |
| C | 0 | 568 | 0 |
| D | 0 | 568 | 0 |
| Mode M0 | |||
|---|---|---|---|
| Quadrant | BADHDUFLAG | Total packets | Discarded packets |
| A | 0 | 57750 | 9 |
| B | 0 | 63894 | 5 |
| C | 0 | 57067 | 5 |
| D | 0 | 74362 | 12 |
| Mode M9 | |||
|---|---|---|---|
| Quadrant | BADHDUFLAG | Total packets | Discarded packets |
| A | 0 | 41 | 0 |
| B | 0 | 41 | 0 |
| C | 0 | 41 | 0 |
| D | 0 | 41 | 0 |
| Quadrant | Total seconds | Saturated seconds | Saturation percentage |
|---|---|---|---|
| A | 27970 | 245 | 0.875939% |
| B | 27972 | 377 | 1.347776% |
| C | 27972 | 166 | 0.593451% |
| D | 27970 | 1838 | 6.571326% |
Noise dominated data is calculated using 1-second bins in cleaned event files. If a bin has >2000 counts, and if more than 50% of those come from <1% of pixels, then it is considered to be noise-dominated and hence unusable.
| Quadrant | # 1 sec bins | Bins with >0 counts | Bins with >2000 counts | High rate bins dominated by noise | Noise dominated (total time) | Noise dominated (detector-on time) | Marked lightcurve |
|---|---|---|---|---|---|---|---|
| A | 46969 | 27978 | 27 | 27 | 0.06% | 0.10% | 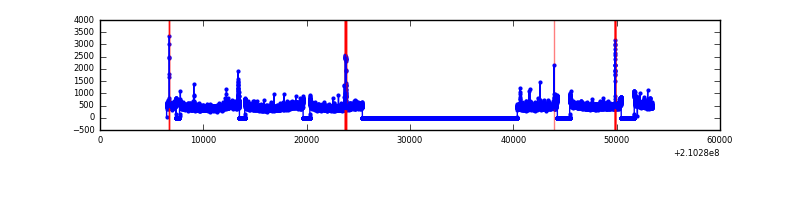 |
| B | 46971 | 27980 | 52 | 52 | 0.11% | 0.19% | 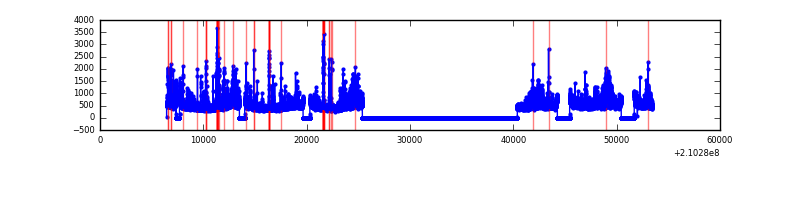 |
| C | 46971 | 27980 | 3 | 3 | 0.01% | 0.01% | 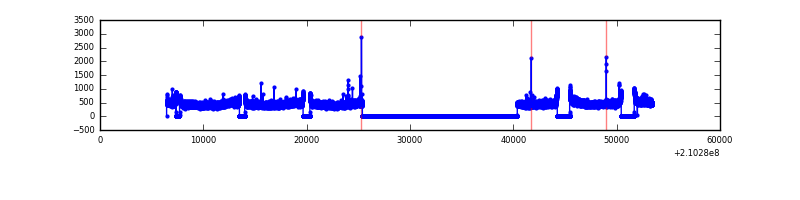 |
| D | 46971 | 27978 | 1311 | 1311 | 2.79% | 4.69% | 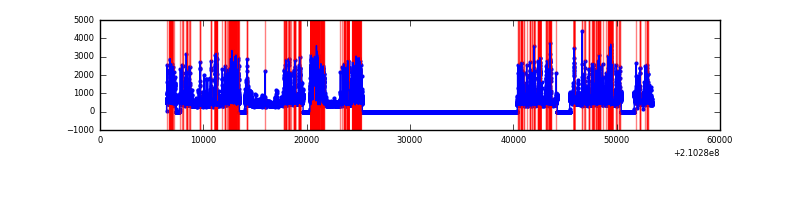 |
Top three noisy pixels from each quadrant. If the there are fewer than three noisy pixels in the level2.evt file, extra rows are filled as -1
| Pixel properties | Quadrant properties | ||||||
|---|---|---|---|---|---|---|---|
| Quadrant | DetID | PixID | Counts | Sigma | Mean | Median | Sigma |
| A | 0 | 50 | 120709 | 176.6 | 3302 | 3225 | 665.3 |
| A | 13 | 251 | 73384 | 105.46 | 3302 | 3225 | 665.3 |
| A | 8 | 15 | 40919 | 56.66 | 3302 | 3225 | 665.3 |
| B | 8 | 3 | 820876 | 1309.11 | 3313 | 3236 | 624.6 |
| B | 15 | 204 | 632094 | 1006.86 | 3313 | 3236 | 624.6 |
| B | 0 | 219 | 591239 | 941.44 | 3313 | 3236 | 624.6 |
| C | 1 | 16 | 62868 | 80.14 | 3222 | 3235 | 744.1 |
| C | 13 | 61 | 26143 | 30.79 | 3222 | 3235 | 744.1 |
| C | 8 | 128 | 20832 | 23.65 | 3222 | 3235 | 744.1 |
| D | 13 | 235 | 2796782 | 3659.28 | 3154 | 3060 | 763.5 |
| D | 2 | 33 | 1461860 | 1910.77 | 3154 | 3060 | 763.5 |
| D | 2 | 136 | 774183 | 1010.03 | 3154 | 3060 | 763.5 |
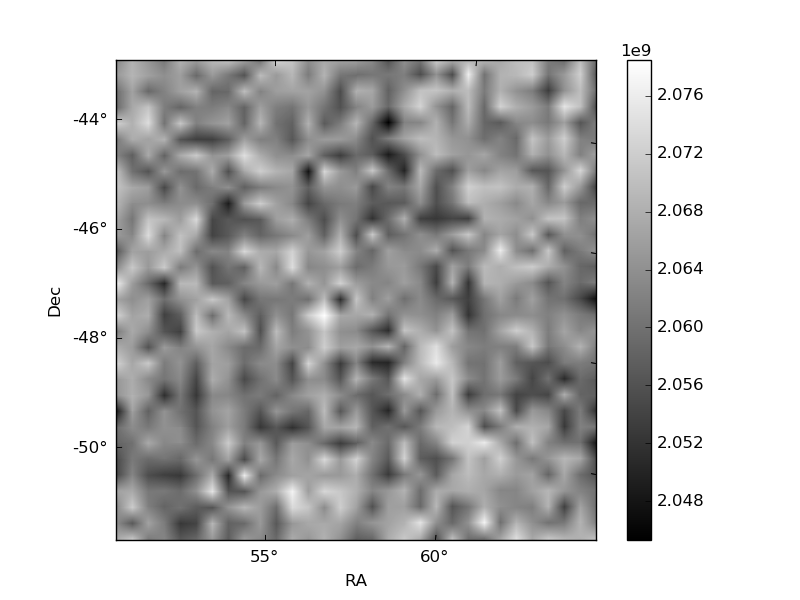
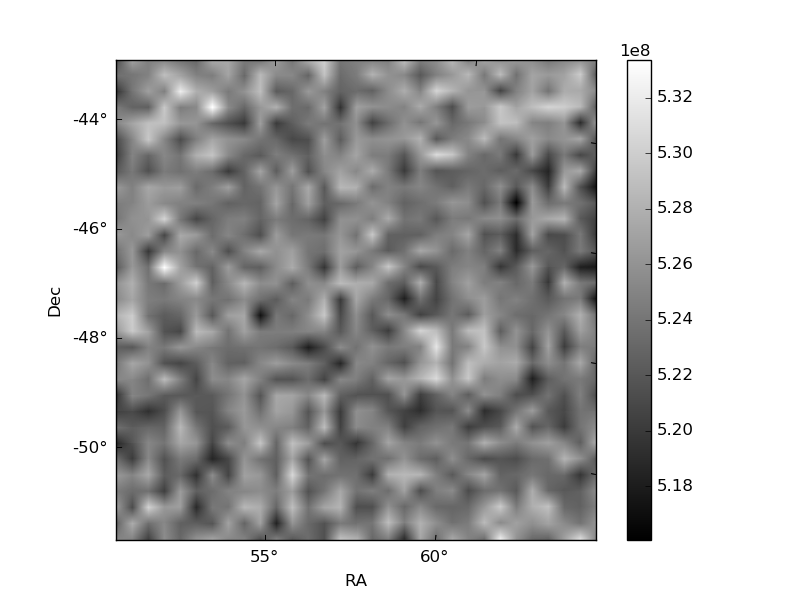
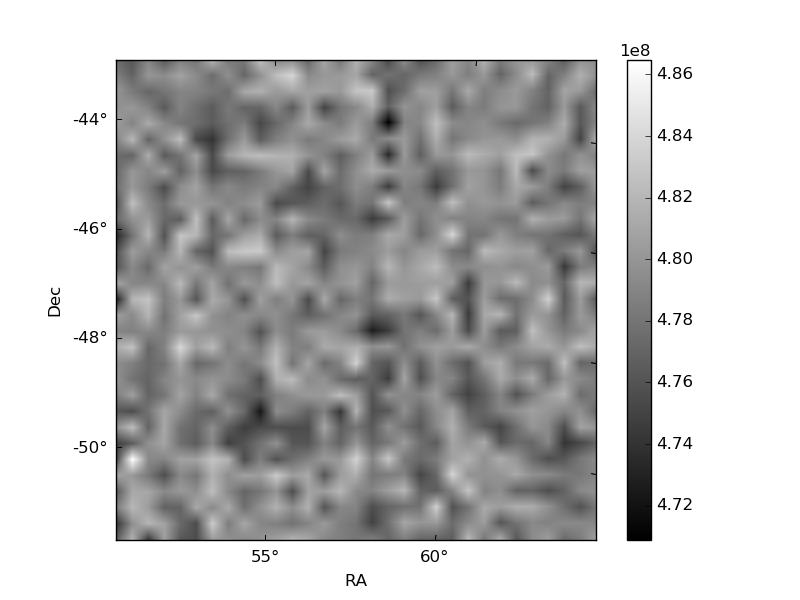
Histogram calculated using DETX and DETY for each event in the final _common_clean file
| Quadrant A | 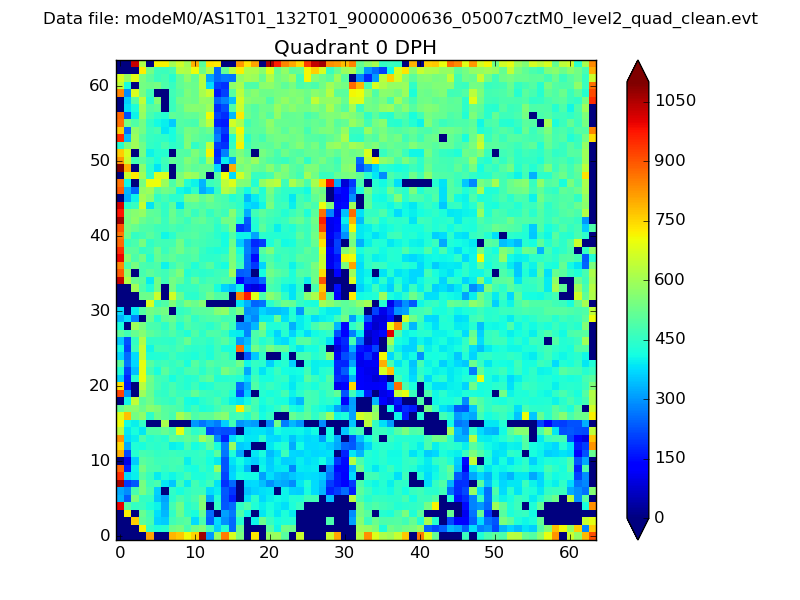 |
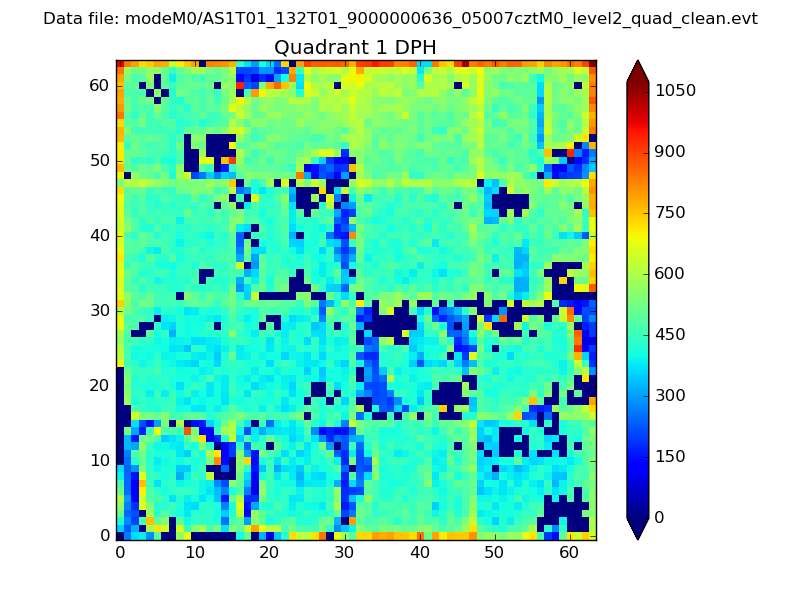 |
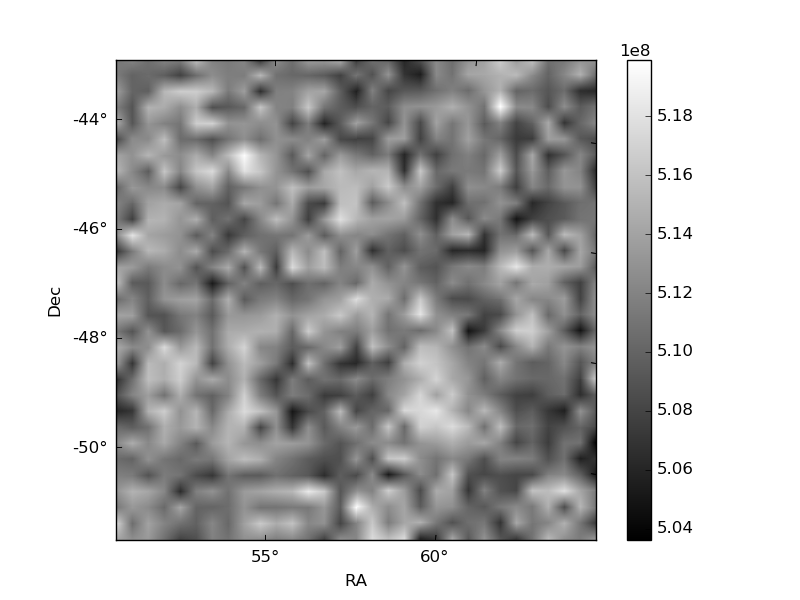
Quadrant B |
|---|---|---|---|
| Quadrant D | 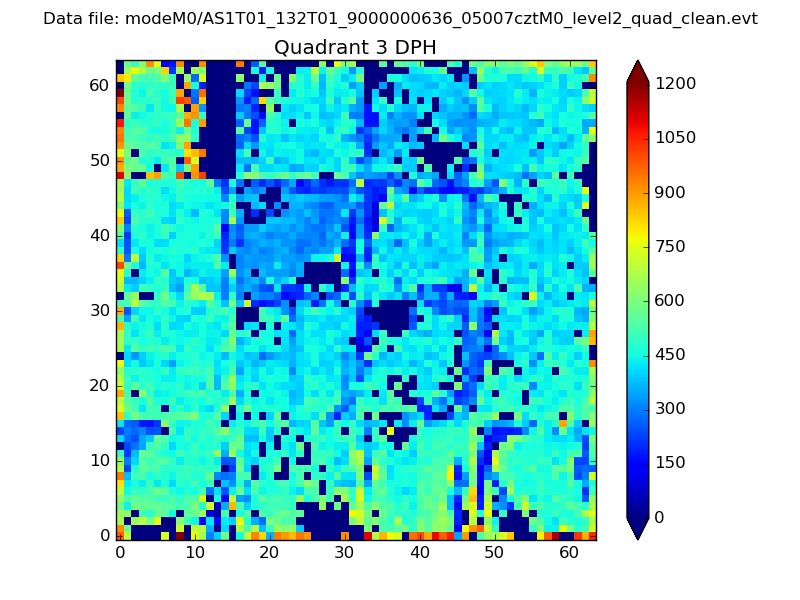 |
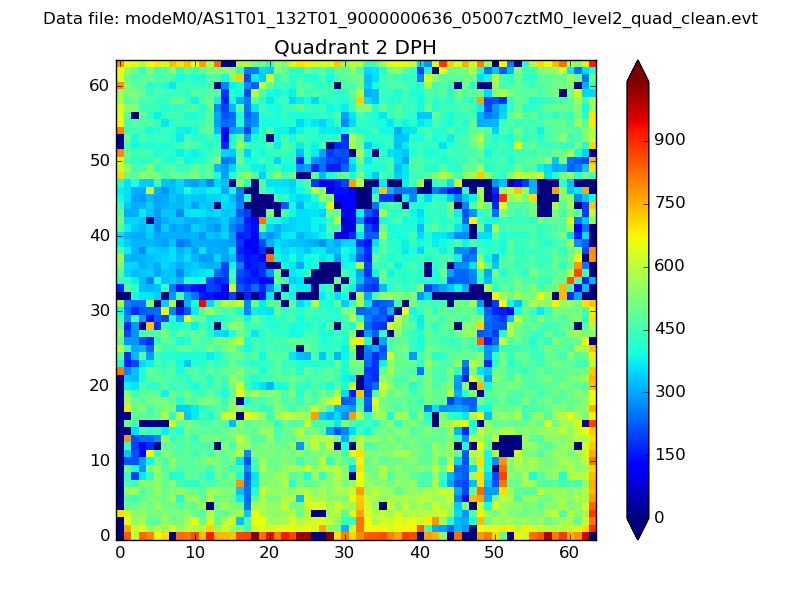 |
Quadrant C |
| Plot type | Count rate plots | Images |
|---|---|---|
| Comparison with Poisson distribution Blue bars denote a histogram of data divided into 1 sec bins. Red curve is a Poisson curve with rate = median count rate of data. |
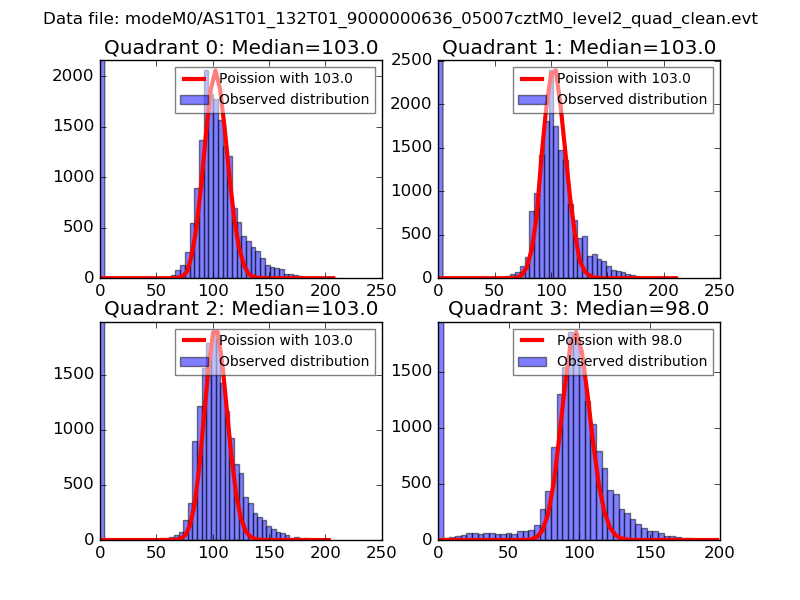 |
 |
| Quadrant-wise count rates Data is divided into 100 sec bins |
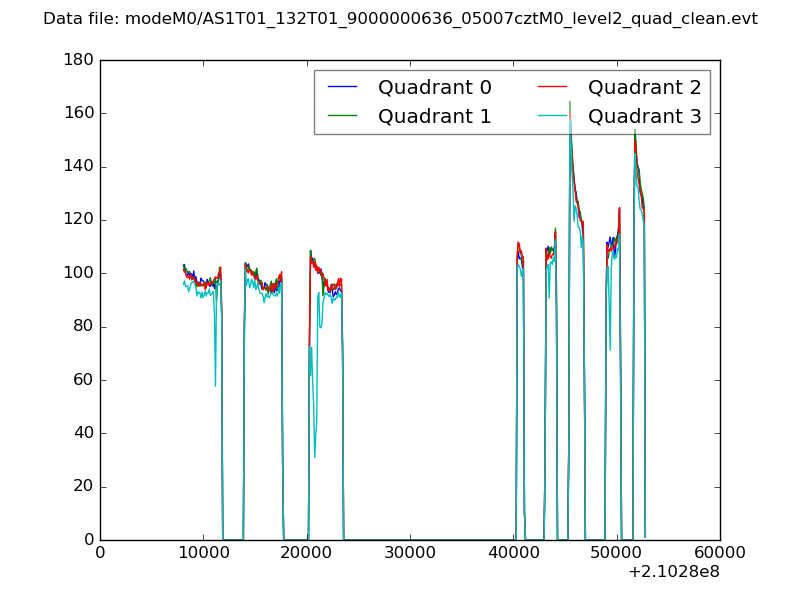 |
|
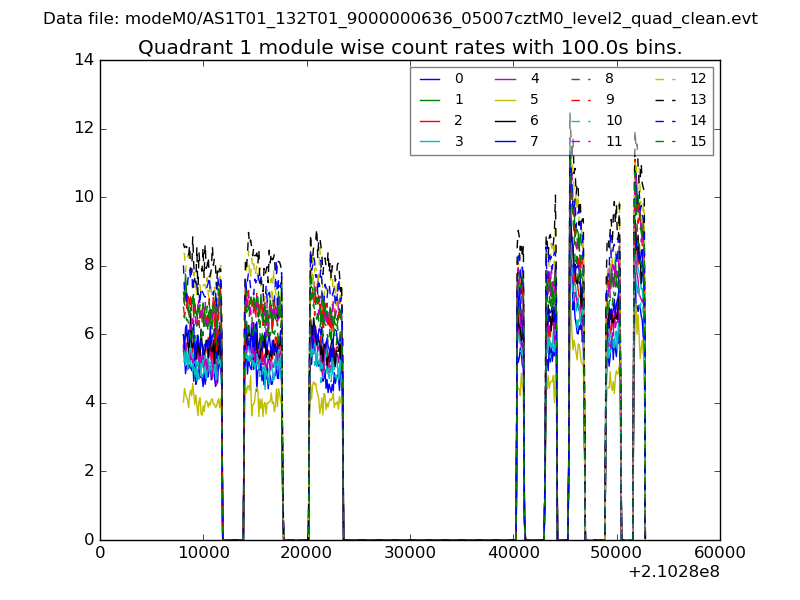
| Module-wise count rates for Quadrant A Data is divided into 100 sec bins |
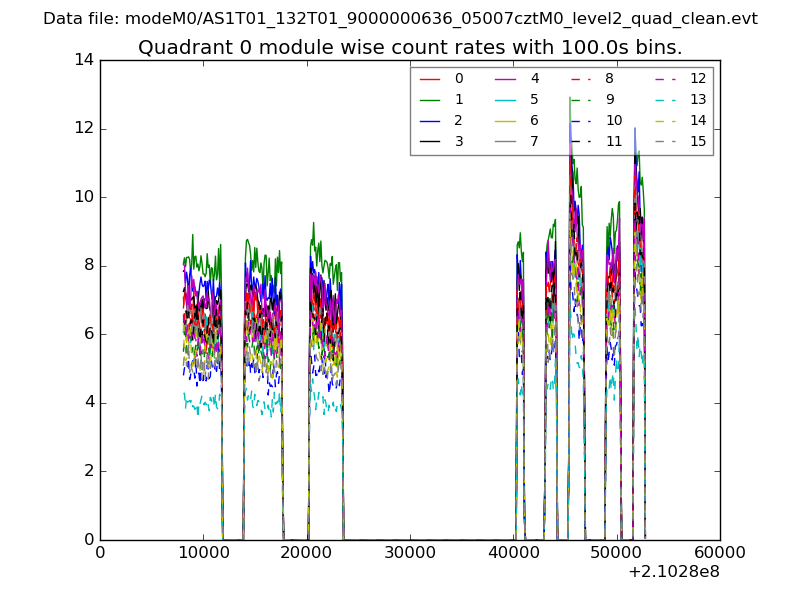 |
 |
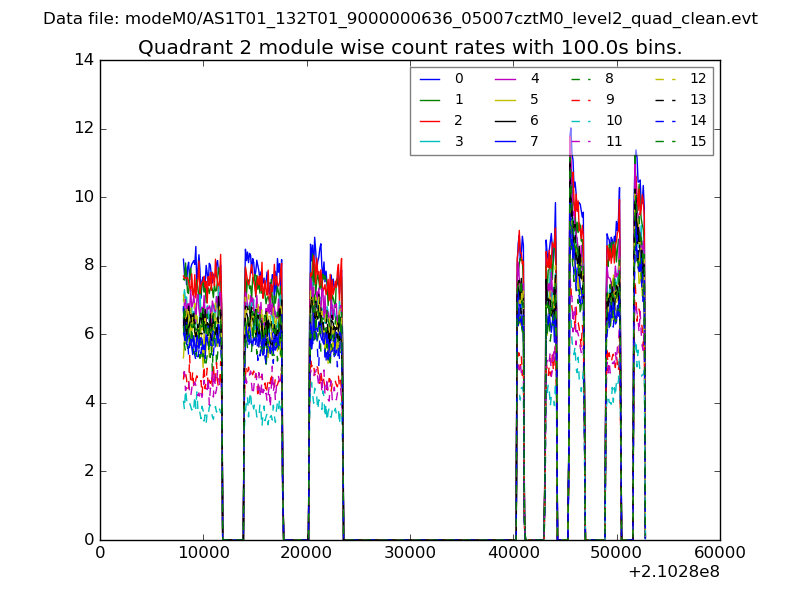
| Module-wise count rates for Quadrant B Data is divided into 100 sec bins |
 |
 |
| Module-wise count rates for Quadrant C Data is divided into 100 sec bins |
 |
 |
| Module-wise count rates for Quadrant D Data is divided into 100 sec bins |
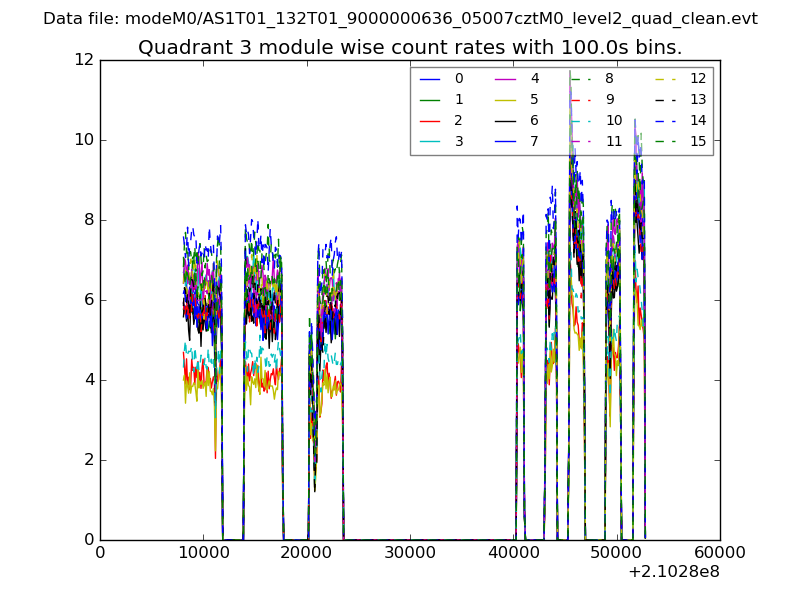 |
 |
| Parameter | Plot |
|---|---|
| CZT HV Monitor | 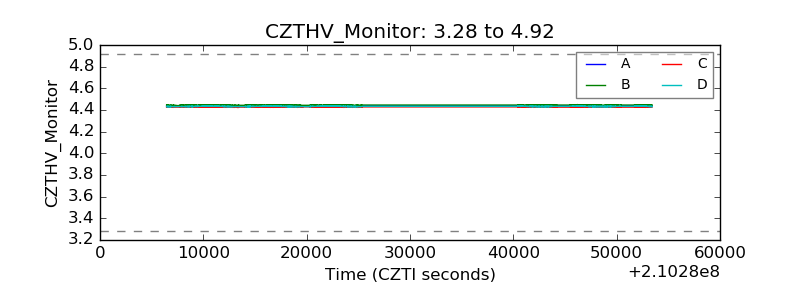 |
| D_VDD | 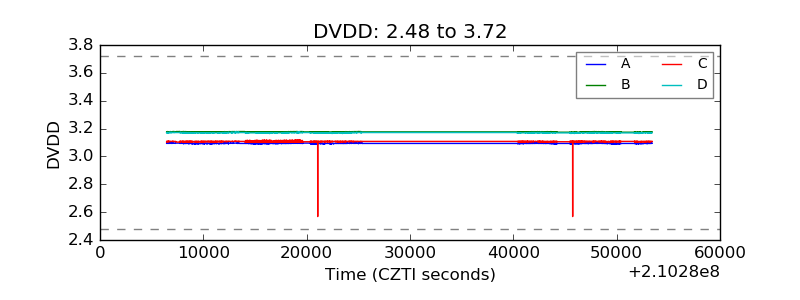 |
| Temperature 1 | 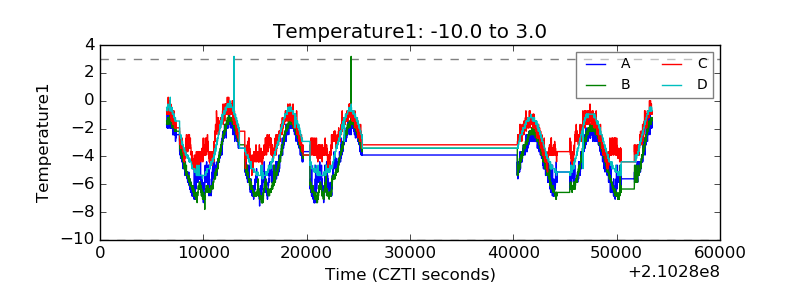 |
| Veto HV Monitor | 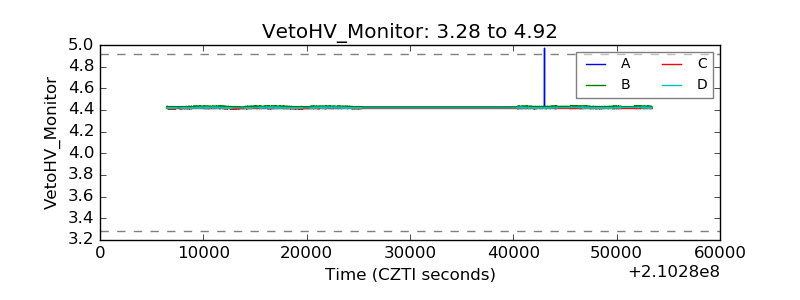 |
| Veto LLD |  |
| Alpha Counter | 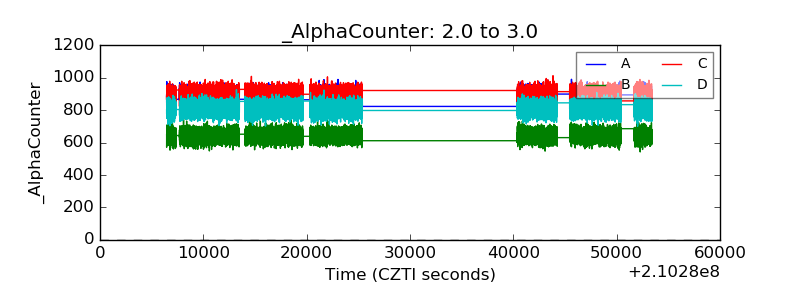 |
| _CPM_Rate | 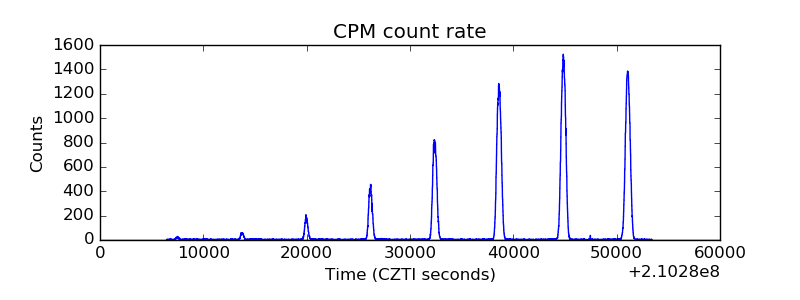 |
| CZT Counter |  |
| +2.5 Volts monitor |  |
| +5 Volts monitor |  |
| _ROLL_ROT | 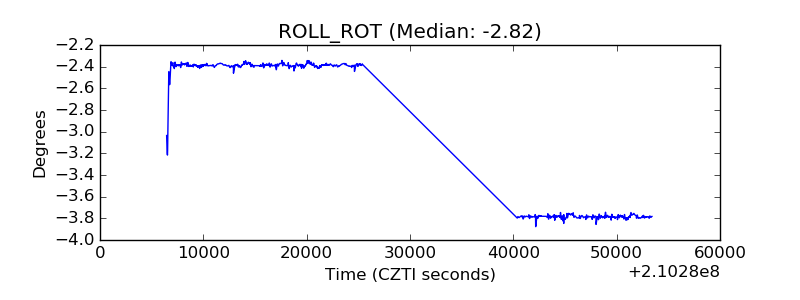 |
| _Roll_DEC | 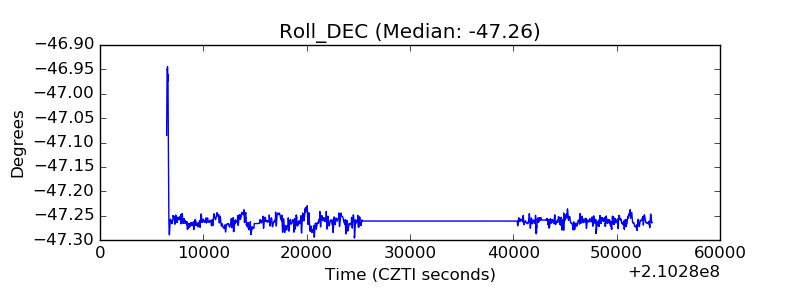 |
| _Roll_RA | 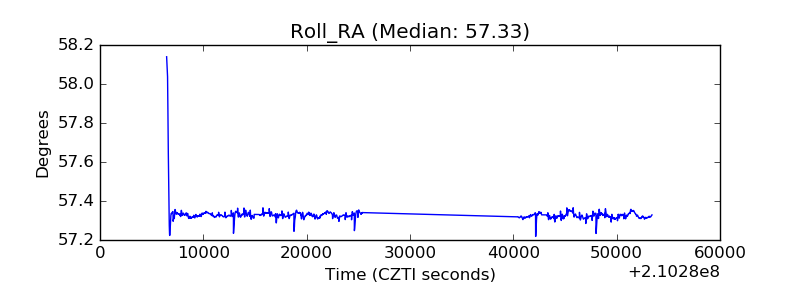 |
| Veto Counter | 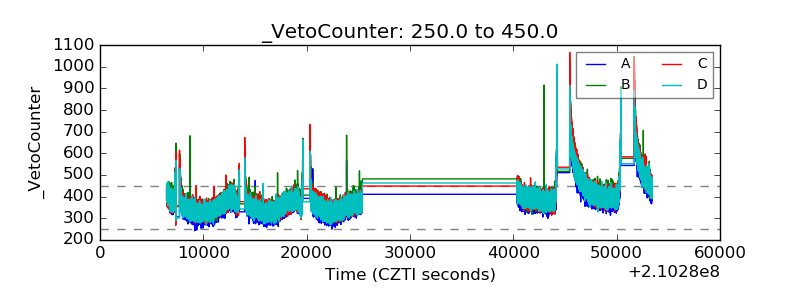 |