| Param | Original file | Final file |
|---|---|---|
| Filename | modeM0/AS1T01_132T01_9000000636_05009cztM0_level2.evt | modeM0/AS1T01_132T01_9000000636_05009cztM0_level2_quad_clean.evt |
| Size (bytes) | 505,177,920 | 59,731,200 |
| Size | 481.8 MB | 57.0 MB |
| Events in quadrant A | 3,101,486 | 345,389 |
| Events in quadrant B | 4,123,723 | 345,643 |
| Events in quadrant C | 3,091,498 | 340,723 |
| Events in quadrant D | 4,545,352 | 326,849 |
| Mode SS | |||
|---|---|---|---|
| Quadrant | BADHDUFLAG | Total packets | Discarded packets |
| A | 0 | 130 | 0 |
| B | 0 | 130 | 0 |
| C | 0 | 130 | 0 |
| D | 0 | 130 | 0 |
| Mode M0 | |||
|---|---|---|---|
| Quadrant | BADHDUFLAG | Total packets | Discarded packets |
| A | 0 | 13311 | 2 |
| B | 0 | 16432 | 1 |
| C | 0 | 13328 | 1 |
| D | 0 | 17807 | 1 |
| Mode M9 | |||
|---|---|---|---|
| Quadrant | BADHDUFLAG | Total packets | Discarded packets |
| A | 0 | 12 | 0 |
| B | 0 | 12 | 0 |
| C | 0 | 12 | 0 |
| D | 0 | 12 | 0 |
| Quadrant | Total seconds | Saturated seconds | Saturation percentage |
|---|---|---|---|
| A | 6448 | 137 | 2.124690% |
| B | 6448 | 169 | 2.620968% |
| C | 6448 | 102 | 1.581886% |
| D | 6448 | 287 | 4.450993% |
Noise dominated data is calculated using 1-second bins in cleaned event files. If a bin has >2000 counts, and if more than 50% of those come from <1% of pixels, then it is considered to be noise-dominated and hence unusable.
| Quadrant | # 1 sec bins | Bins with >0 counts | Bins with >2000 counts | High rate bins dominated by noise | Noise dominated (total time) | Noise dominated (detector-on time) | Marked lightcurve |
|---|---|---|---|---|---|---|---|
| A | 7643 | 6449 | 0 | 0 | 0.00% | 0.00% | 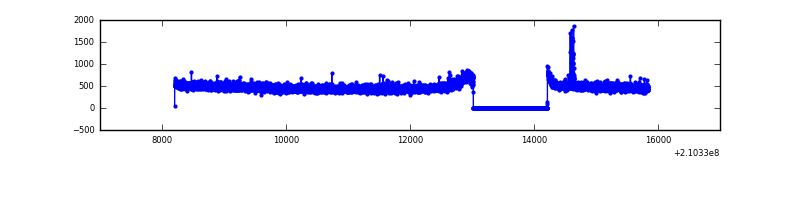 |
| B | 7643 | 6449 | 14 | 14 | 0.18% | 0.22% | 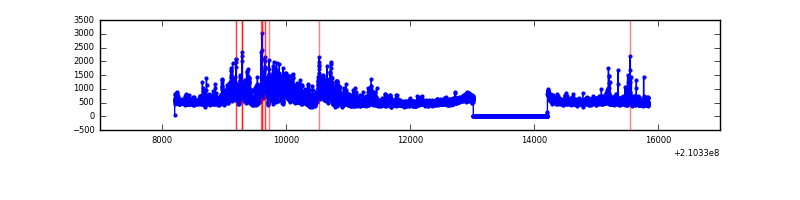 |
| C | 7643 | 6449 | 0 | 0 | 0.00% | 0.00% | 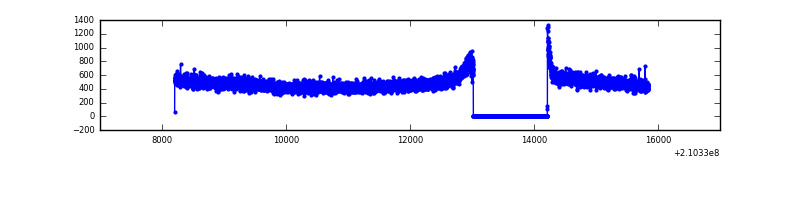 |
| D | 7643 | 6449 | 152 | 152 | 1.99% | 2.36% | 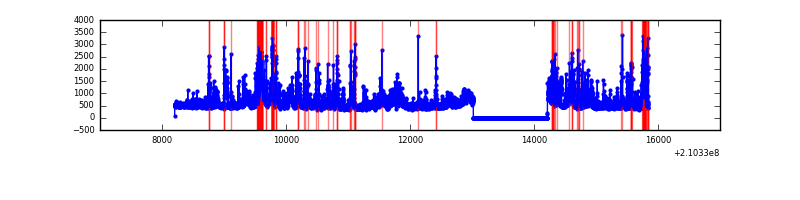 |
Top three noisy pixels from each quadrant. If the there are fewer than three noisy pixels in the level2.evt file, extra rows are filled as -1
| Pixel properties | Quadrant properties | ||||||
|---|---|---|---|---|---|---|---|
| Quadrant | DetID | PixID | Counts | Sigma | Mean | Median | Sigma |
| A | 0 | 50 | 25728 | 155.24 | 793 | 774 | 160.7 |
| A | 8 | 15 | 17535 | 104.27 | 793 | 774 | 160.7 |
| A | 0 | 226 | 7929 | 44.51 | 793 | 774 | 160.7 |
| B | 8 | 3 | 495214 | 3340.91 | 789 | 772 | 148.0 |
| B | 15 | 204 | 373694 | 2519.81 | 789 | 772 | 148.0 |
| B | 0 | 219 | 80811 | 540.81 | 789 | 772 | 148.0 |
| C | 1 | 16 | 91461 | 512.38 | 766 | 768 | 177.0 |
| C | 14 | 67 | 8808 | 45.42 | 766 | 768 | 177.0 |
| C | 13 | 61 | 6212 | 30.76 | 766 | 768 | 177.0 |
| D | 12 | 227 | 697401 | 3776.47 | 764 | 738 | 184.5 |
| D | 2 | 33 | 261829 | 1415.32 | 764 | 738 | 184.5 |
| D | 13 | 235 | 218149 | 1178.54 | 764 | 738 | 184.5 |
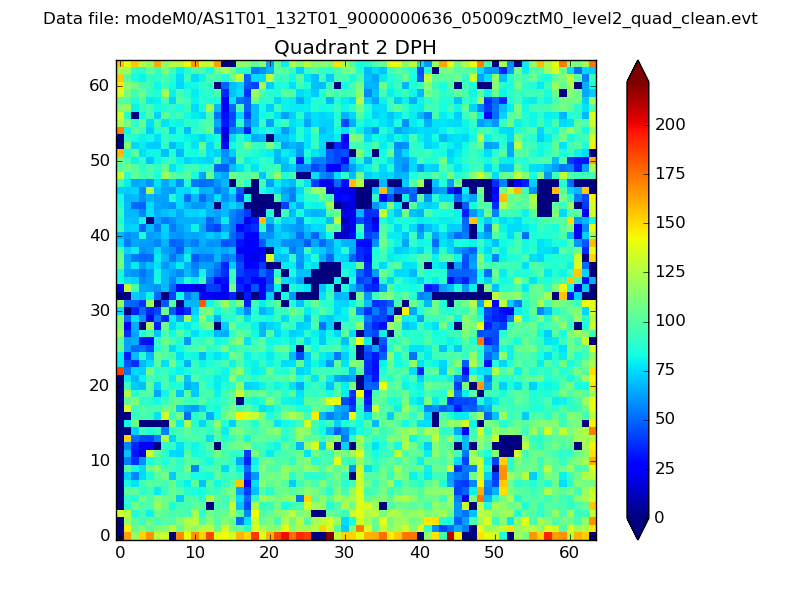
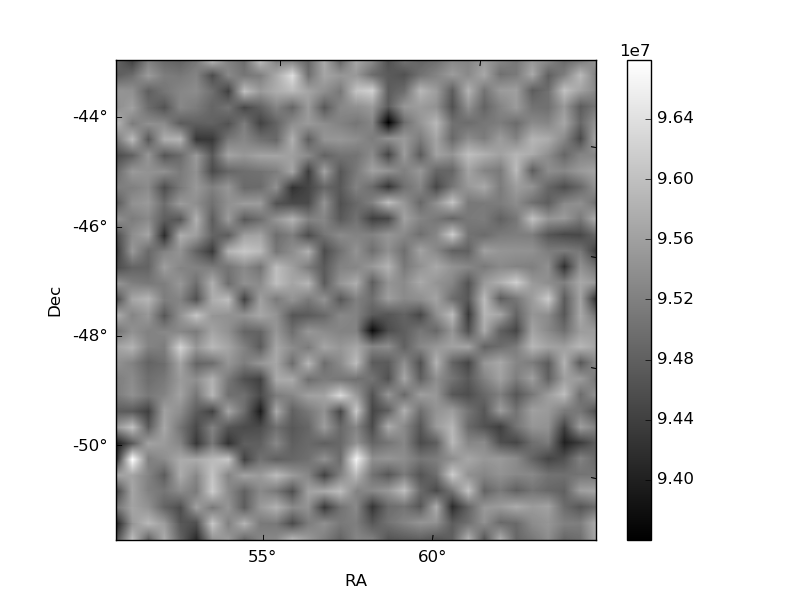
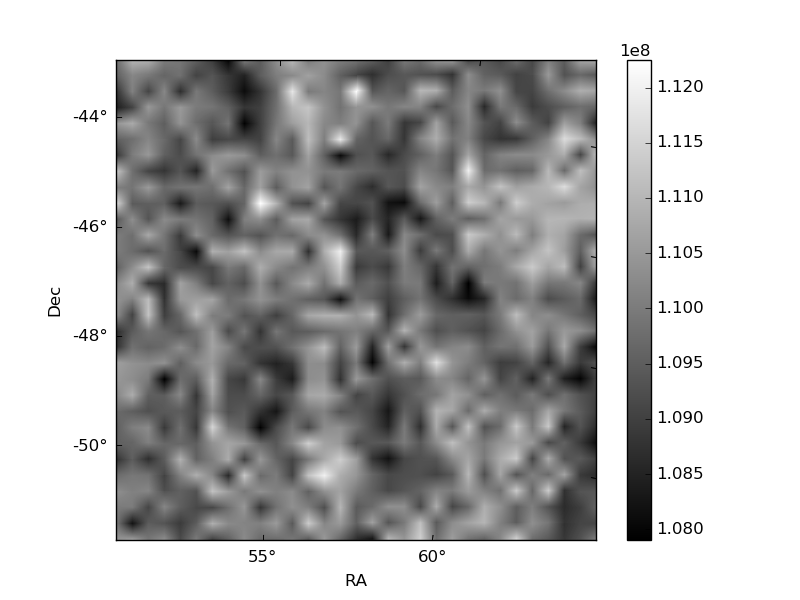
Histogram calculated using DETX and DETY for each event in the final _common_clean file
| Quadrant A | 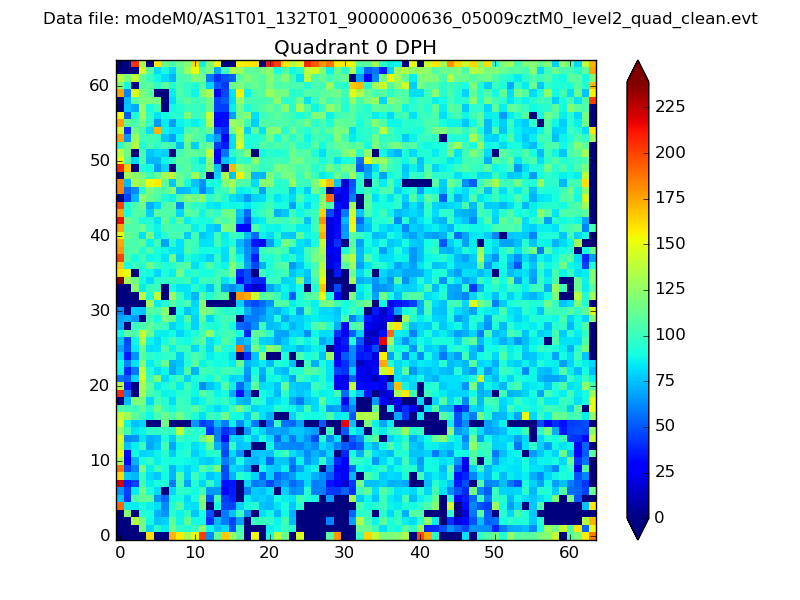 |
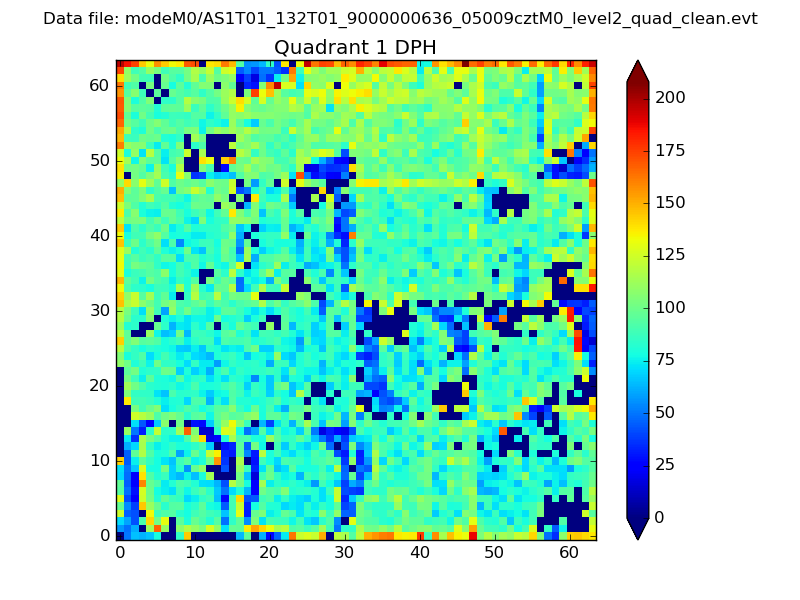 |
Quadrant B |
|---|---|---|---|
| Quadrant D | 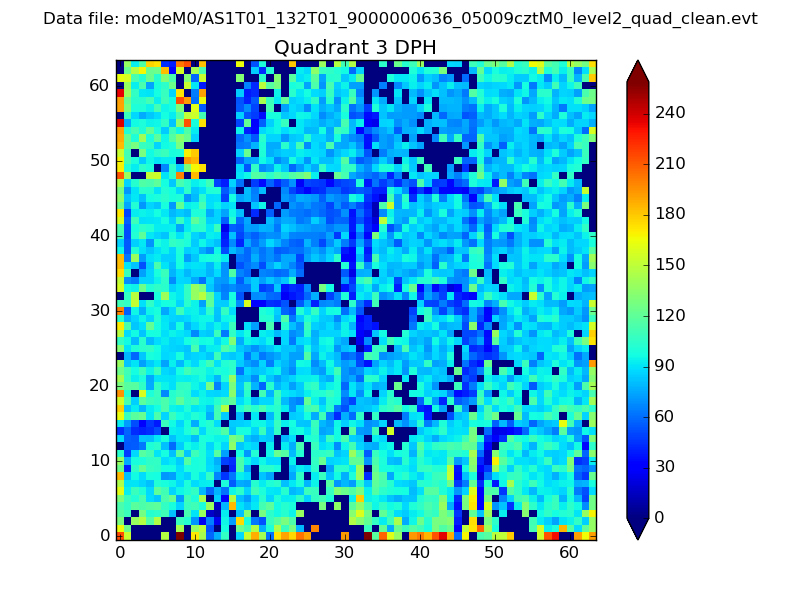 |
 |
Quadrant C |
| Plot type | Count rate plots | Images |
|---|---|---|
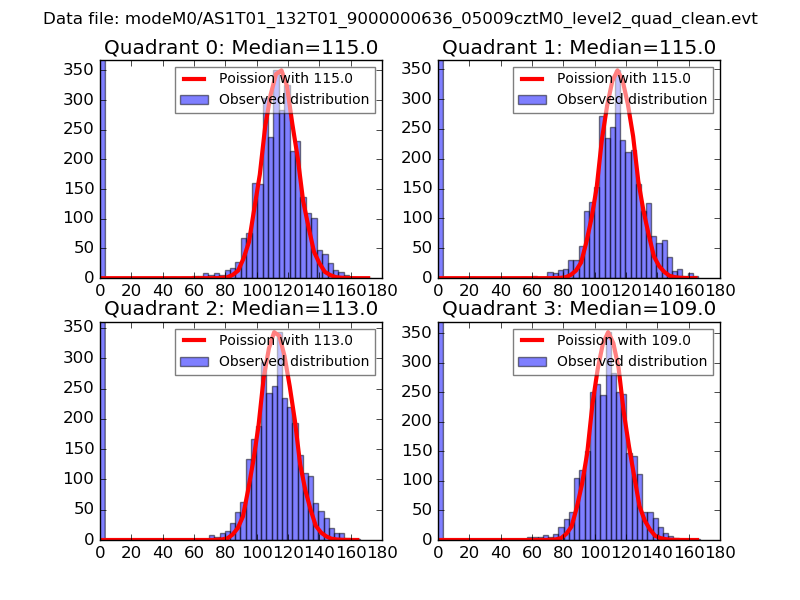
| Comparison with Poisson distribution Blue bars denote a histogram of data divided into 1 sec bins. Red curve is a Poisson curve with rate = median count rate of data. |
 |
 |
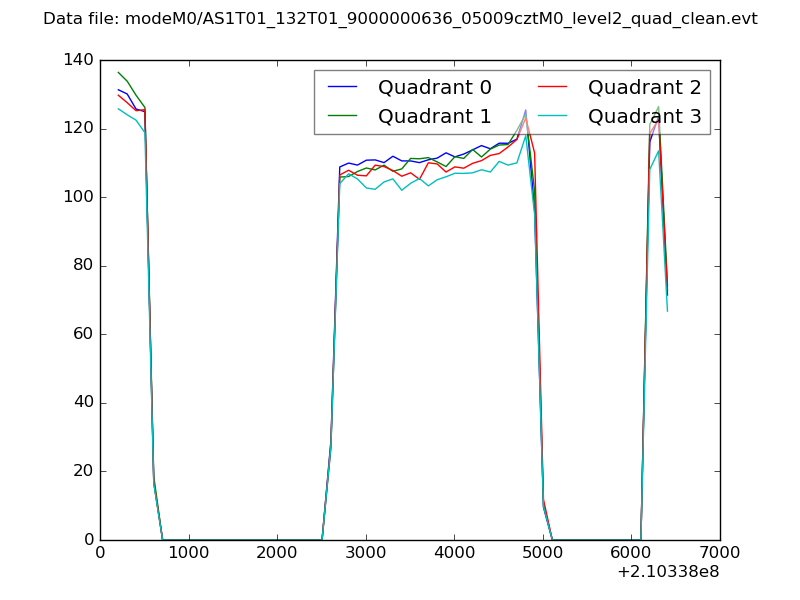
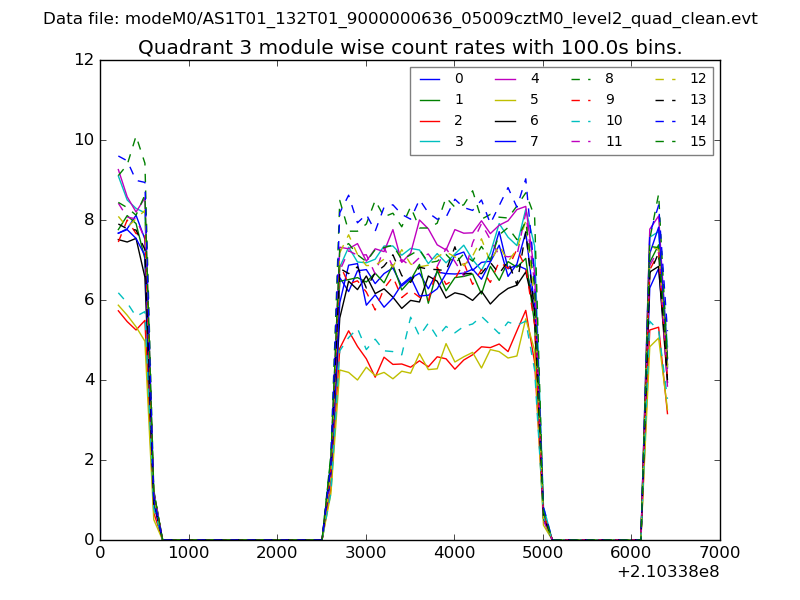
| Quadrant-wise count rates Data is divided into 100 sec bins |
 |
|
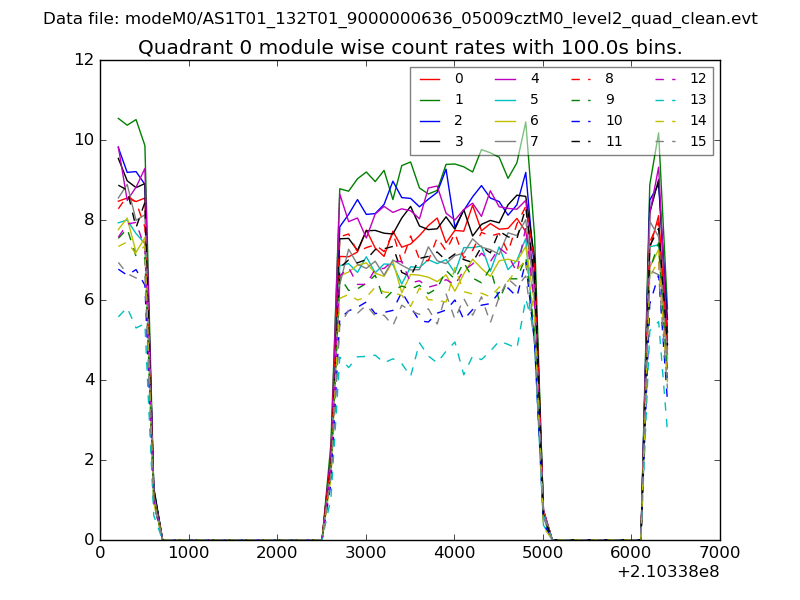
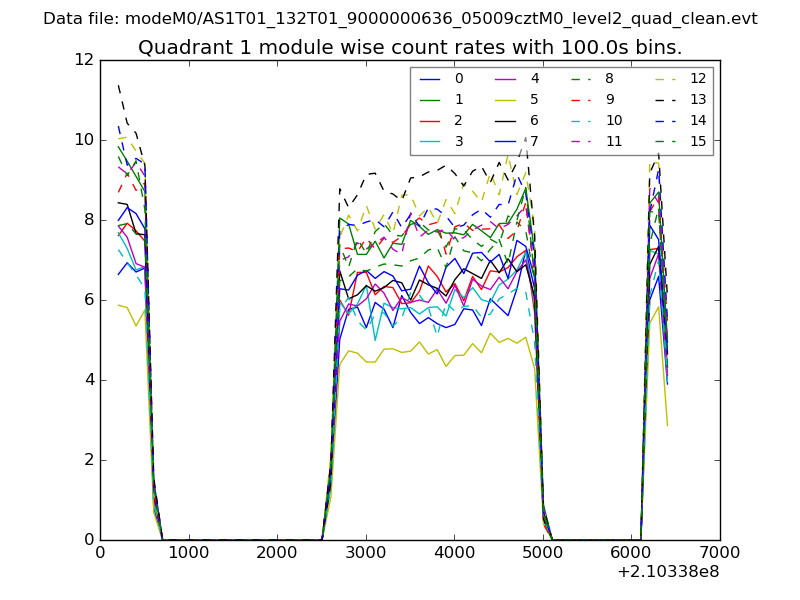
| Module-wise count rates for Quadrant A Data is divided into 100 sec bins |
 |
 |
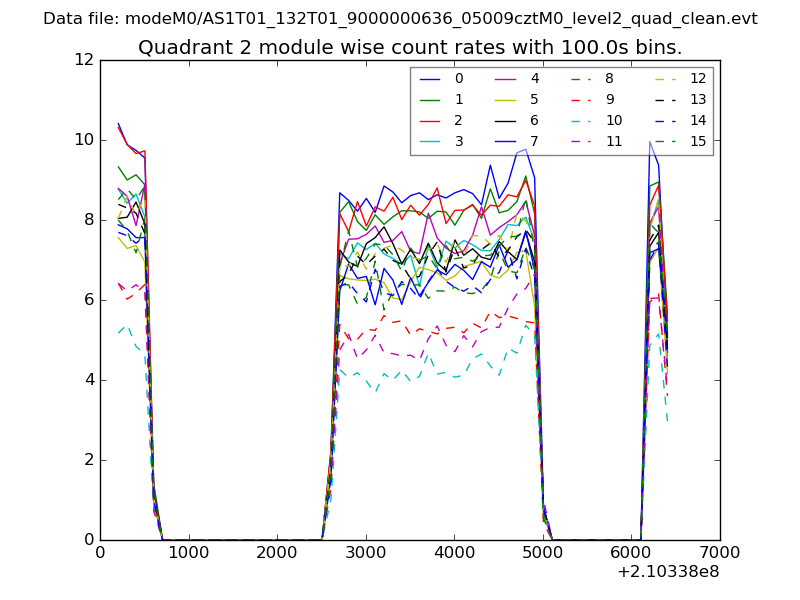
| Module-wise count rates for Quadrant B Data is divided into 100 sec bins |
 |
 |
| Module-wise count rates for Quadrant C Data is divided into 100 sec bins |
 |
 |
| Module-wise count rates for Quadrant D Data is divided into 100 sec bins |
 |
 |
| Parameter | Plot |
|---|---|
| CZT HV Monitor |  |
| D_VDD | 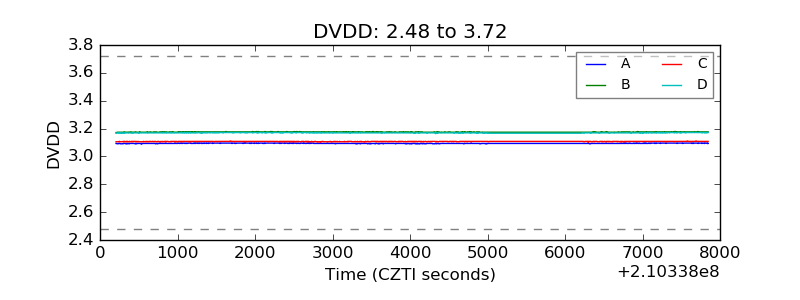 |
| Temperature 1 | 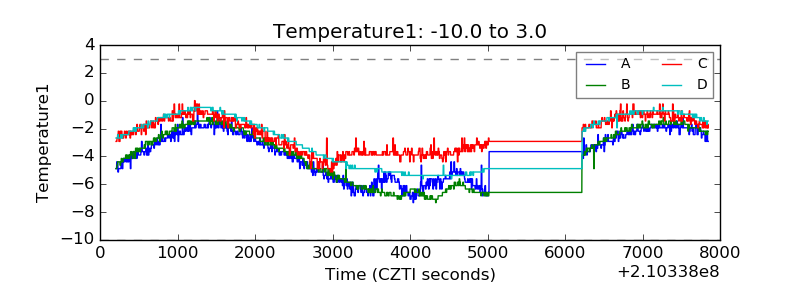 |
| Veto HV Monitor | 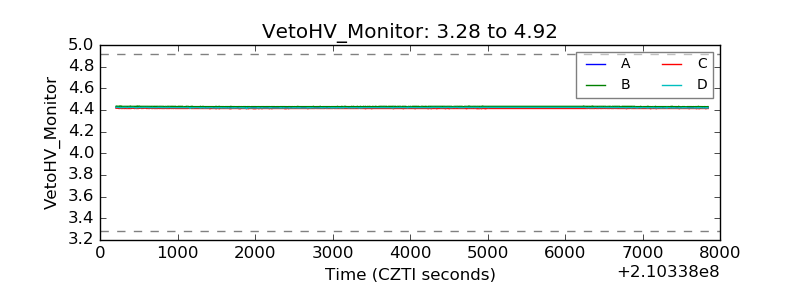 |
| Veto LLD | 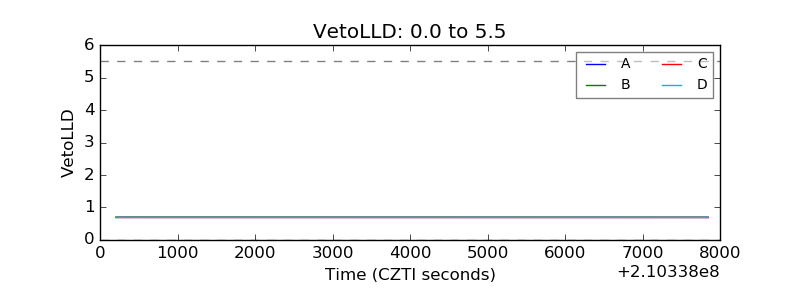 |
| Alpha Counter | 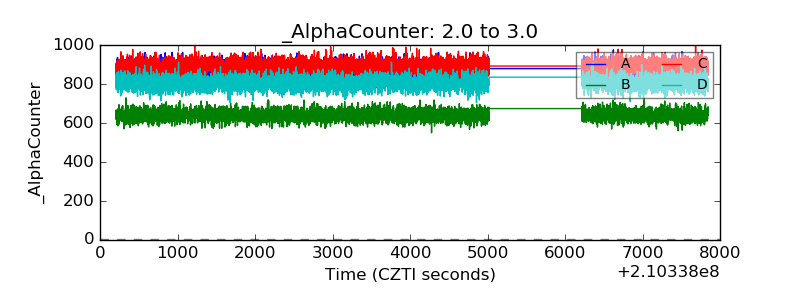 |
| _CPM_Rate | 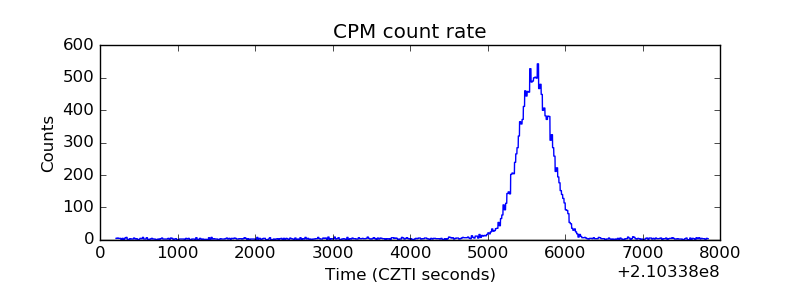 |
| CZT Counter | 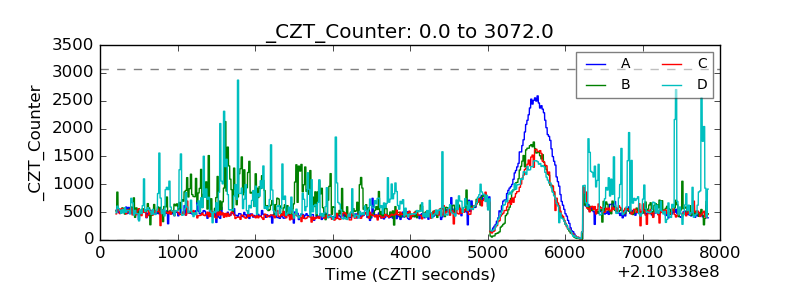 |
| +2.5 Volts monitor |  |
| +5 Volts monitor | 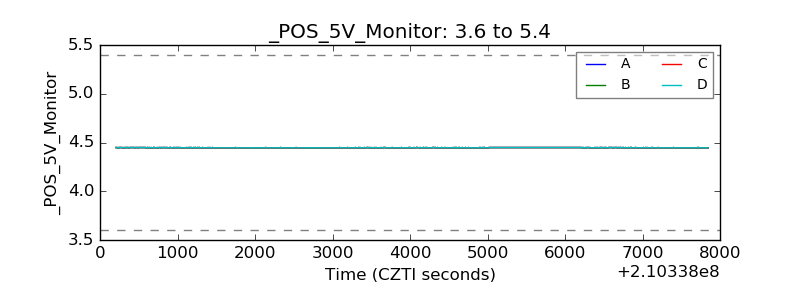 |
| _ROLL_ROT | 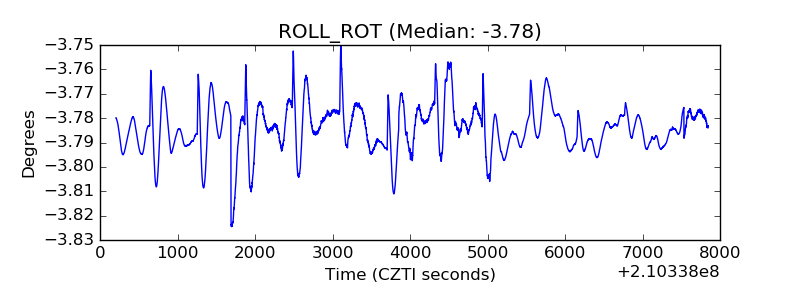 |
| _Roll_DEC | 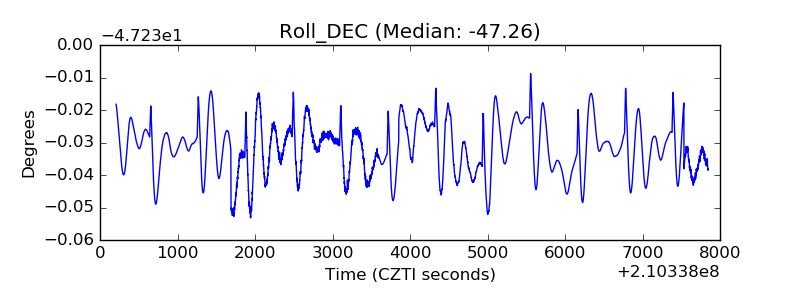 |
| _Roll_RA | 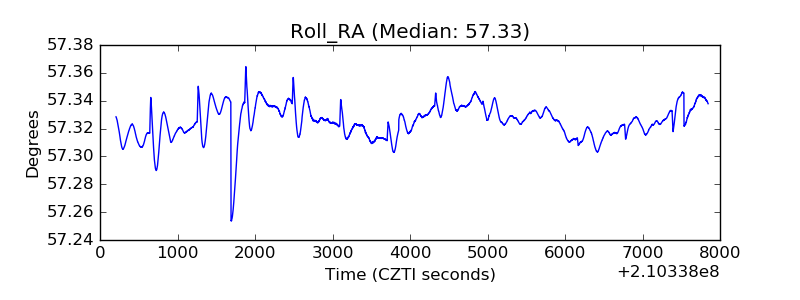 |
| Veto Counter | 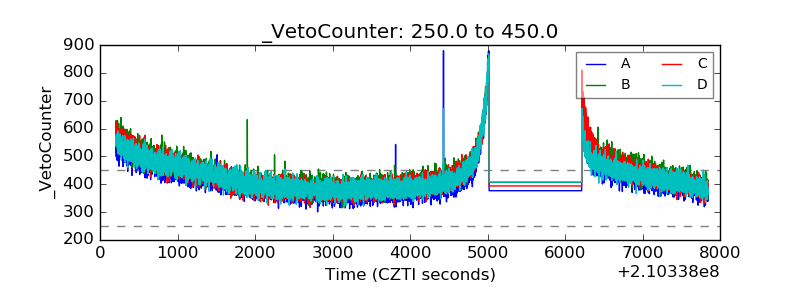 |