| Param | Original file | Final file |
|---|---|---|
| Filename | modeM0/AS1T01_132T01_9000000636_05010cztM0_level2.evt | modeM0/AS1T01_132T01_9000000636_05010cztM0_level2_quad_clean.evt |
| Size (bytes) | 492,134,400 | 58,728,960 |
| Size | 469.3 MB | 56.0 MB |
| Events in quadrant A | 3,171,706 | 333,658 |
| Events in quadrant B | 3,557,151 | 332,375 |
| Events in quadrant C | 3,236,207 | 328,970 |
| Events in quadrant D | 4,485,322 | 316,946 |
| Mode SS | |||
|---|---|---|---|
| Quadrant | BADHDUFLAG | Total packets | Discarded packets |
| A | 0 | 136 | 0 |
| B | 0 | 136 | 0 |
| C | 0 | 136 | 0 |
| D | 0 | 136 | 0 |
| Mode M0 | |||
|---|---|---|---|
| Quadrant | BADHDUFLAG | Total packets | Discarded packets |
| A | 0 | 13828 | 2 |
| B | 0 | 14789 | 1 |
| C | 0 | 13968 | 1 |
| D | 0 | 17794 | 1 |
| Mode M9 | |||
|---|---|---|---|
| Quadrant | BADHDUFLAG | Total packets | Discarded packets |
| A | 0 | 10 | 0 |
| B | 0 | 10 | 0 |
| C | 0 | 10 | 0 |
| D | 0 | 10 | 0 |
| Quadrant | Total seconds | Saturated seconds | Saturation percentage |
|---|---|---|---|
| A | 6681 | 115 | 1.721299% |
| B | 6681 | 120 | 1.796138% |
| C | 6681 | 92 | 1.377039% |
| D | 6681 | 316 | 4.729831% |
Noise dominated data is calculated using 1-second bins in cleaned event files. If a bin has >2000 counts, and if more than 50% of those come from <1% of pixels, then it is considered to be noise-dominated and hence unusable.
| Quadrant | # 1 sec bins | Bins with >0 counts | Bins with >2000 counts | High rate bins dominated by noise | Noise dominated (total time) | Noise dominated (detector-on time) | Marked lightcurve |
|---|---|---|---|---|---|---|---|
| A | 7636 | 6682 | 0 | 0 | 0.00% | 0.00% |  |
| B | 7636 | 6682 | 1 | 1 | 0.01% | 0.01% | 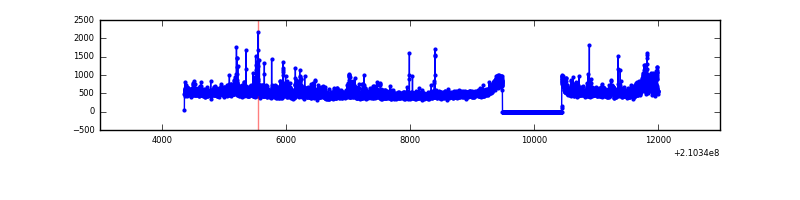 |
| C | 7636 | 6682 | 0 | 0 | 0.00% | 0.00% | 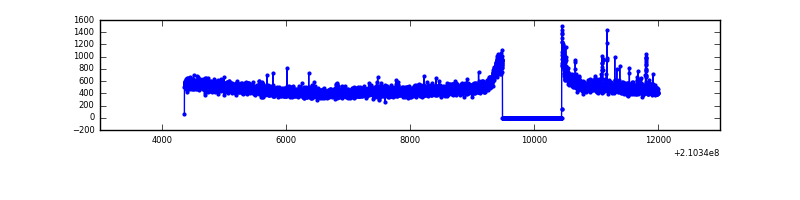 |
| D | 7636 | 6682 | 188 | 188 | 2.46% | 2.81% | 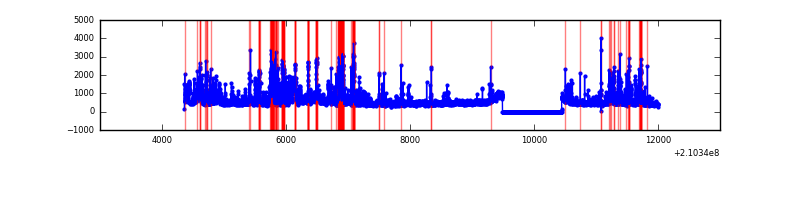 |
Top three noisy pixels from each quadrant. If the there are fewer than three noisy pixels in the level2.evt file, extra rows are filled as -1
| Pixel properties | Quadrant properties | ||||||
|---|---|---|---|---|---|---|---|
| Quadrant | DetID | PixID | Counts | Sigma | Mean | Median | Sigma |
| A | 0 | 50 | 49374 | 301.31 | 796 | 779 | 161.3 |
| A | 13 | 251 | 22592 | 135.25 | 796 | 779 | 161.3 |
| A | 8 | 15 | 16645 | 98.38 | 796 | 779 | 161.3 |
| B | 15 | 204 | 183423 | 1200.62 | 800 | 781 | 152.1 |
| B | 8 | 3 | 161780 | 1058.35 | 800 | 781 | 152.1 |
| B | 15 | 54 | 46276 | 299.07 | 800 | 781 | 152.1 |
| C | 1 | 16 | 210178 | 1174.14 | 774 | 776 | 178.3 |
| C | 13 | 61 | 6422 | 31.66 | 774 | 776 | 178.3 |
| C | 12 | 4 | 3659 | 16.17 | 774 | 776 | 178.3 |
| D | 2 | 33 | 517297 | 2774.74 | 770 | 747 | 186.2 |
| D | 12 | 227 | 373157 | 2000.46 | 770 | 747 | 186.2 |
| D | 13 | 235 | 337521 | 1809.04 | 770 | 747 | 186.2 |
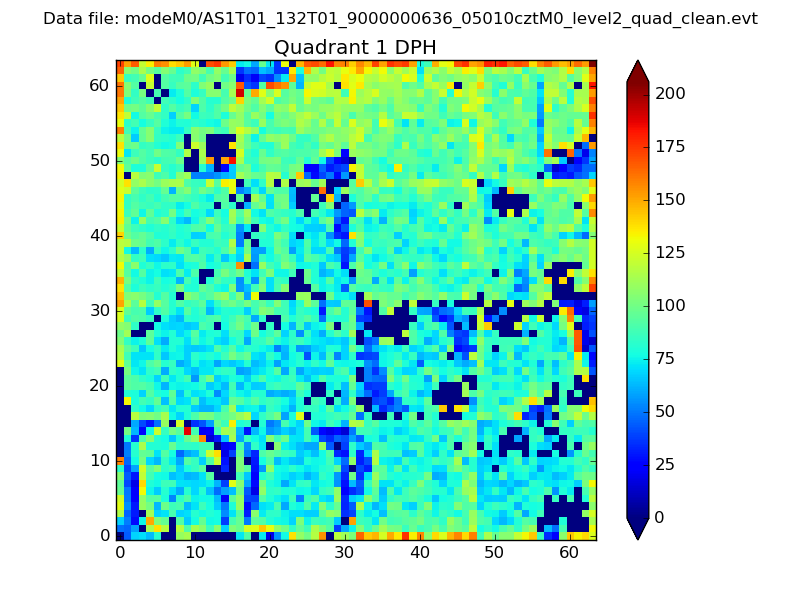
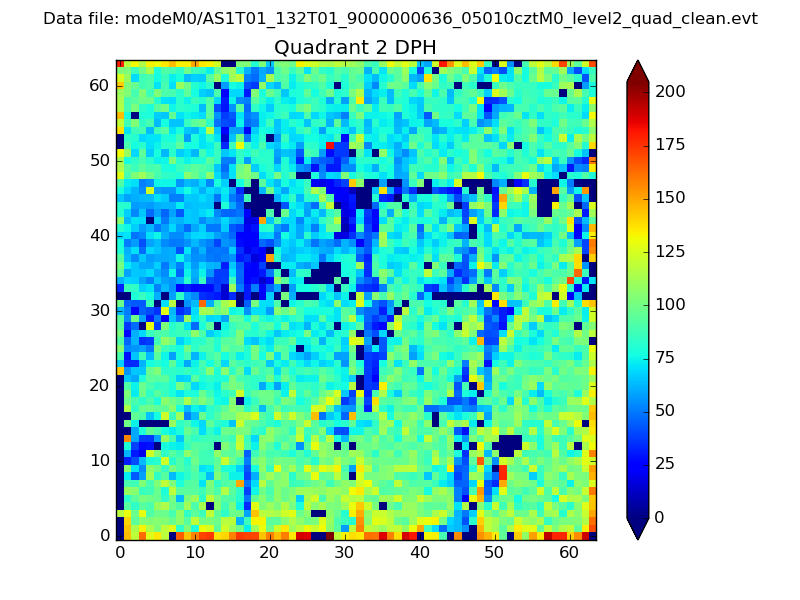
Histogram calculated using DETX and DETY for each event in the final _common_clean file
| Quadrant A | 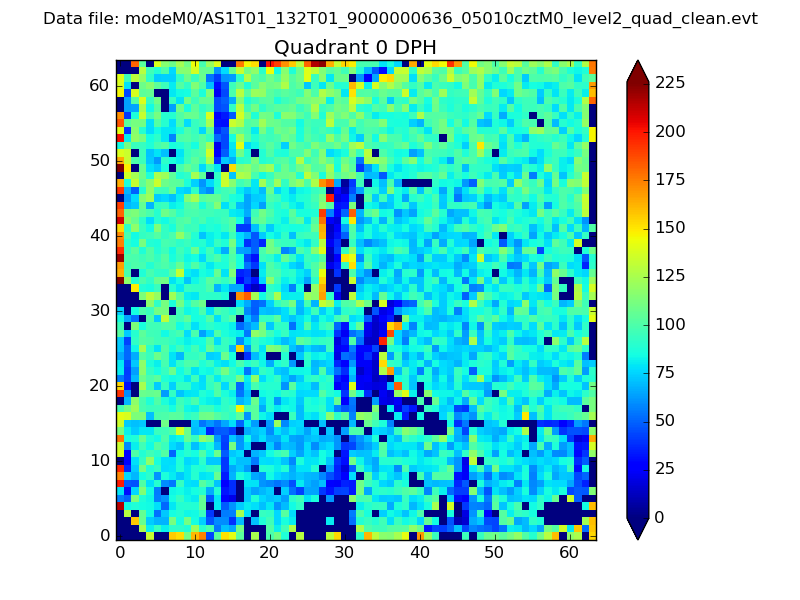 |
 |
Quadrant B |
|---|---|---|---|
| Quadrant D | 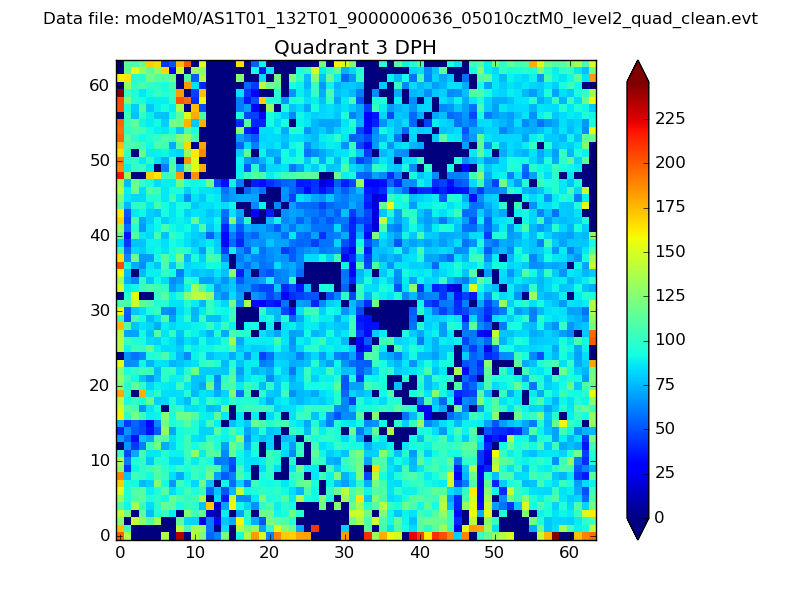 |
 |
Quadrant C |
| Plot type | Count rate plots | Images |
|---|---|---|
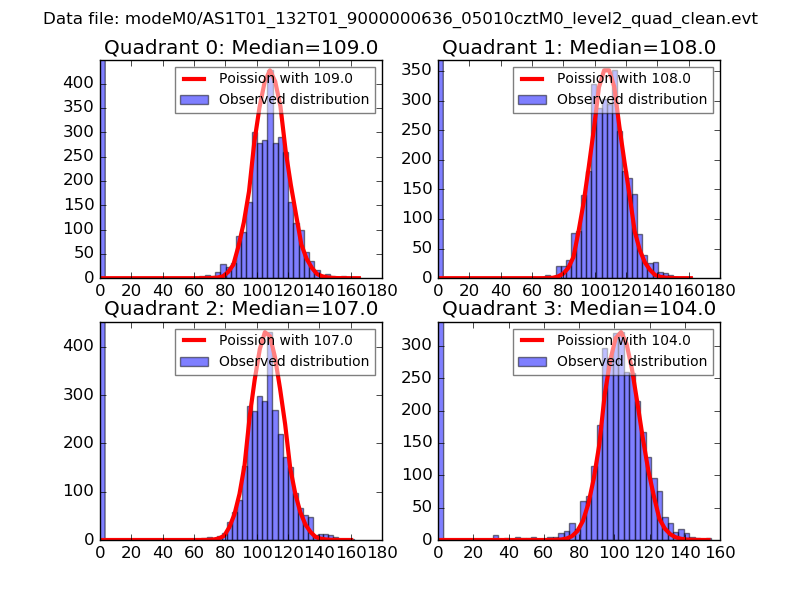
| Comparison with Poisson distribution Blue bars denote a histogram of data divided into 1 sec bins. Red curve is a Poisson curve with rate = median count rate of data. |
 |
 |
| Quadrant-wise count rates Data is divided into 100 sec bins |
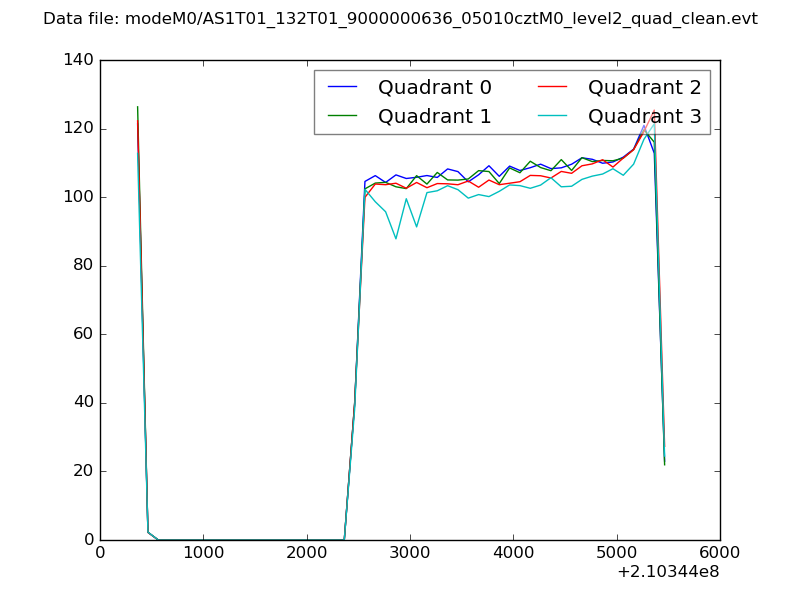 |
|
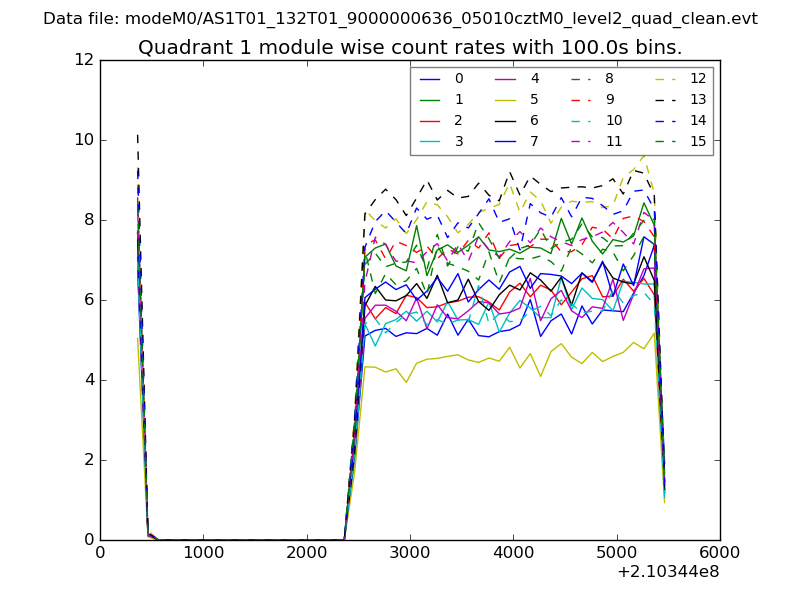
| Module-wise count rates for Quadrant A Data is divided into 100 sec bins |
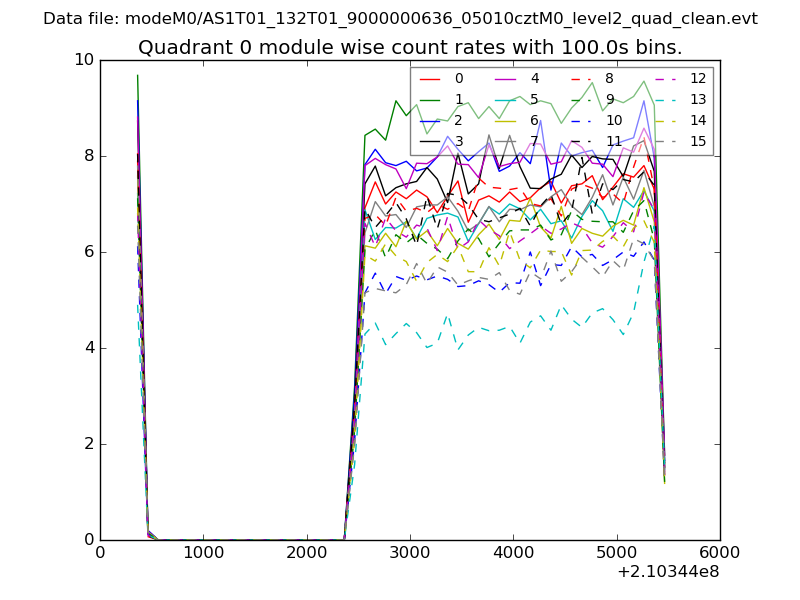 |
 |
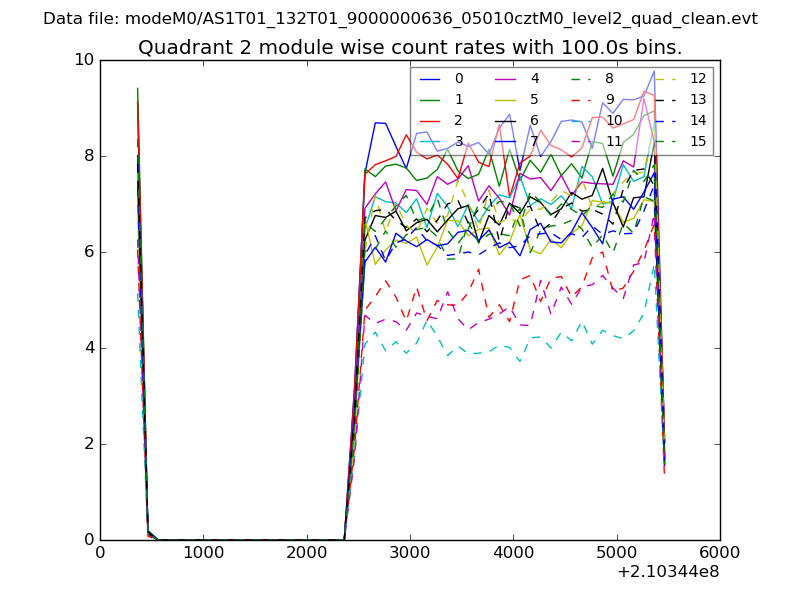
| Module-wise count rates for Quadrant B Data is divided into 100 sec bins |
 |
 |
| Module-wise count rates for Quadrant C Data is divided into 100 sec bins |
 |
 |
| Module-wise count rates for Quadrant D Data is divided into 100 sec bins |
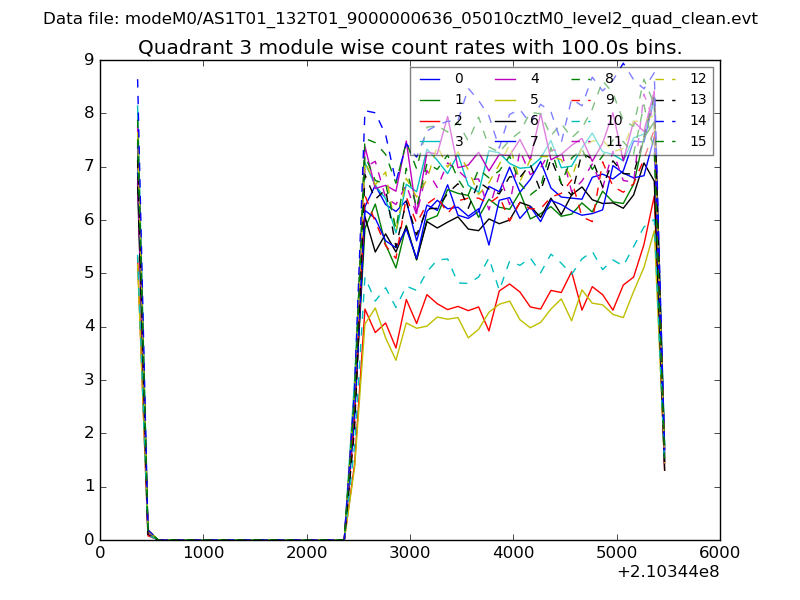 |
 |
| Parameter | Plot |
|---|---|
| CZT HV Monitor | 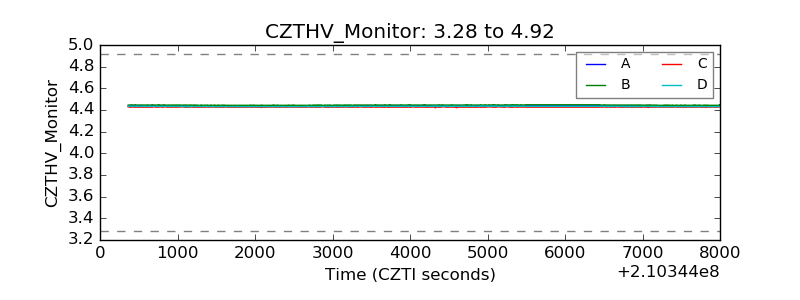 |
| D_VDD | 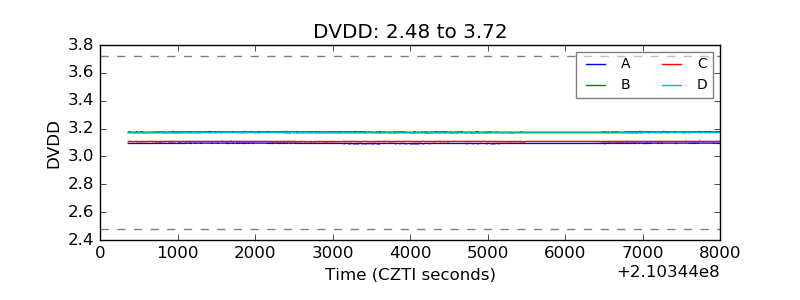 |
| Temperature 1 | 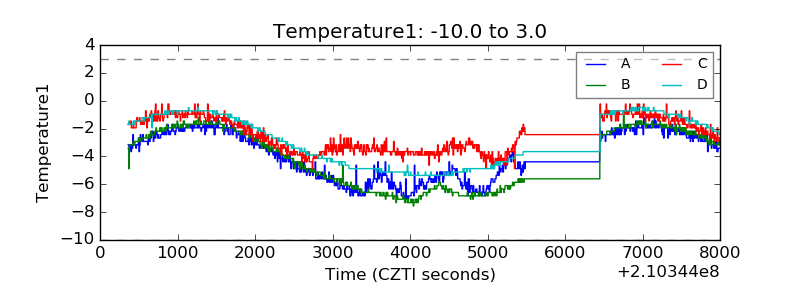 |
| Veto HV Monitor | 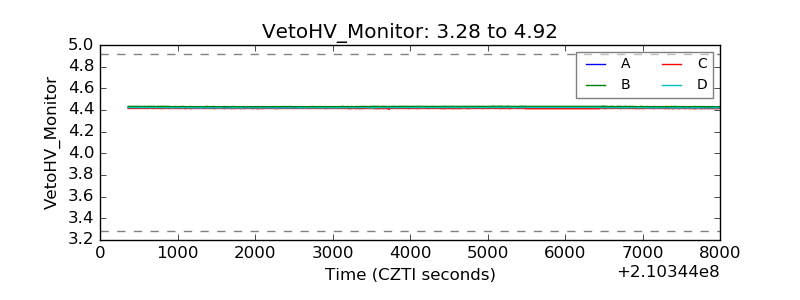 |
| Veto LLD | 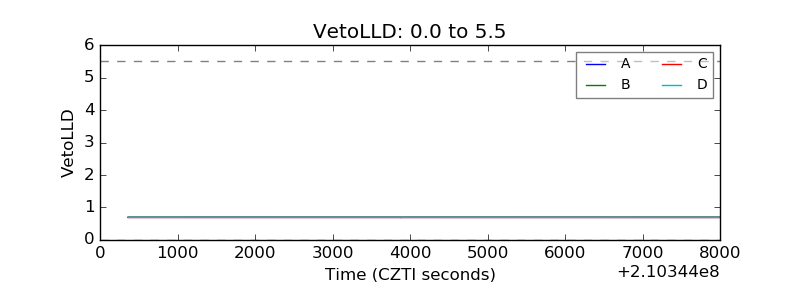 |
| Alpha Counter | 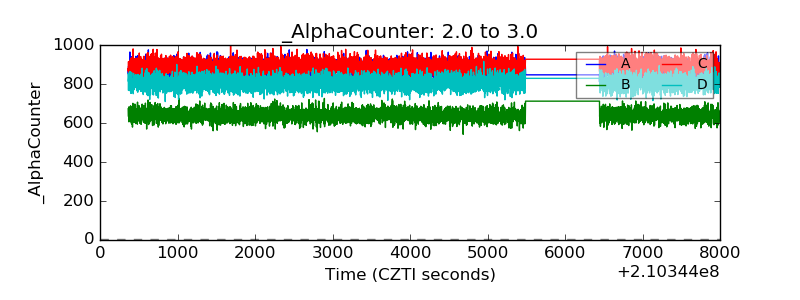 |
| _CPM_Rate | 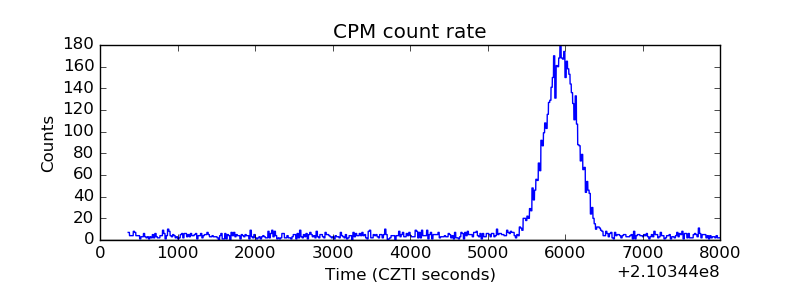 |
| CZT Counter | 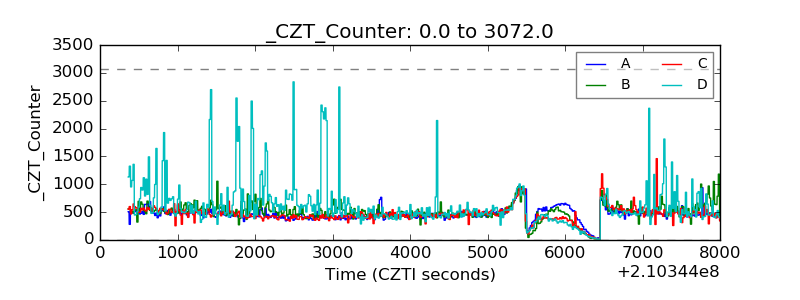 |
| +2.5 Volts monitor |  |
| +5 Volts monitor |  |
| _ROLL_ROT | 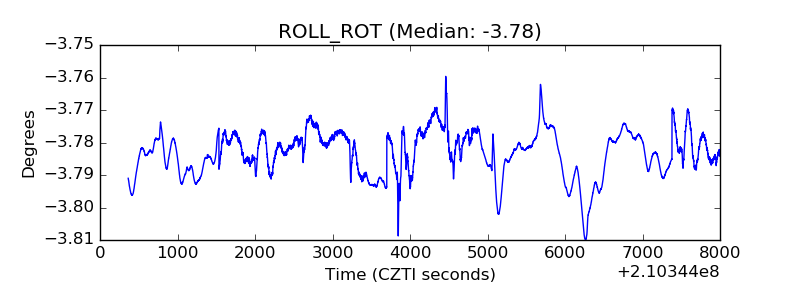 |
| _Roll_DEC | 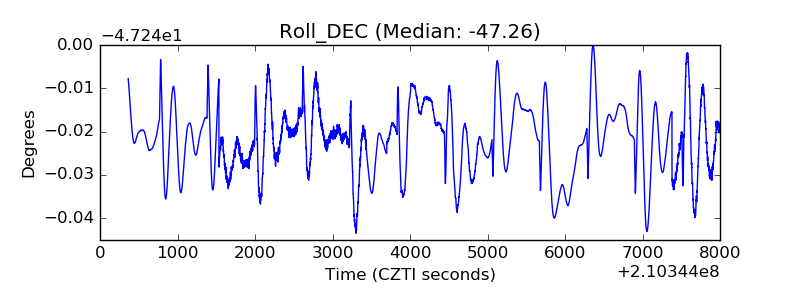 |
| _Roll_RA | 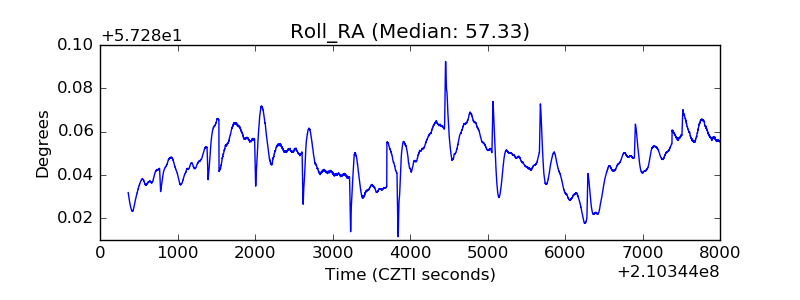 |
| Veto Counter | 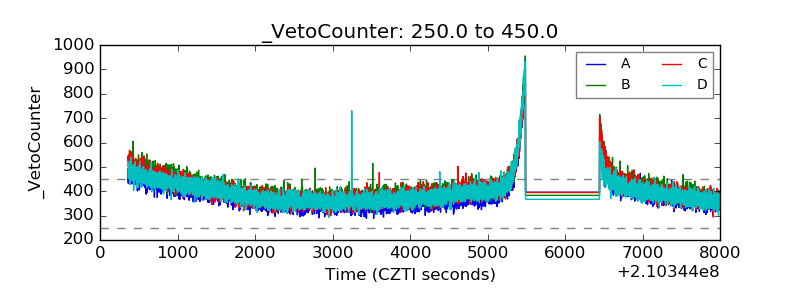 |