| Param | Original file | Final file |
|---|---|---|
| Filename | modeM0/AS1T01_132T01_9000000636_05012cztM0_level2.evt | modeM0/AS1T01_132T01_9000000636_05012cztM0_level2_quad_clean.evt |
| Size (bytes) | 917,308,800 | 133,801,920 |
| Size | 874.8 MB | 127.6 MB |
| Events in quadrant A | 6,265,305 | 798,707 |
| Events in quadrant B | 7,022,892 | 797,371 |
| Events in quadrant C | 5,917,153 | 792,630 |
| Events in quadrant D | 7,697,818 | 767,465 |
| Mode SS | |||
|---|---|---|---|
| Quadrant | BADHDUFLAG | Total packets | Discarded packets |
| A | 0 | 264 | 0 |
| B | 0 | 264 | 0 |
| C | 0 | 264 | 0 |
| D | 0 | 264 | 0 |
| Mode M0 | |||
|---|---|---|---|
| Quadrant | BADHDUFLAG | Total packets | Discarded packets |
| A | 0 | 27458 | 4 |
| B | 0 | 29478 | 3 |
| C | 0 | 26766 | 3 |
| D | 0 | 32236 | 10 |
| Mode M9 | |||
|---|---|---|---|
| Quadrant | BADHDUFLAG | Total packets | Discarded packets |
| A | 0 | 7 | 0 |
| B | 0 | 7 | 0 |
| C | 0 | 7 | 0 |
| D | 0 | 7 | 0 |
| Quadrant | Total seconds | Saturated seconds | Saturation percentage |
|---|---|---|---|
| A | 12962 | 243 | 1.874711% |
| B | 12962 | 273 | 2.106156% |
| C | 12962 | 90 | 0.694337% |
| D | 12961 | 452 | 3.487385% |
Noise dominated data is calculated using 1-second bins in cleaned event files. If a bin has >2000 counts, and if more than 50% of those come from <1% of pixels, then it is considered to be noise-dominated and hence unusable.
| Quadrant | # 1 sec bins | Bins with >0 counts | Bins with >2000 counts | High rate bins dominated by noise | Noise dominated (total time) | Noise dominated (detector-on time) | Marked lightcurve |
|---|---|---|---|---|---|---|---|
| A | 13677 | 12965 | 27 | 27 | 0.20% | 0.21% |  |
| B | 13677 | 12965 | 12 | 12 | 0.09% | 0.09% | 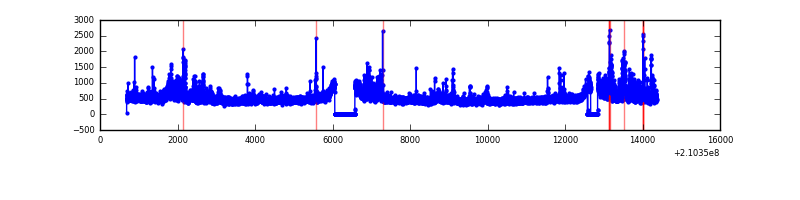 |
| C | 13677 | 12965 | 1 | 1 | 0.01% | 0.01% | 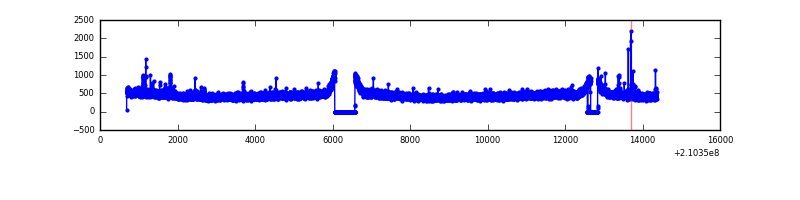 |
| D | 13677 | 12965 | 321 | 321 | 2.35% | 2.48% | 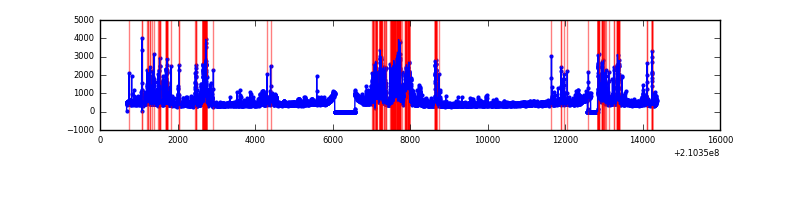 |
Top three noisy pixels from each quadrant. If the there are fewer than three noisy pixels in the level2.evt file, extra rows are filled as -1
| Pixel properties | Quadrant properties | ||||||
|---|---|---|---|---|---|---|---|
| Quadrant | DetID | PixID | Counts | Sigma | Mean | Median | Sigma |
| A | 4 | 2 | 222967 | 716.12 | 1513 | 1475 | 309.3 |
| A | 13 | 251 | 141037 | 451.23 | 1513 | 1475 | 309.3 |
| A | 0 | 50 | 33451 | 103.38 | 1513 | 1475 | 309.3 |
| B | 8 | 3 | 540928 | 1874.78 | 1517 | 1478 | 287.7 |
| B | 15 | 204 | 248618 | 858.9 | 1517 | 1478 | 287.7 |
| B | 0 | 219 | 140913 | 484.59 | 1517 | 1478 | 287.7 |
| C | 1 | 16 | 157868 | 461.9 | 1468 | 1476 | 338.6 |
| C | 13 | 61 | 11893 | 30.77 | 1468 | 1476 | 338.6 |
| C | 9 | 54 | 10380 | 26.3 | 1468 | 1476 | 338.6 |
| D | 2 | 33 | 1008853 | 2844.4 | 1457 | 1413 | 354.2 |
| D | 12 | 227 | 594366 | 1674.14 | 1457 | 1413 | 354.2 |
| D | 13 | 235 | 200117 | 561.02 | 1457 | 1413 | 354.2 |
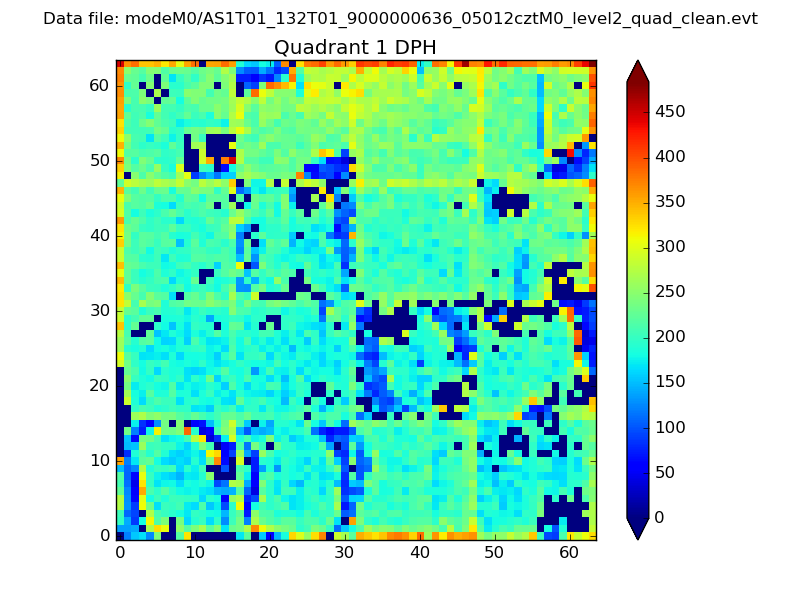
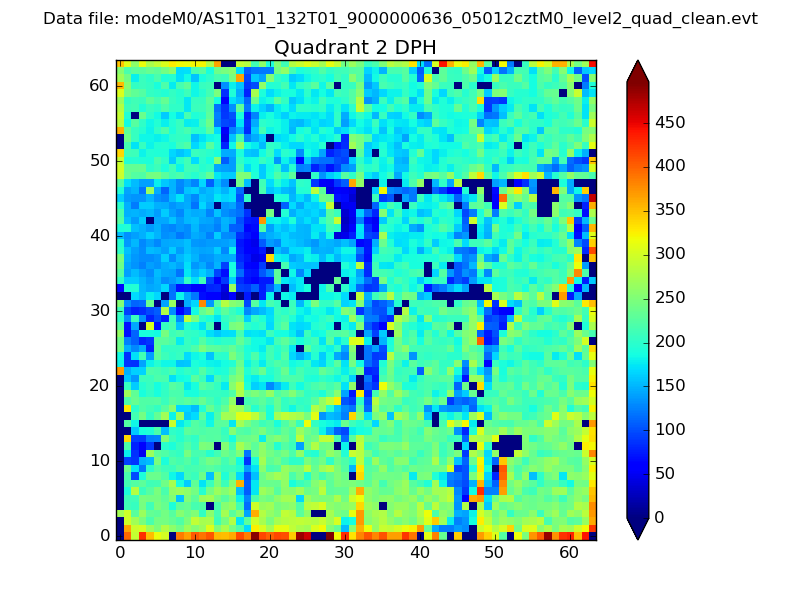
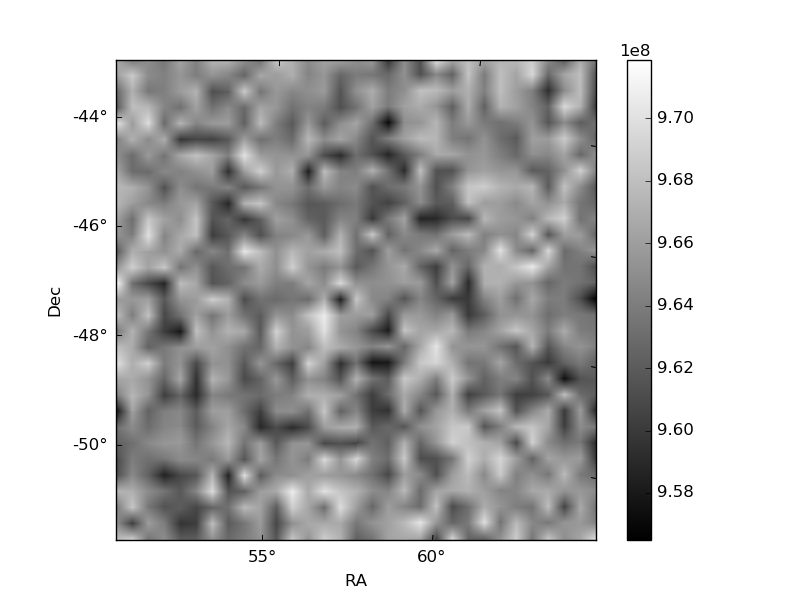
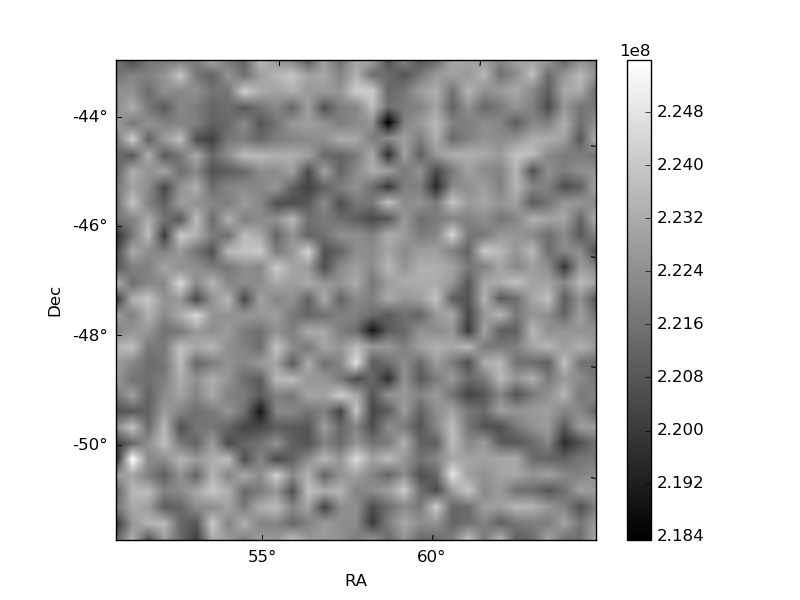
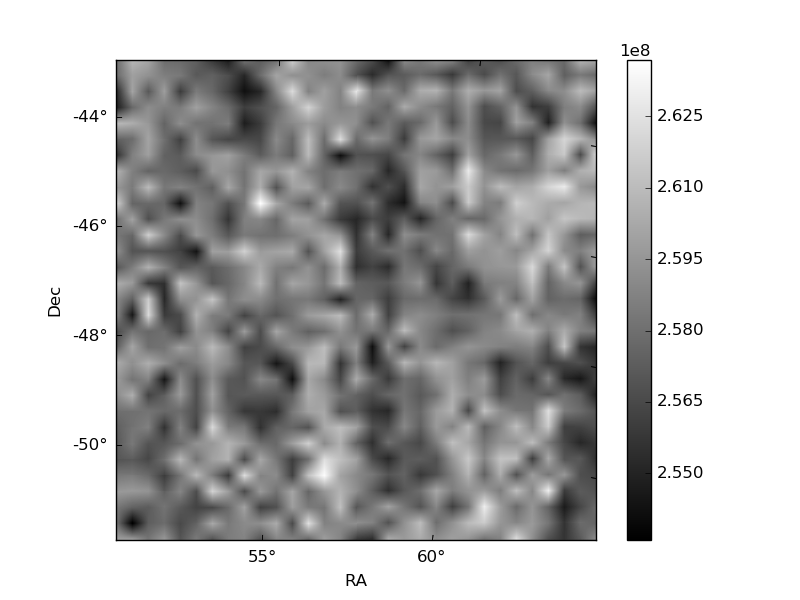
Histogram calculated using DETX and DETY for each event in the final _common_clean file
| Quadrant A | 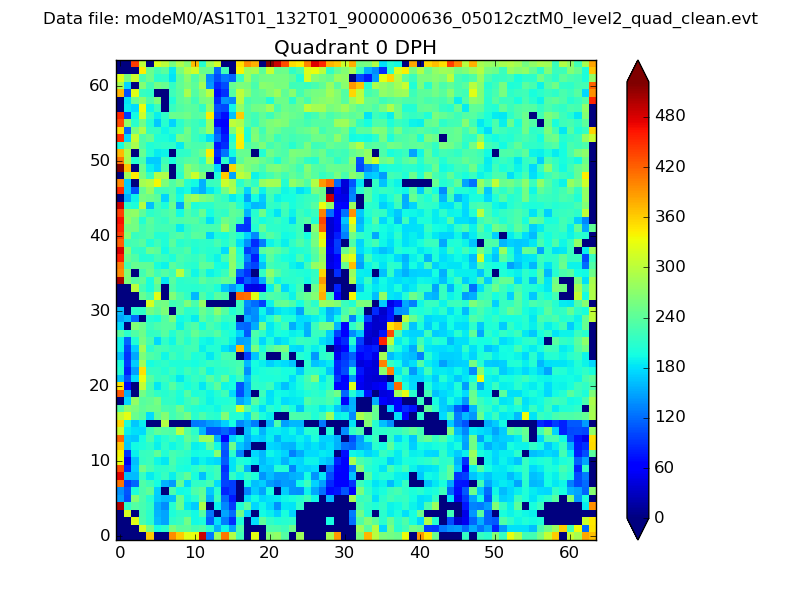 |
 |
Quadrant B |
|---|---|---|---|
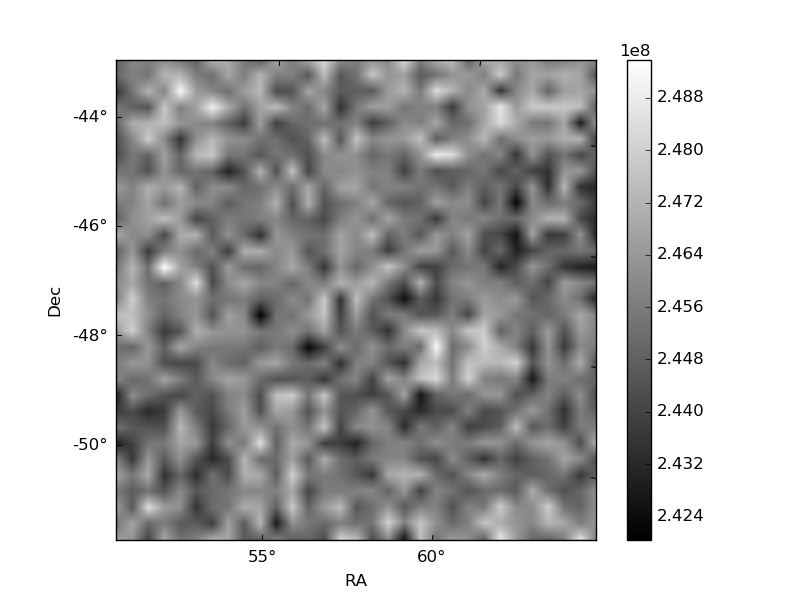
| Quadrant D | 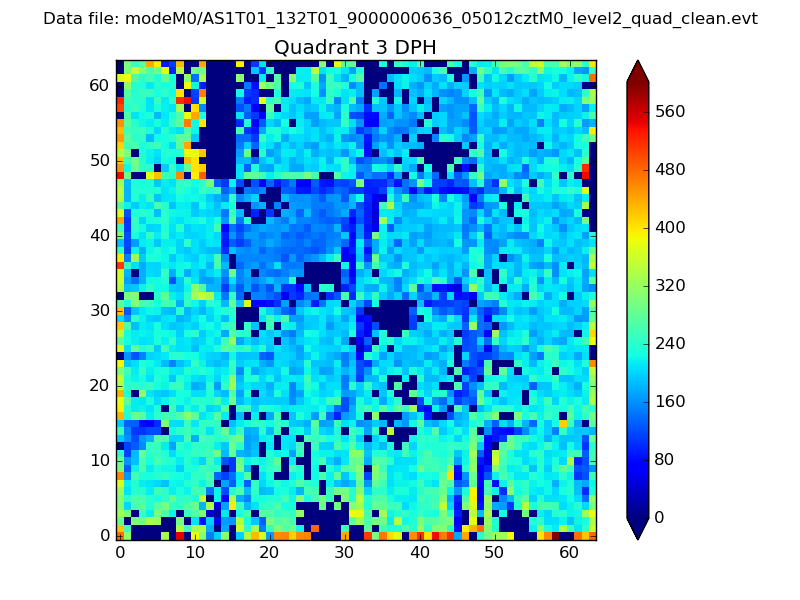 |
 |
Quadrant C |
| Plot type | Count rate plots | Images |
|---|---|---|
| Comparison with Poisson distribution Blue bars denote a histogram of data divided into 1 sec bins. Red curve is a Poisson curve with rate = median count rate of data. |
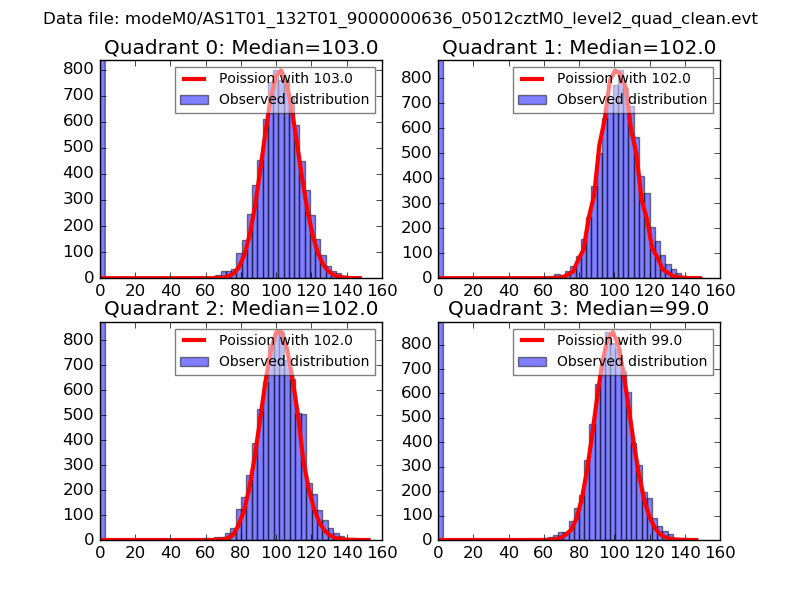 |
 |
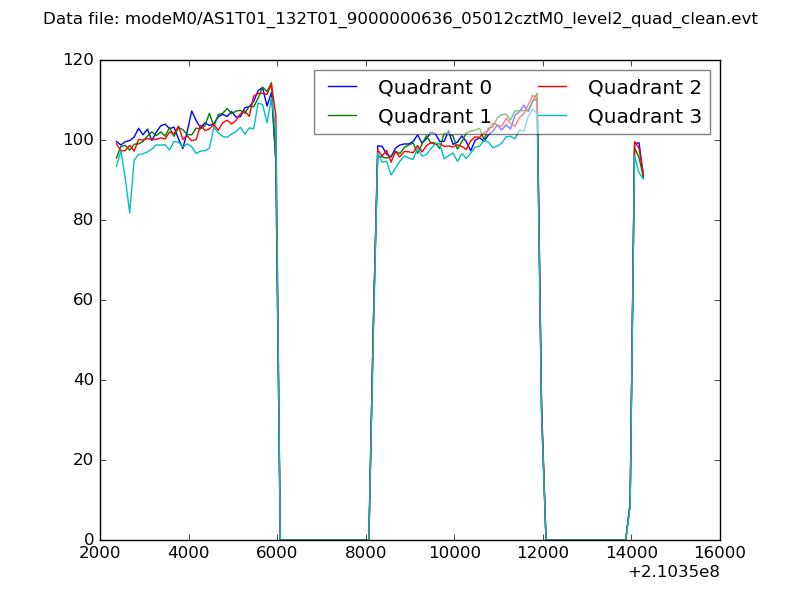
| Quadrant-wise count rates Data is divided into 100 sec bins |
 |
|
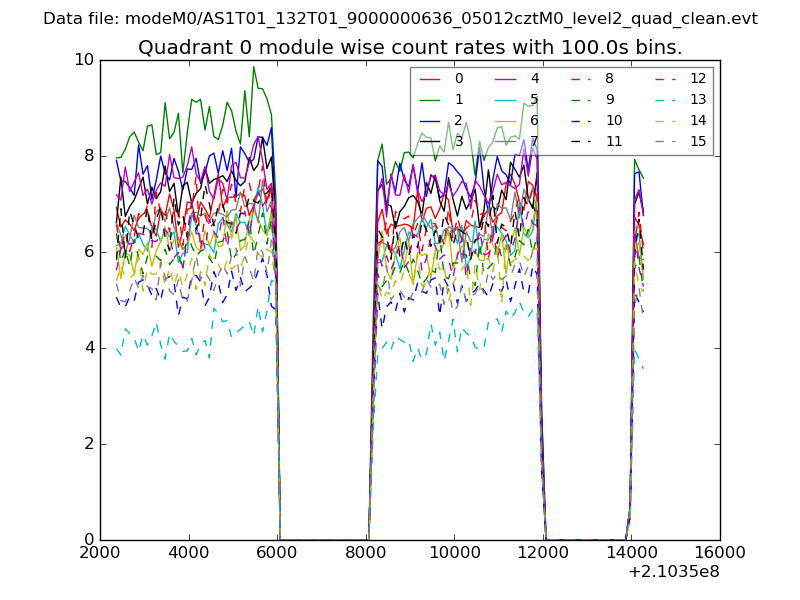
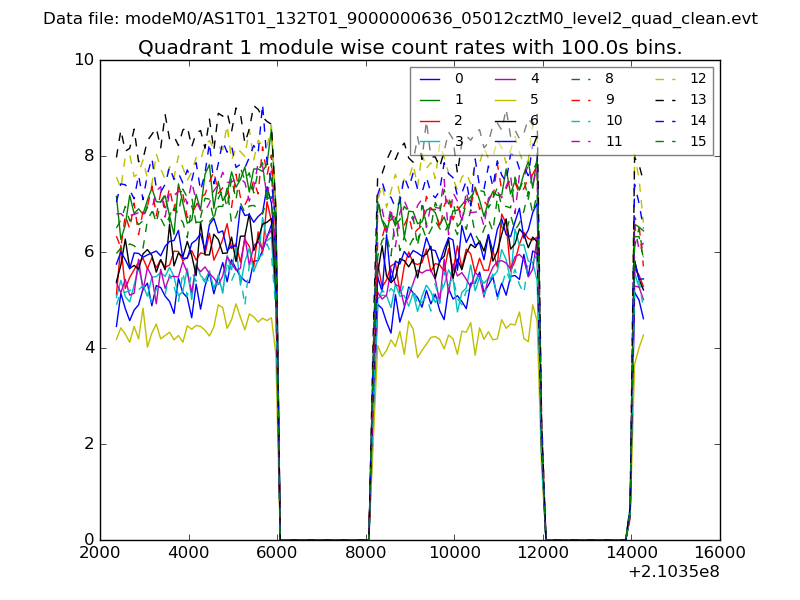
| Module-wise count rates for Quadrant A Data is divided into 100 sec bins |
 |
 |
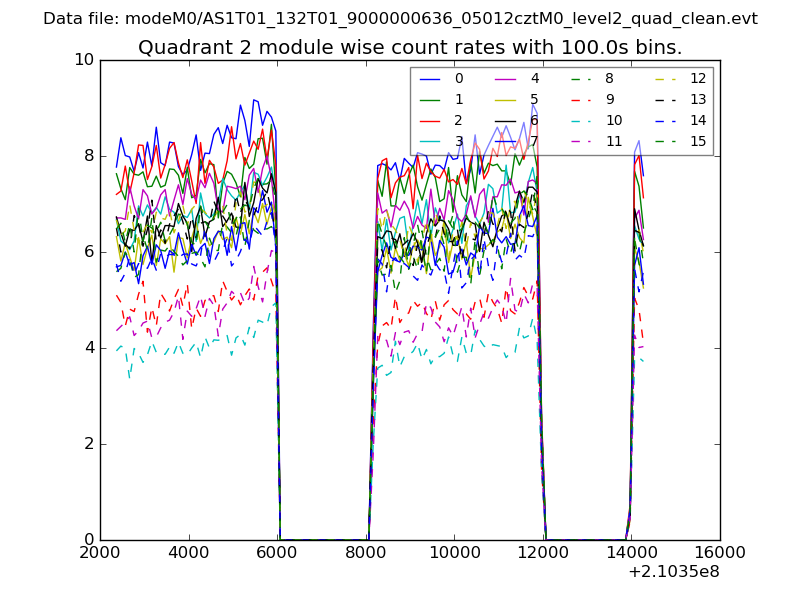
| Module-wise count rates for Quadrant B Data is divided into 100 sec bins |
 |
 |
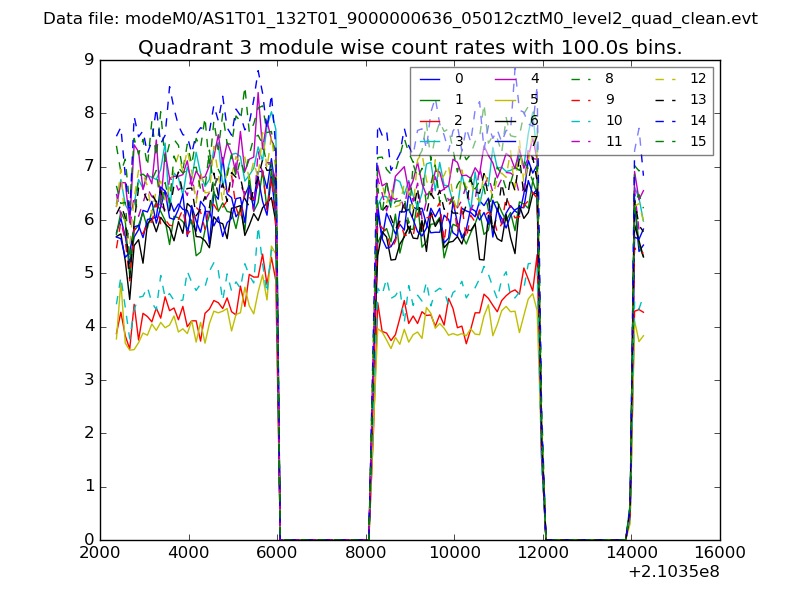
| Module-wise count rates for Quadrant C Data is divided into 100 sec bins |
 |
 |
| Module-wise count rates for Quadrant D Data is divided into 100 sec bins |
 |
 |
| Parameter | Plot |
|---|---|
| CZT HV Monitor | 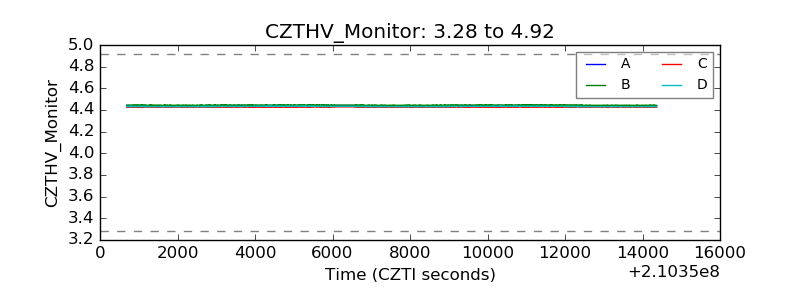 |
| D_VDD | 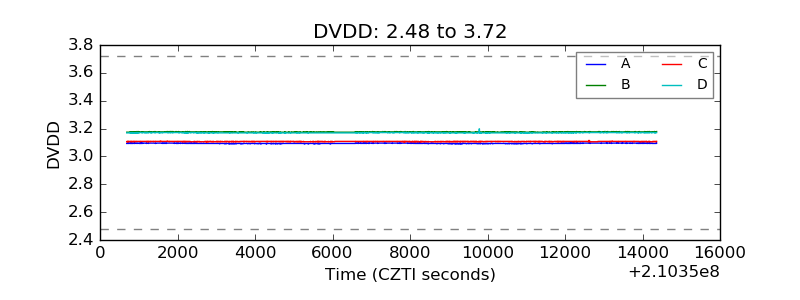 |
| Temperature 1 | 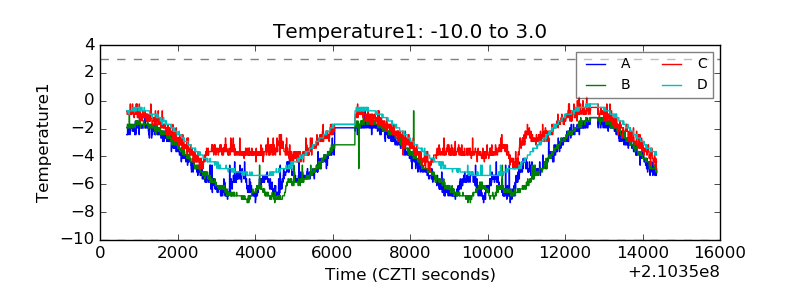 |
| Veto HV Monitor | 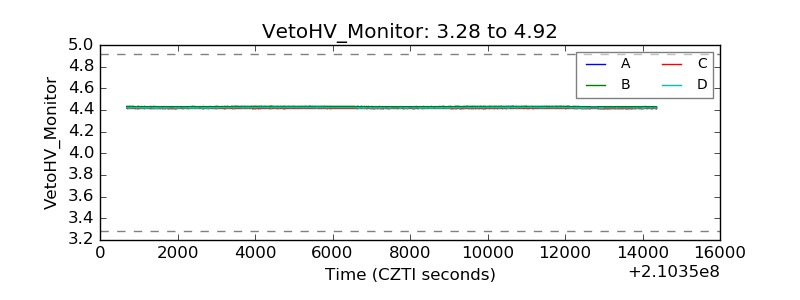 |
| Veto LLD | 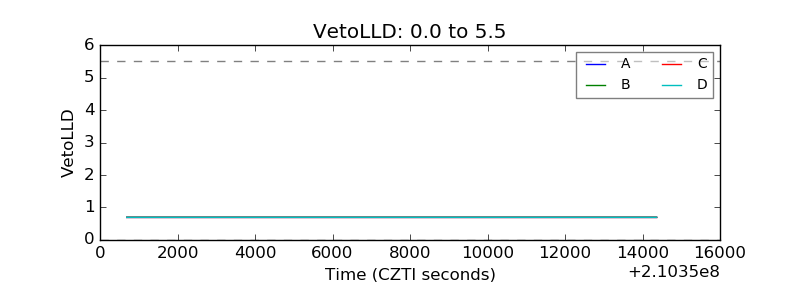 |
| Alpha Counter | 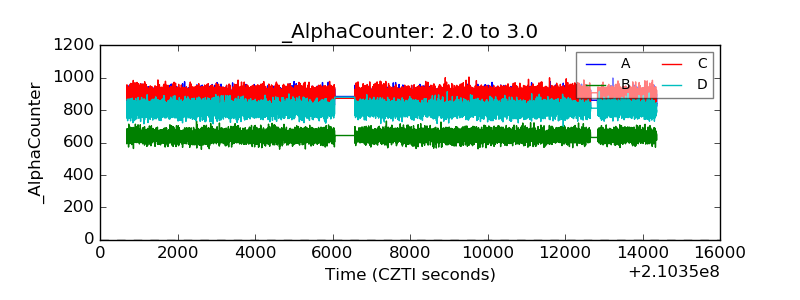 |
| _CPM_Rate | 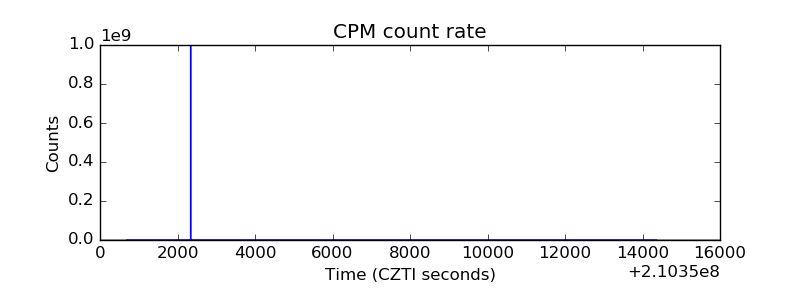 |
| CZT Counter | 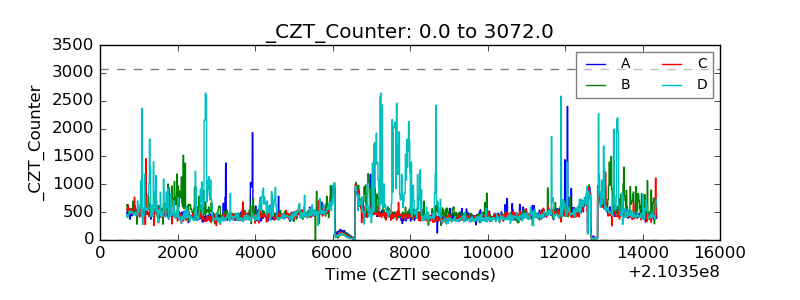 |
| +2.5 Volts monitor |  |
| +5 Volts monitor |  |
| _ROLL_ROT |  |
| _Roll_DEC | 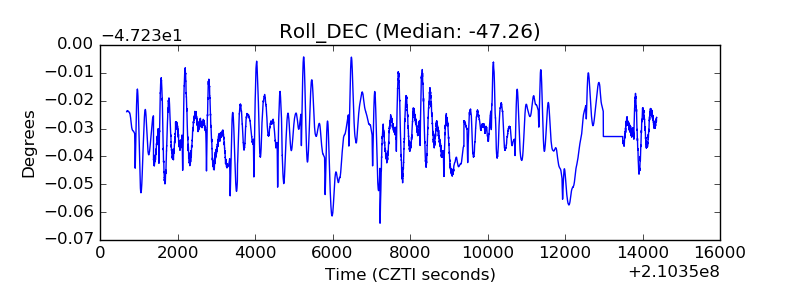 |
| _Roll_RA | 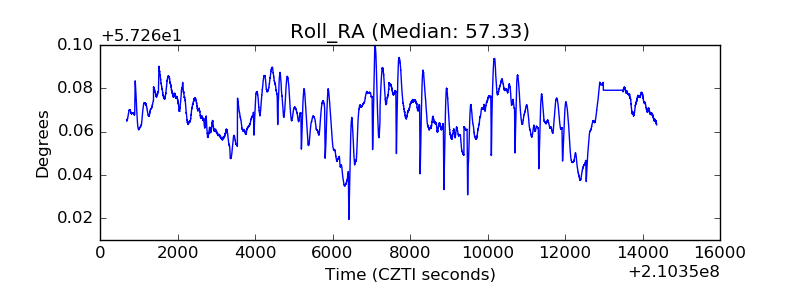 |
| Veto Counter | 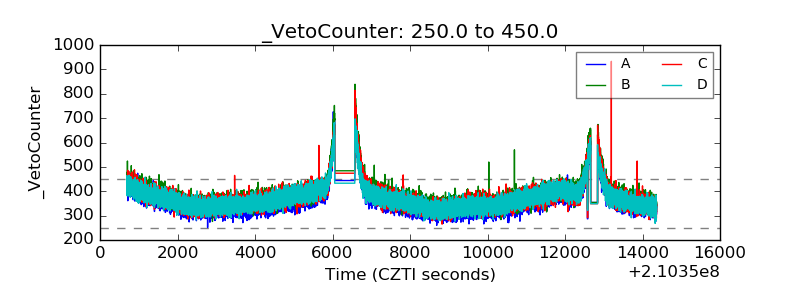 |