| Param | Original file | Final file |
|---|---|---|
| Filename | modeM0/AS1T01_132T01_9000000636_05016cztM0_level2.evt | modeM0/AS1T01_132T01_9000000636_05016cztM0_level2_quad_clean.evt |
| Size (bytes) | 1,008,984,960 | 150,742,080 |
| Size | 962.2 MB | 143.8 MB |
| Events in quadrant A | 6,808,441 | 920,069 |
| Events in quadrant B | 7,203,354 | 924,971 |
| Events in quadrant C | 6,085,290 | 925,353 |
| Events in quadrant D | 9,545,119 | 860,099 |
| Mode SS | |||
|---|---|---|---|
| Quadrant | BADHDUFLAG | Total packets | Discarded packets |
| A | 0 | 276 | 0 |
| B | 0 | 276 | 0 |
| C | 0 | 276 | 0 |
| D | 0 | 276 | 0 |
| Mode M0 | |||
|---|---|---|---|
| Quadrant | BADHDUFLAG | Total packets | Discarded packets |
| A | 0 | 29515 | 3 |
| B | 0 | 30687 | 3 |
| C | 0 | 27840 | 3 |
| D | 0 | 38063 | 3 |
| Mode M9 | |||
|---|---|---|---|
| Quadrant | BADHDUFLAG | Total packets | Discarded packets |
| A | 0 | 12 | 0 |
| B | 0 | 12 | 0 |
| C | 0 | 12 | 0 |
| D | 0 | 12 | 0 |
| Quadrant | Total seconds | Saturated seconds | Saturation percentage |
|---|---|---|---|
| A | 13529 | 137 | 1.012640% |
| B | 13529 | 204 | 1.507872% |
| C | 13529 | 59 | 0.436100% |
| D | 13529 | 863 | 6.378890% |
Noise dominated data is calculated using 1-second bins in cleaned event files. If a bin has >2000 counts, and if more than 50% of those come from <1% of pixels, then it is considered to be noise-dominated and hence unusable.
| Quadrant | # 1 sec bins | Bins with >0 counts | Bins with >2000 counts | High rate bins dominated by noise | Noise dominated (total time) | Noise dominated (detector-on time) | Marked lightcurve |
|---|---|---|---|---|---|---|---|
| A | 14659 | 13532 | 47 | 47 | 0.32% | 0.35% | 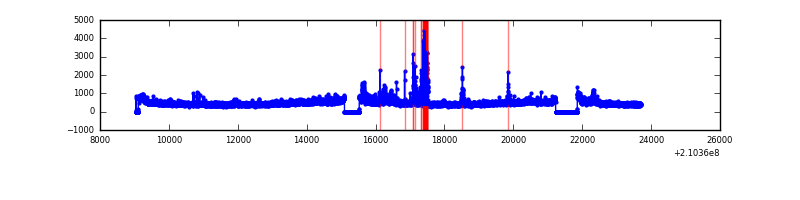 |
| B | 14659 | 13532 | 17 | 17 | 0.12% | 0.13% | 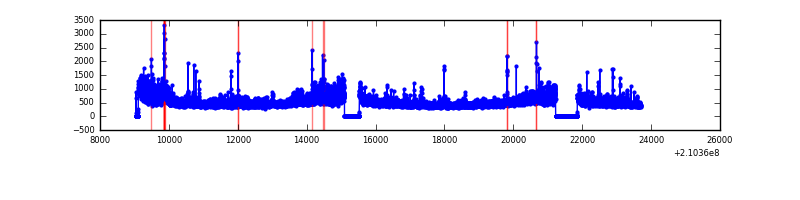 |
| C | 14659 | 13532 | 0 | 0 | 0.00% | 0.00% | 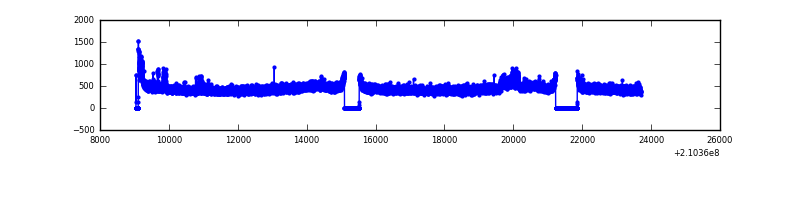 |
| D | 14659 | 13532 | 610 | 610 | 4.16% | 4.51% |  |
Top three noisy pixels from each quadrant. If the there are fewer than three noisy pixels in the level2.evt file, extra rows are filled as -1
| Pixel properties | Quadrant properties | ||||||
|---|---|---|---|---|---|---|---|
| Quadrant | DetID | PixID | Counts | Sigma | Mean | Median | Sigma |
| A | 13 | 251 | 816062 | 2592.62 | 1533 | 1498 | 314.2 |
| A | 15 | 234 | 31328 | 94.94 | 1533 | 1498 | 314.2 |
| A | 0 | 50 | 25214 | 75.48 | 1533 | 1498 | 314.2 |
| B | 15 | 204 | 822769 | 2772.8 | 1553 | 1513 | 296.2 |
| B | 0 | 219 | 121283 | 404.38 | 1553 | 1513 | 296.2 |
| B | 4 | 80 | 73432 | 242.82 | 1553 | 1513 | 296.2 |
| C | 1 | 16 | 216028 | 617.62 | 1503 | 1511 | 347.3 |
| C | 13 | 61 | 12079 | 30.43 | 1503 | 1511 | 347.3 |
| C | 14 | 67 | 4651 | 9.04 | 1503 | 1511 | 347.3 |
| D | 2 | 136 | 1199209 | 3363.66 | 1452 | 1405 | 356.1 |
| D | 2 | 33 | 1179600 | 3308.59 | 1452 | 1405 | 356.1 |
| D | 13 | 53 | 844582 | 2367.8 | 1452 | 1405 | 356.1 |
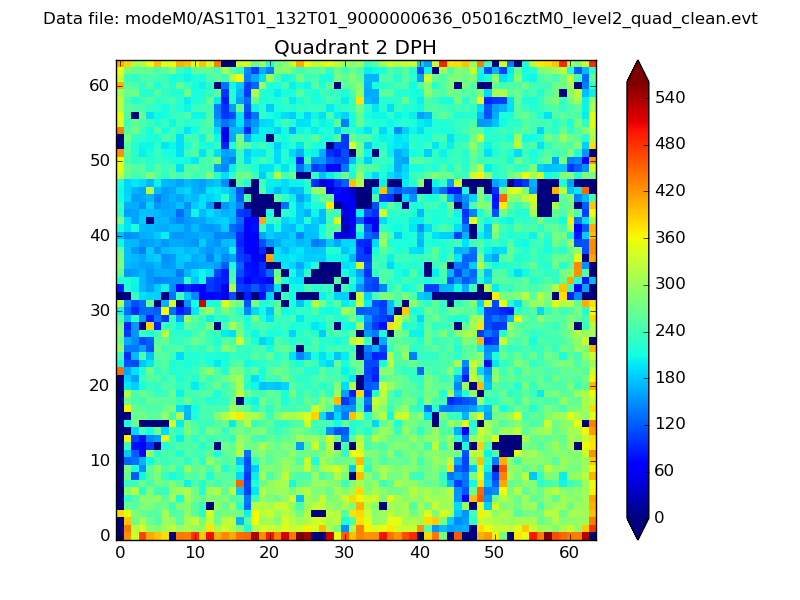
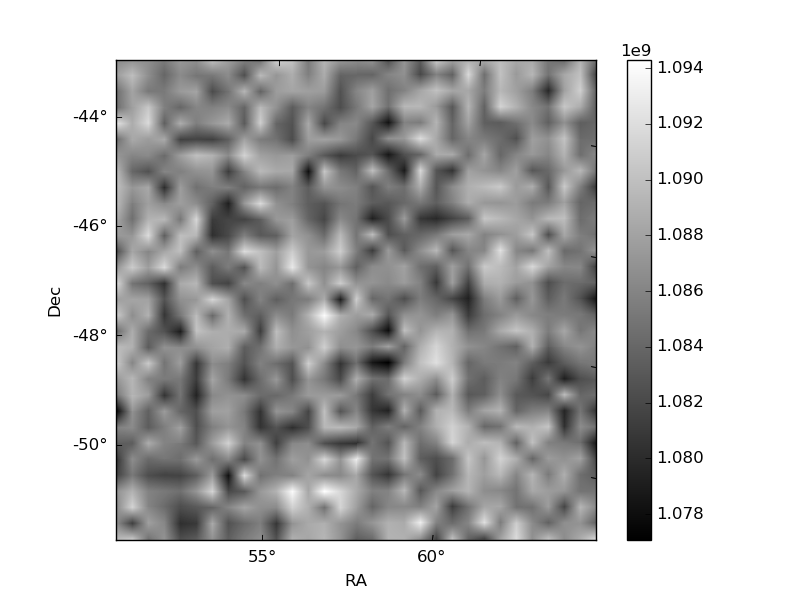
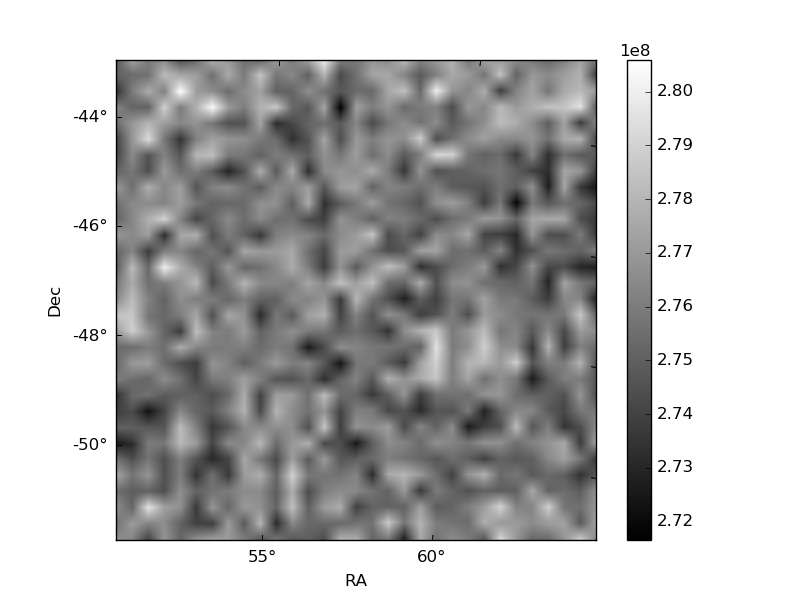
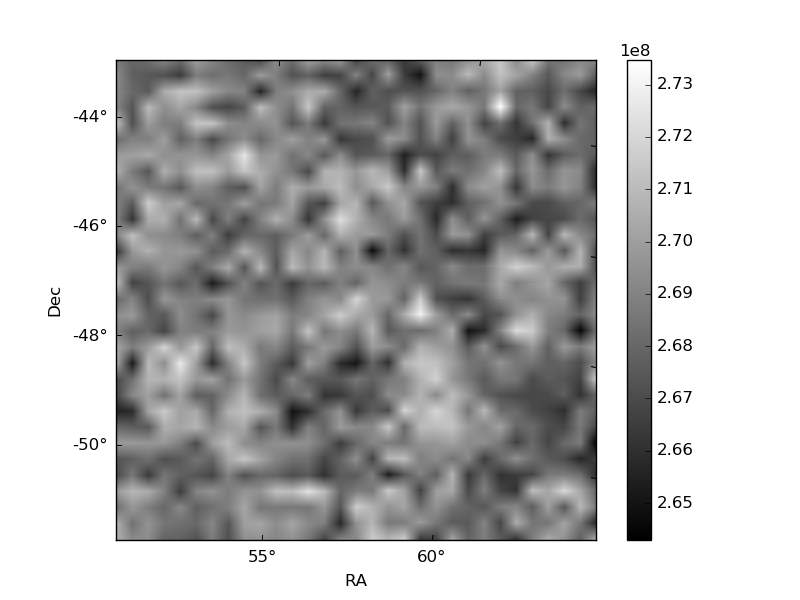
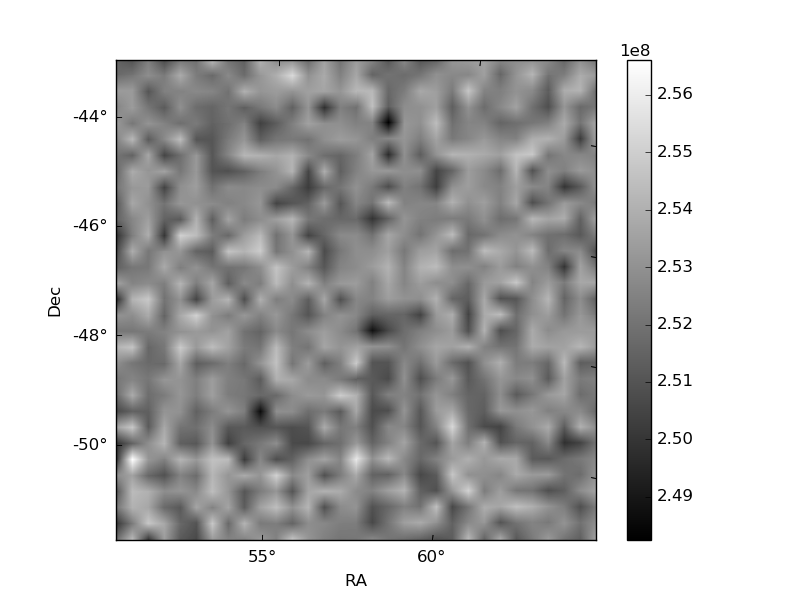
Histogram calculated using DETX and DETY for each event in the final _common_clean file
| Quadrant A | 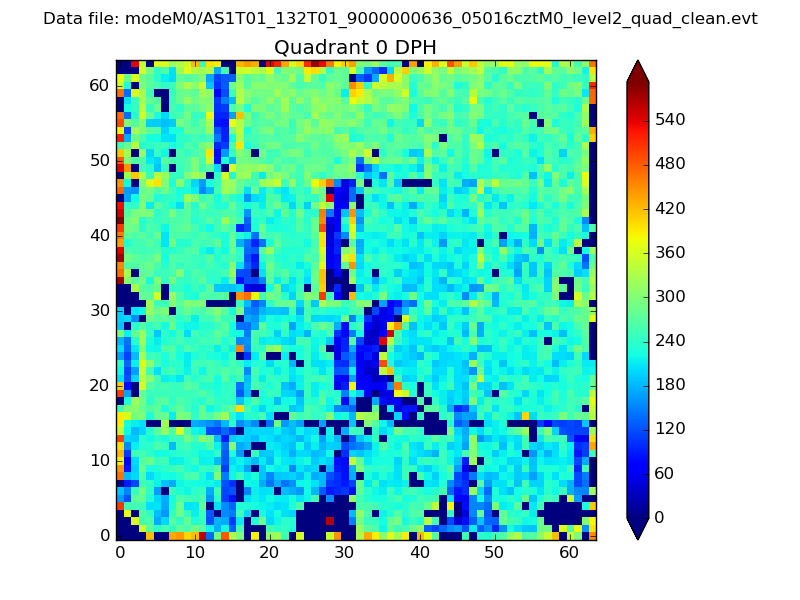 |
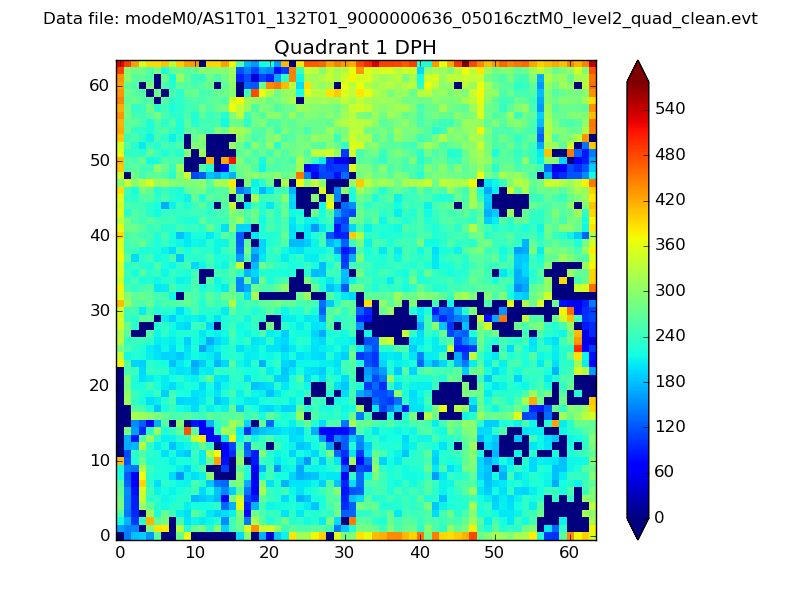 |
Quadrant B |
|---|---|---|---|
| Quadrant D | 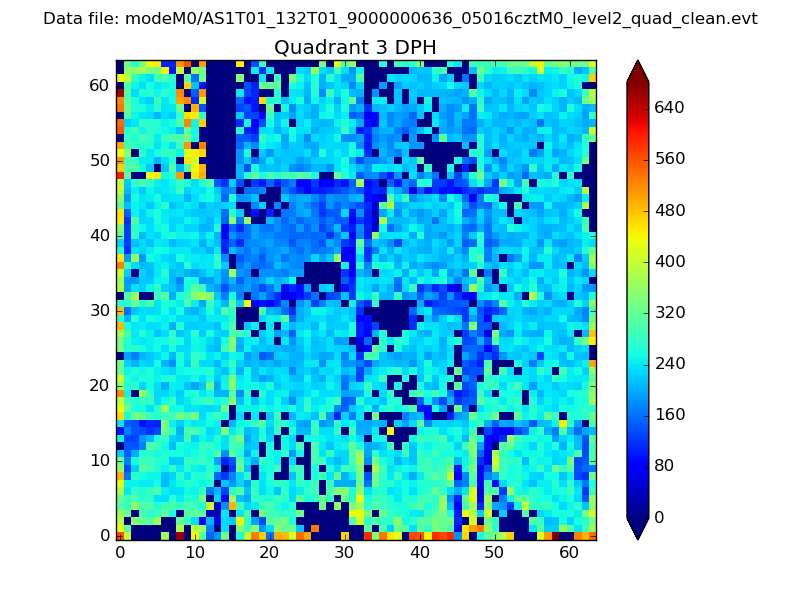 |
 |
Quadrant C |
| Plot type | Count rate plots | Images |
|---|---|---|
| Comparison with Poisson distribution Blue bars denote a histogram of data divided into 1 sec bins. Red curve is a Poisson curve with rate = median count rate of data. |
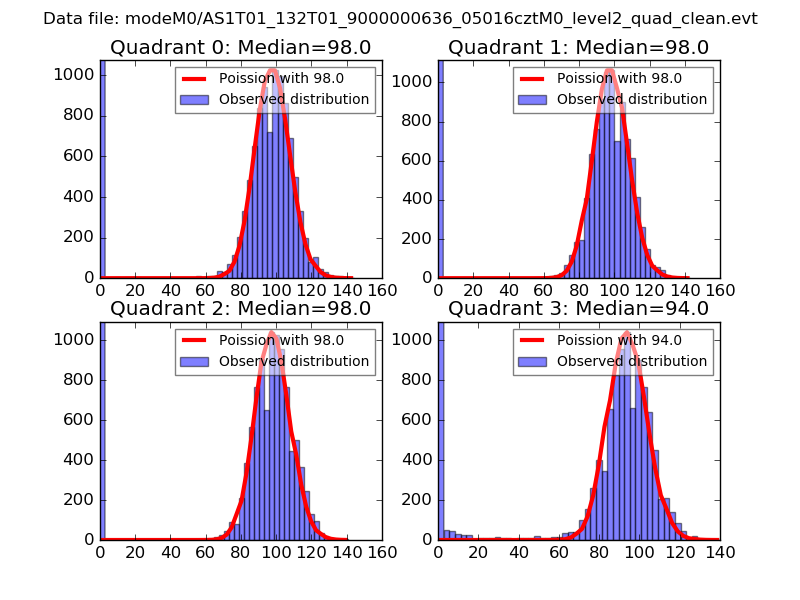 |
 |
| Quadrant-wise count rates Data is divided into 100 sec bins |
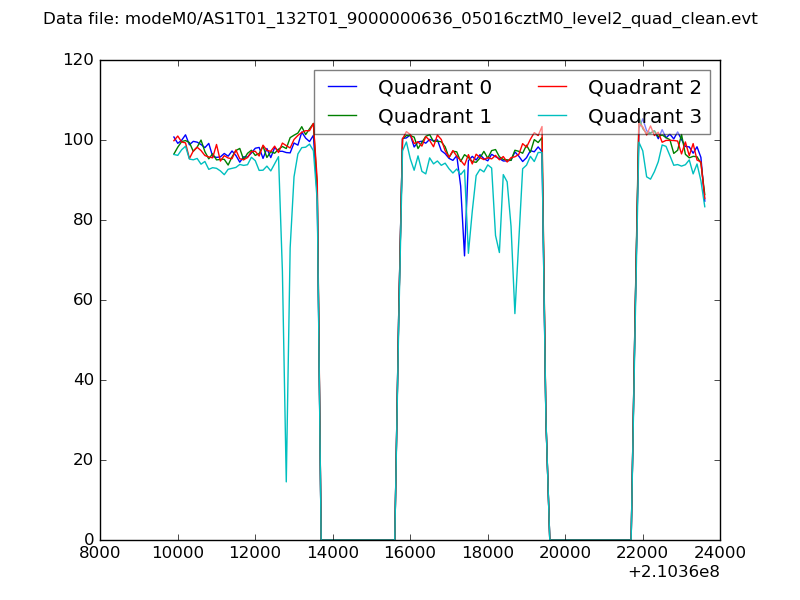 |
|
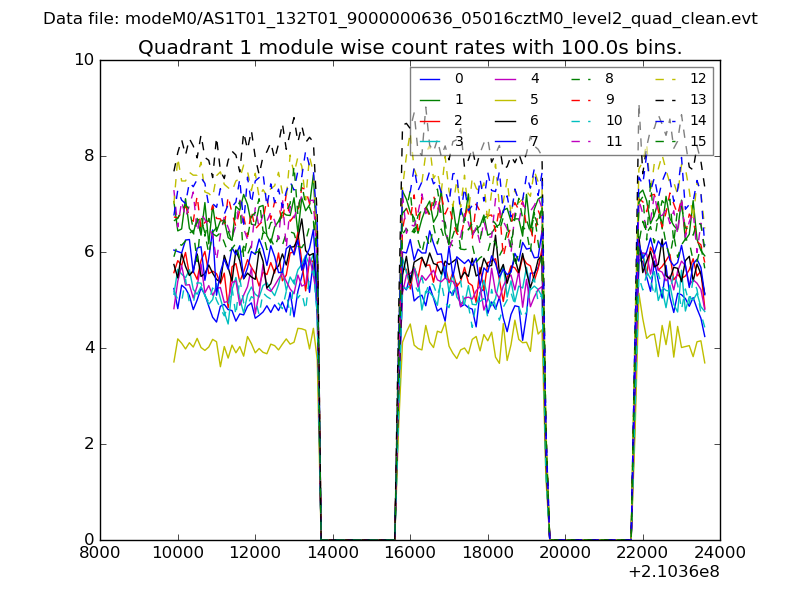
| Module-wise count rates for Quadrant A Data is divided into 100 sec bins |
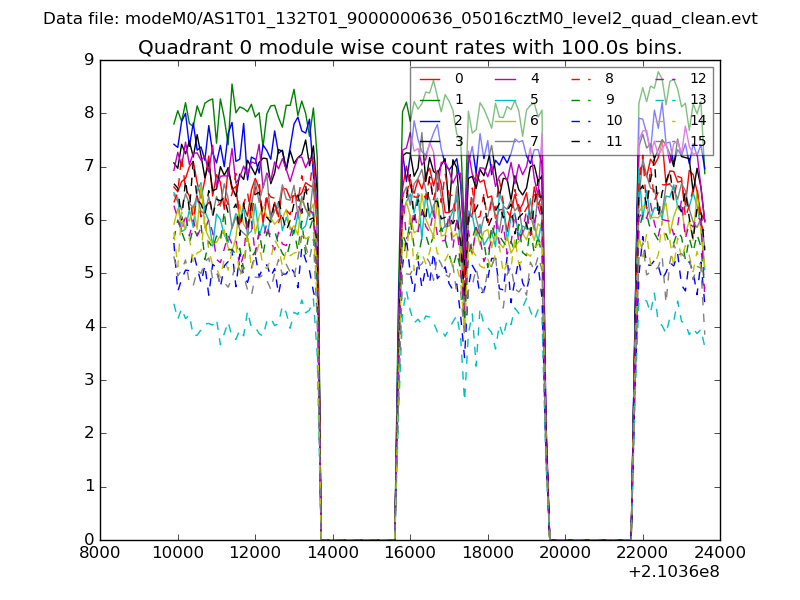 |
 |
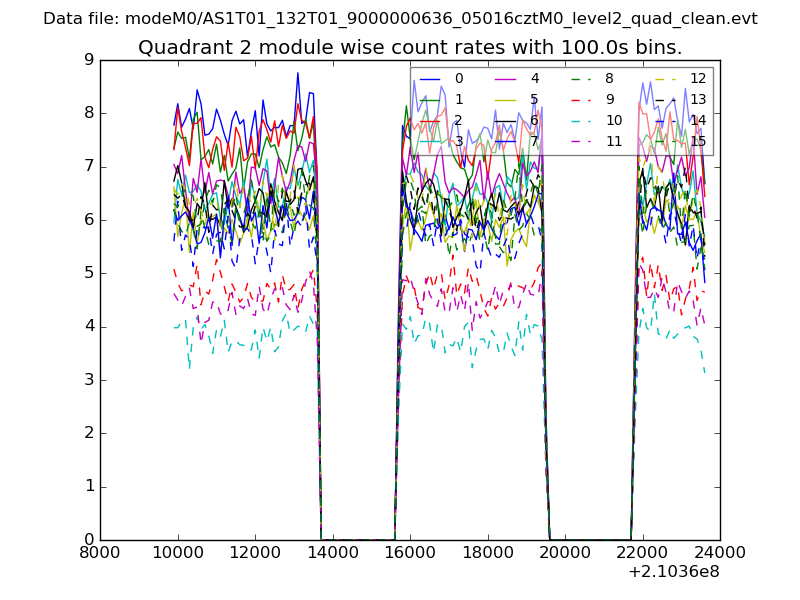
| Module-wise count rates for Quadrant B Data is divided into 100 sec bins |
 |
 |
| Module-wise count rates for Quadrant C Data is divided into 100 sec bins |
 |
 |
| Module-wise count rates for Quadrant D Data is divided into 100 sec bins |
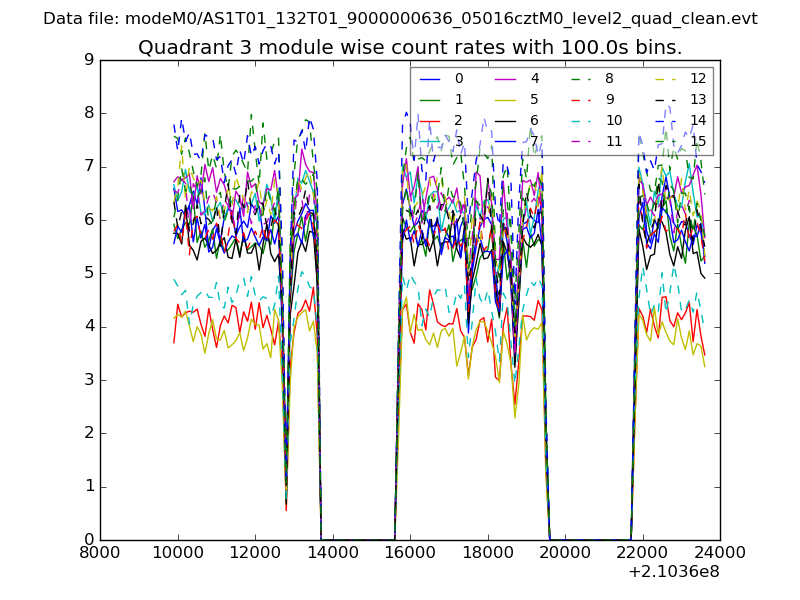 |
 |
| Parameter | Plot |
|---|---|
| CZT HV Monitor | 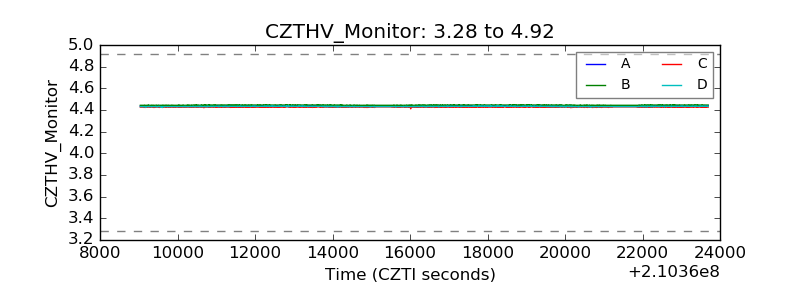 |
| D_VDD |  |
| Temperature 1 | 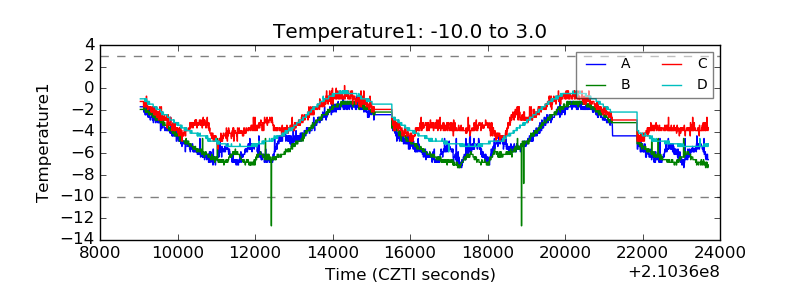 |
| Veto HV Monitor |  |
| Veto LLD | 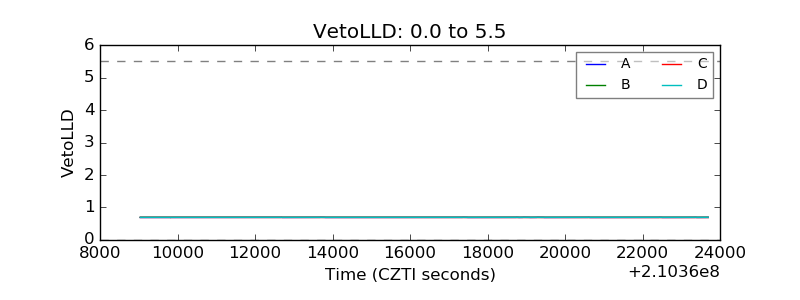 |
| Alpha Counter | 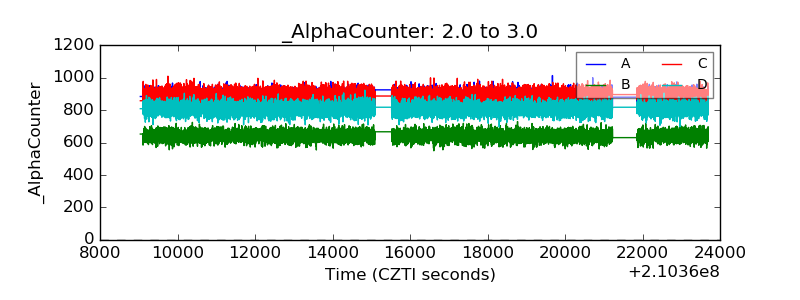 |
| _CPM_Rate | 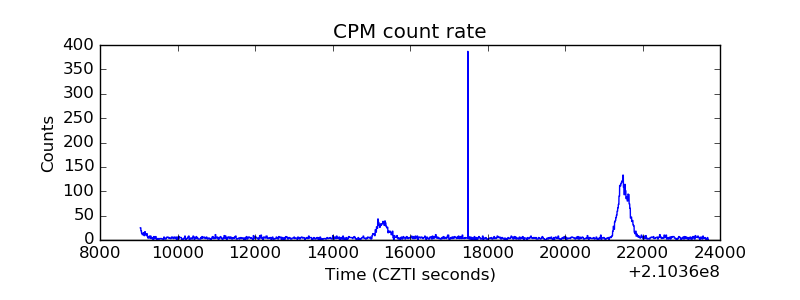 |
| CZT Counter | 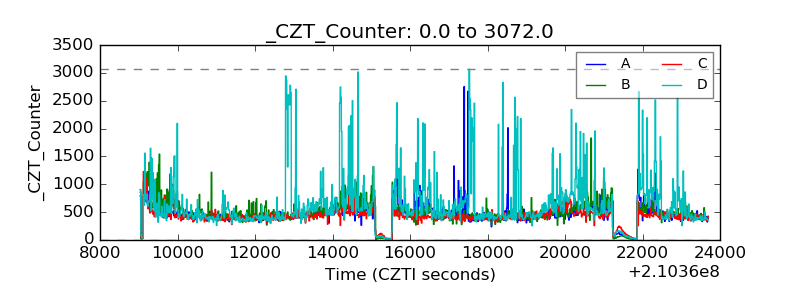 |
| +2.5 Volts monitor |  |
| +5 Volts monitor |  |
| _ROLL_ROT | 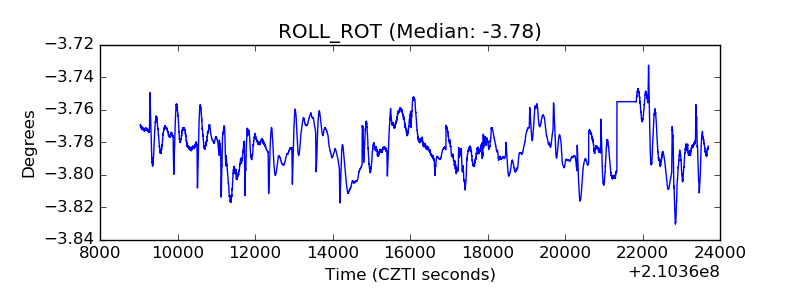 |
| _Roll_DEC | 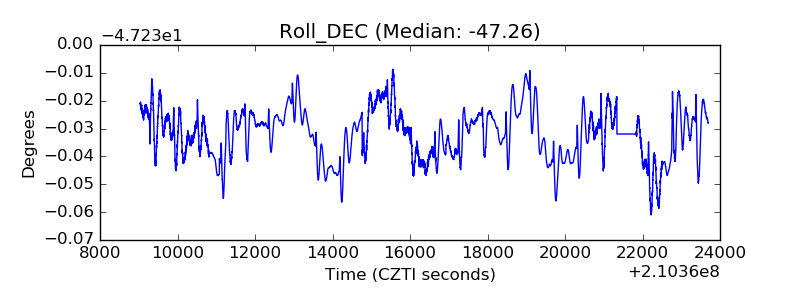 |
| _Roll_RA |  |
| Veto Counter | 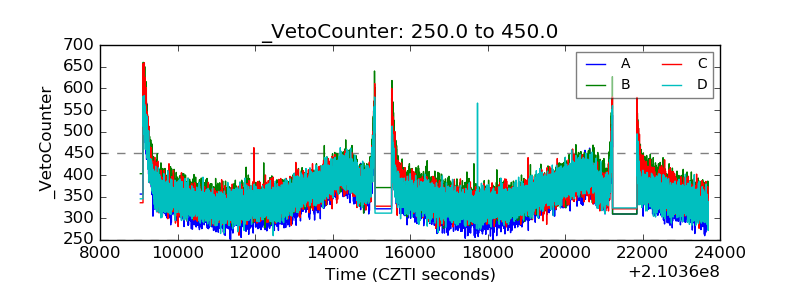 |