| Param | Original file | Final file |
|---|---|---|
| Filename | modeM0/AS1G05_250T02_9000000638_05016cztM0_level2.evt | modeM0/AS1G05_250T02_9000000638_05016cztM0_level2_quad_clean.evt |
| Size (bytes) | 316,209,600 | 38,854,080 |
| Size | 301.6 MB | 37.1 MB |
| Events in quadrant A | 2,070,156 | 222,249 |
| Events in quadrant B | 2,011,357 | 224,924 |
| Events in quadrant C | 1,929,658 | 226,357 |
| Events in quadrant D | 3,284,077 | 211,762 |
| Mode M9 | |||
|---|---|---|---|
| Quadrant | BADHDUFLAG | Total packets | Discarded packets |
| A | 0 | 8 | 0 |
| B | 0 | 8 | 0 |
| C | 0 | 8 | 0 |
| D | 0 | 8 | 0 |
| Mode SS | |||
|---|---|---|---|
| Quadrant | BADHDUFLAG | Total packets | Discarded packets |
| A | 0 | 84 | 0 |
| B | 0 | 84 | 0 |
| C | 0 | 84 | 0 |
| D | 0 | 84 | 0 |
| Mode M0 | |||
|---|---|---|---|
| Quadrant | BADHDUFLAG | Total packets | Discarded packets |
| A | 0 | 8707 | 2 |
| B | 0 | 8646 | 1 |
| C | 0 | 8639 | 1 |
| D | 0 | 12598 | 1 |
| Quadrant | Total seconds | Saturated seconds | Saturation percentage |
|---|---|---|---|
| A | 4125 | 23 | 0.557576% |
| B | 4125 | 27 | 0.654545% |
| C | 4125 | 28 | 0.678788% |
| D | 4125 | 243 | 5.890909% |
Noise dominated data is calculated using 1-second bins in cleaned event files. If a bin has >2000 counts, and if more than 50% of those come from <1% of pixels, then it is considered to be noise-dominated and hence unusable.
| Quadrant | # 1 sec bins | Bins with >0 counts | Bins with >2000 counts | High rate bins dominated by noise | Noise dominated (total time) | Noise dominated (detector-on time) | Marked lightcurve |
|---|---|---|---|---|---|---|---|
| A | 4880 | 4126 | 0 | 0 | 0.00% | 0.00% | 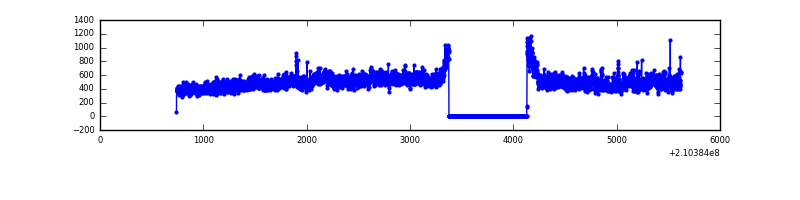 |
| B | 4880 | 4126 | 0 | 0 | 0.00% | 0.00% | 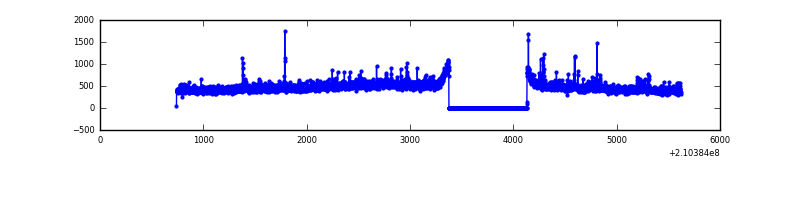 |
| C | 4880 | 4126 | 7 | 7 | 0.14% | 0.17% |  |
| D | 4880 | 4126 | 134 | 134 | 2.75% | 3.25% |  |
Top three noisy pixels from each quadrant. If the there are fewer than three noisy pixels in the level2.evt file, extra rows are filled as -1
| Pixel properties | Quadrant properties | ||||||
|---|---|---|---|---|---|---|---|
| Quadrant | DetID | PixID | Counts | Sigma | Mean | Median | Sigma |
| A | 13 | 251 | 198787 | 1964.95 | 485 | 474 | 100.9 |
| A | 12 | 194 | 4928 | 44.13 | 485 | 474 | 100.9 |
| A | 0 | 226 | 4810 | 42.96 | 485 | 474 | 100.9 |
| B | 15 | 204 | 43053 | 440.25 | 491 | 478 | 96.7 |
| B | 4 | 80 | 25518 | 258.93 | 491 | 478 | 96.7 |
| B | 15 | 54 | 19808 | 199.88 | 491 | 478 | 96.7 |
| C | 12 | 4 | 70454 | 629.04 | 473 | 476 | 111.2 |
| C | 1 | 16 | 7519 | 63.31 | 473 | 476 | 111.2 |
| C | 13 | 61 | 3893 | 30.72 | 473 | 476 | 111.2 |
| D | 12 | 227 | 594107 | 5195.04 | 462 | 447 | 114.3 |
| D | 2 | 136 | 242901 | 2121.68 | 462 | 447 | 114.3 |
| D | 2 | 33 | 195295 | 1705.09 | 462 | 447 | 114.3 |
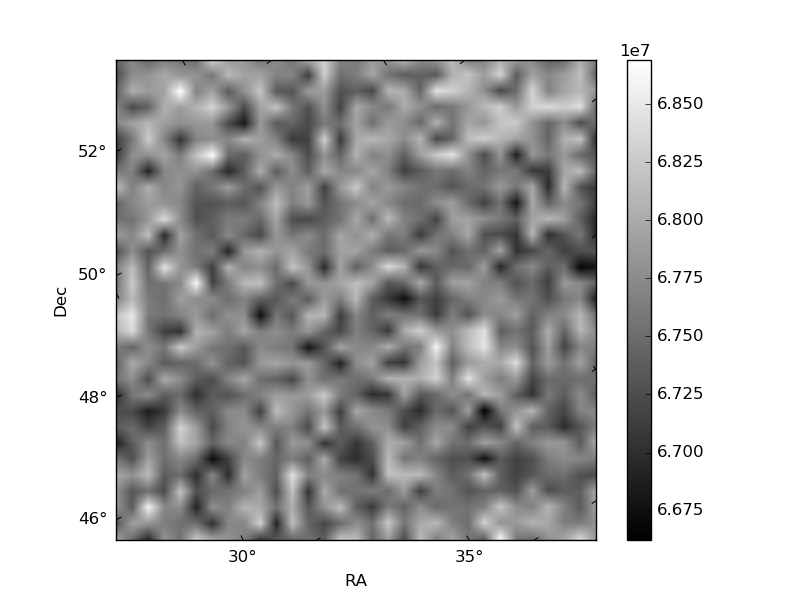
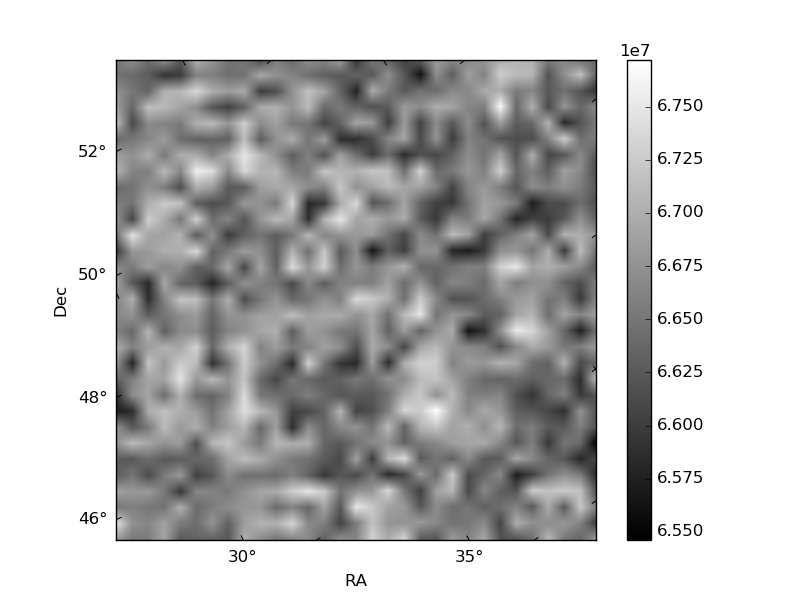
Histogram calculated using DETX and DETY for each event in the final _common_clean file
| Quadrant A | 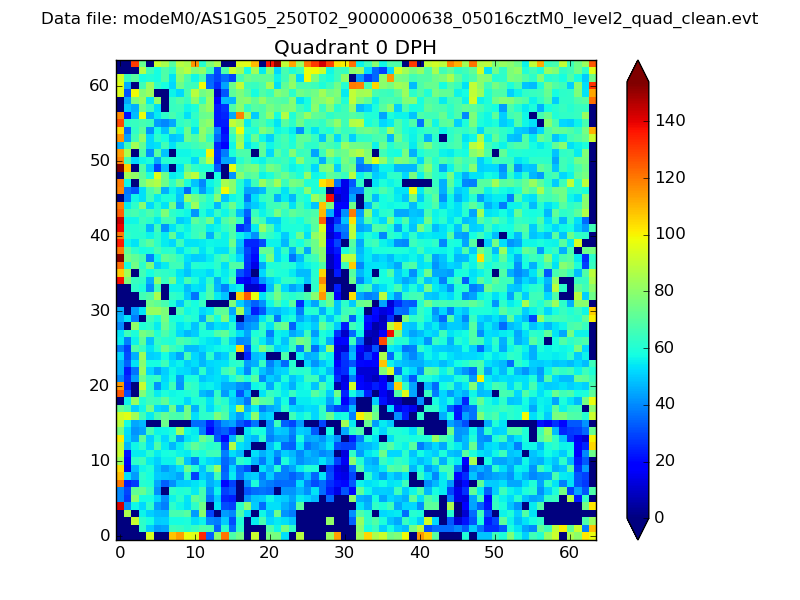 |
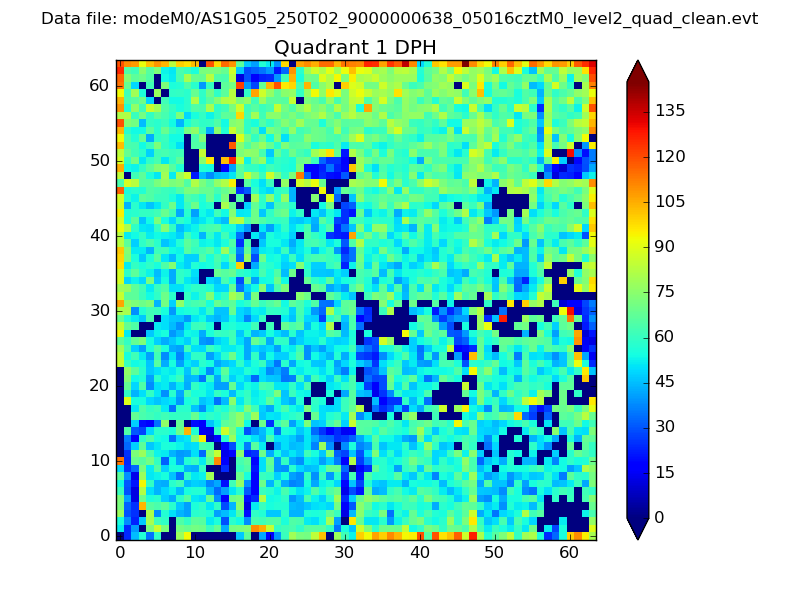 |
Quadrant B |
|---|---|---|---|
| Quadrant D | 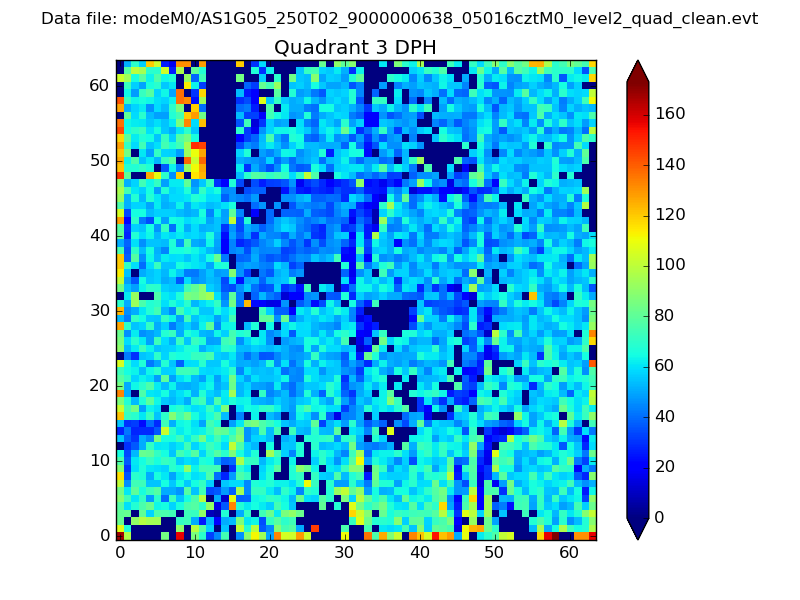 |
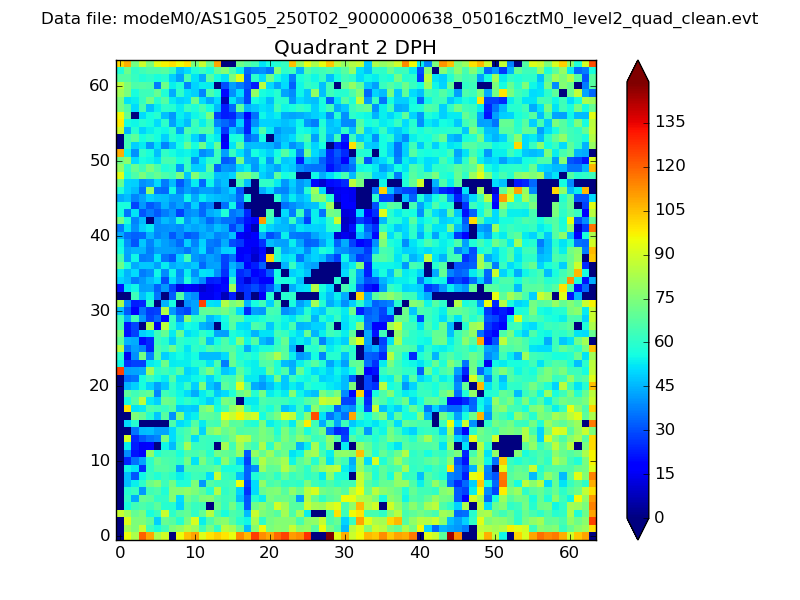 |
Quadrant C |
| Plot type | Count rate plots | Images |
|---|---|---|
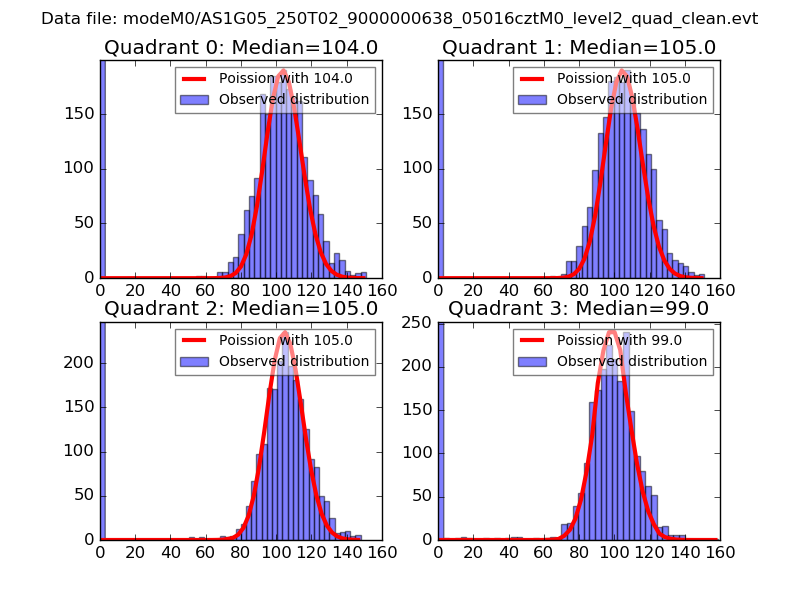
| Comparison with Poisson distribution Blue bars denote a histogram of data divided into 1 sec bins. Red curve is a Poisson curve with rate = median count rate of data. |
 |
 |
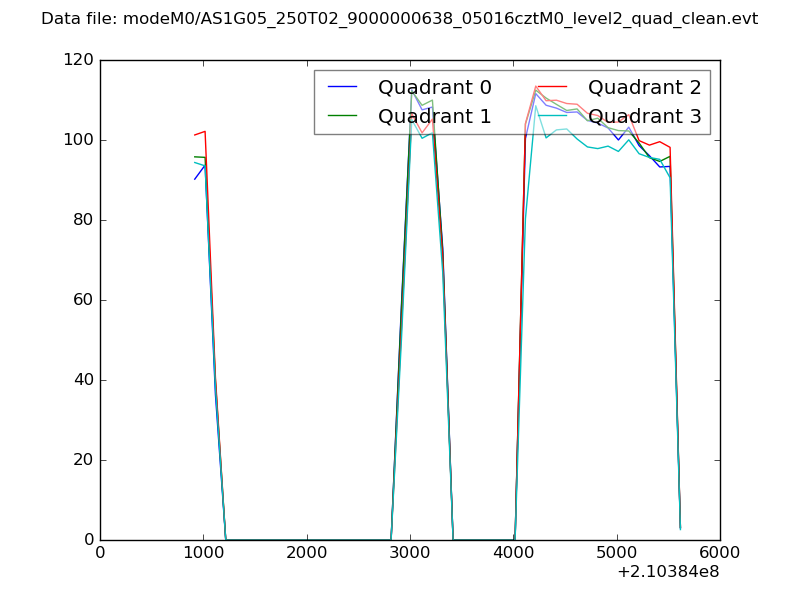
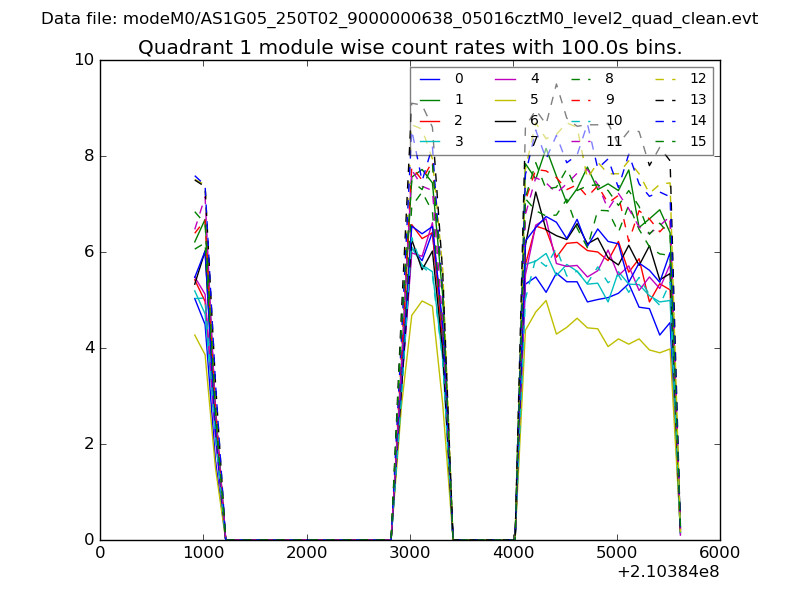
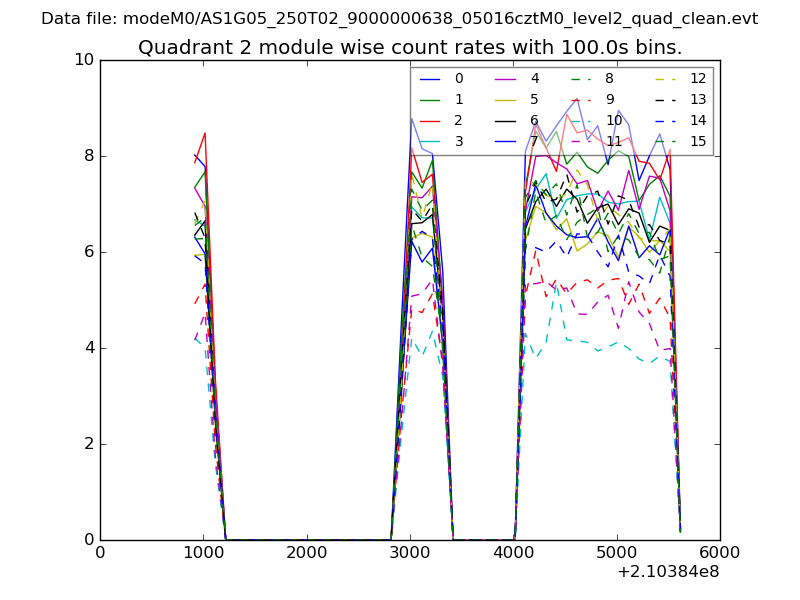
| Quadrant-wise count rates Data is divided into 100 sec bins |
 |
|
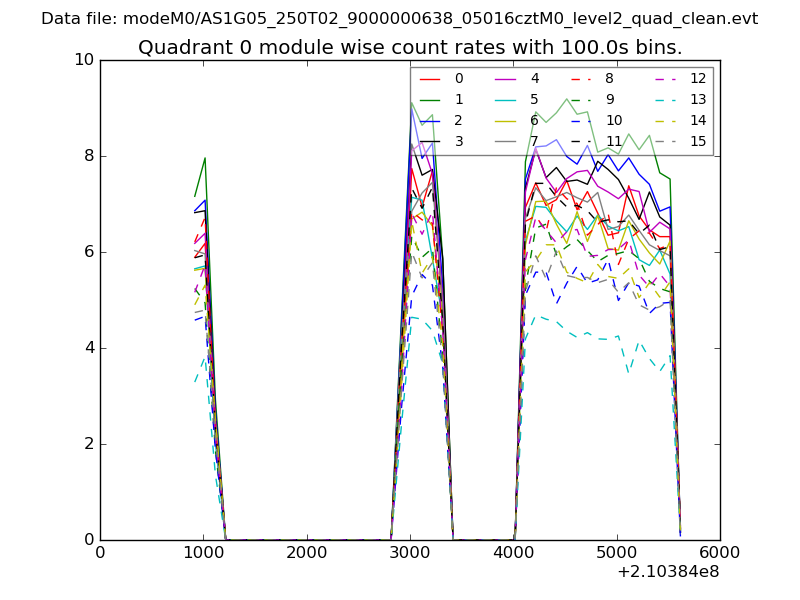
| Module-wise count rates for Quadrant A Data is divided into 100 sec bins |
 |
 |
| Module-wise count rates for Quadrant B Data is divided into 100 sec bins |
 |
 |
| Module-wise count rates for Quadrant C Data is divided into 100 sec bins |
 |
 |
| Module-wise count rates for Quadrant D Data is divided into 100 sec bins |
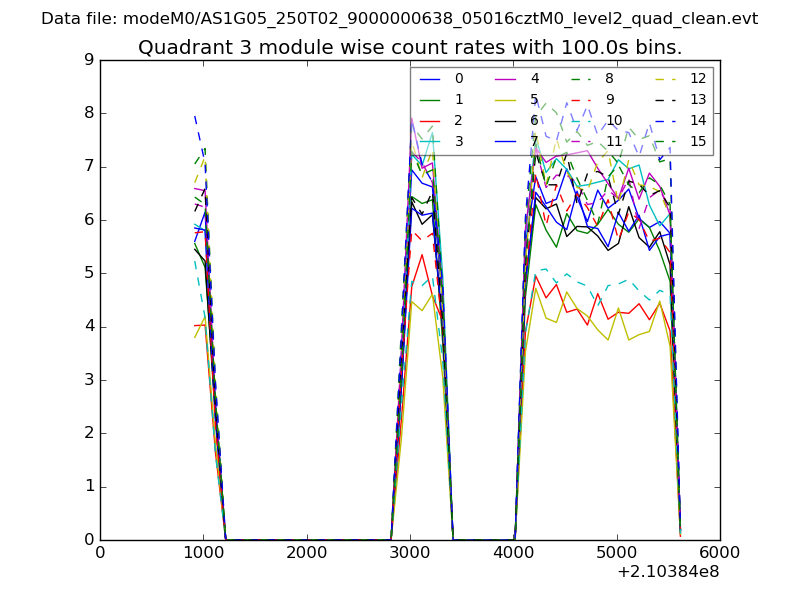 |
 |
| Parameter | Plot |
|---|---|
| CZT HV Monitor | 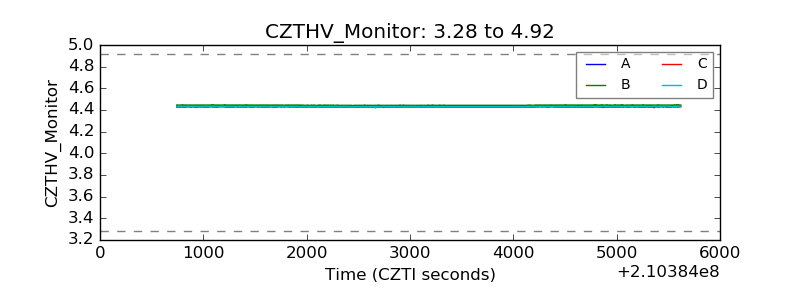 |
| D_VDD | 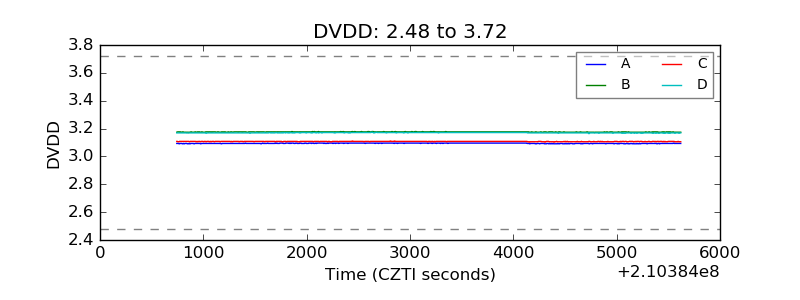 |
| Temperature 1 | 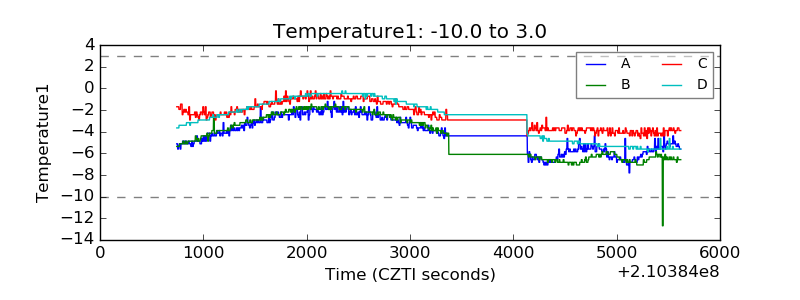 |
| Veto HV Monitor | 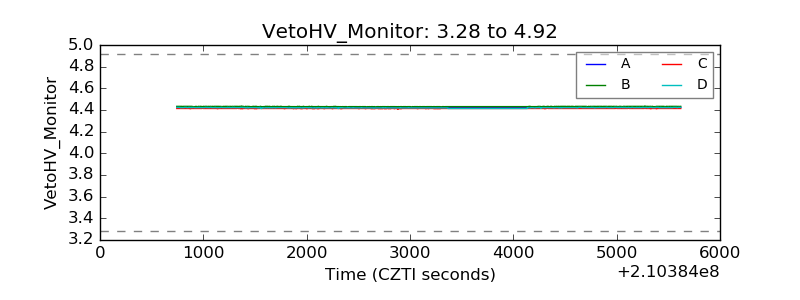 |
| Veto LLD | 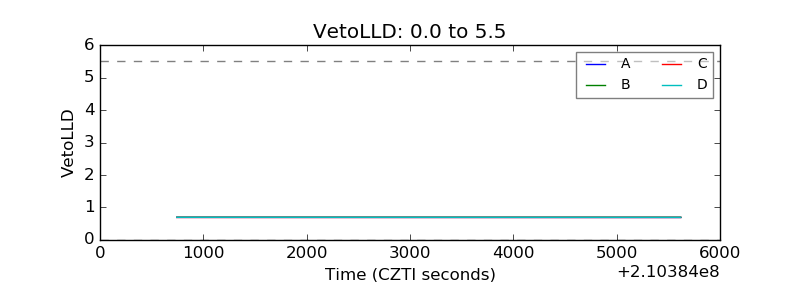 |
| Alpha Counter | 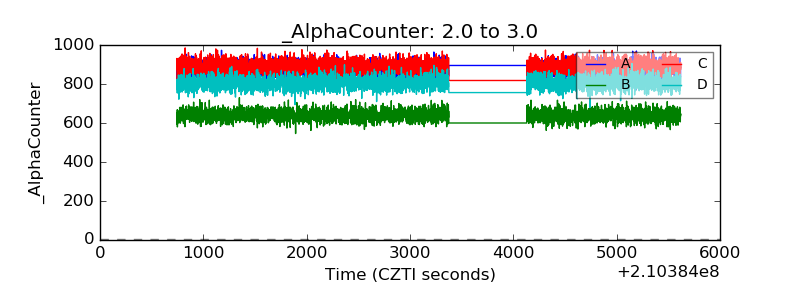 |
| _CPM_Rate | 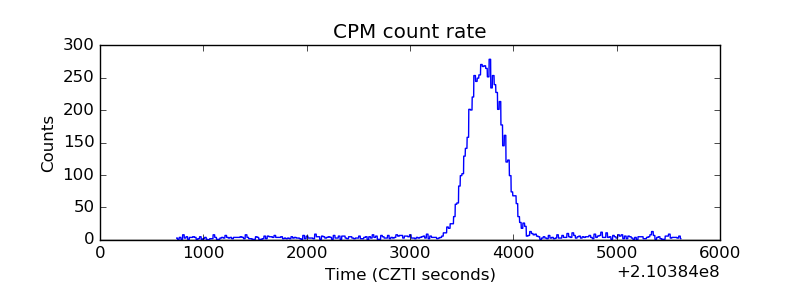 |
| CZT Counter | 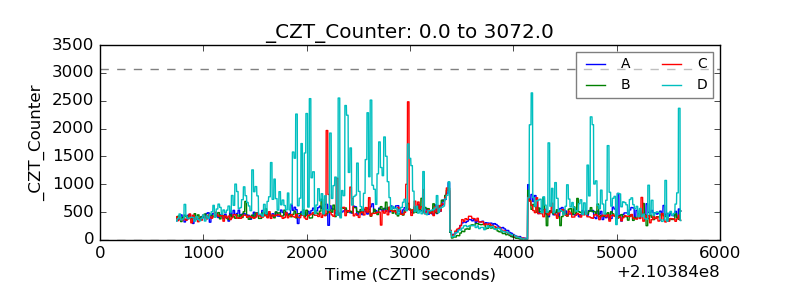 |
| +2.5 Volts monitor | 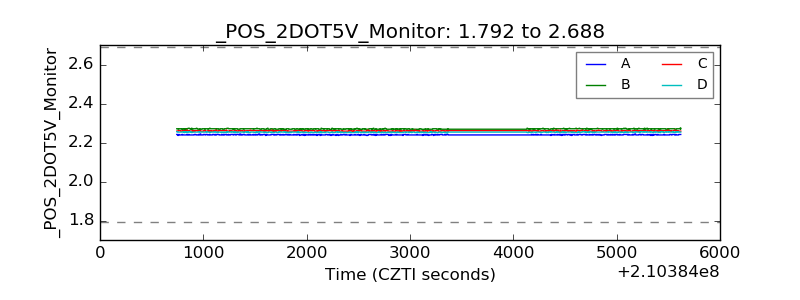 |
| +5 Volts monitor | 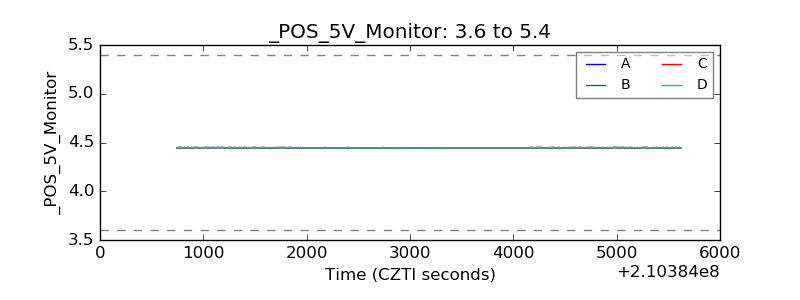 |
| _ROLL_ROT | 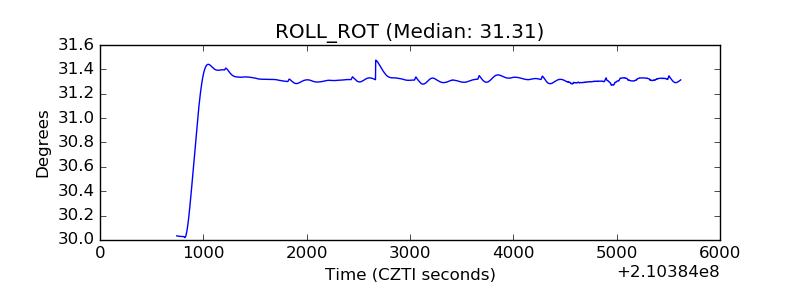 |
| _Roll_DEC | 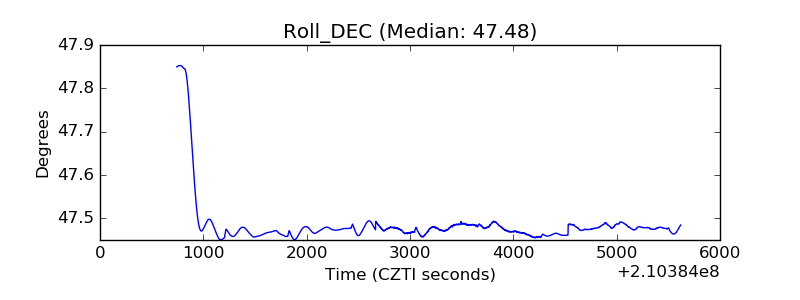 |
| _Roll_RA | 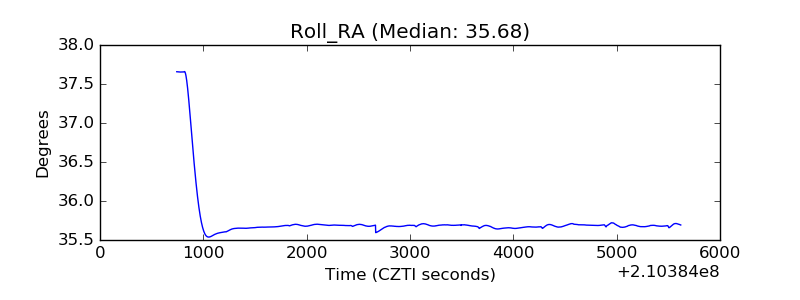 |
| Veto Counter | 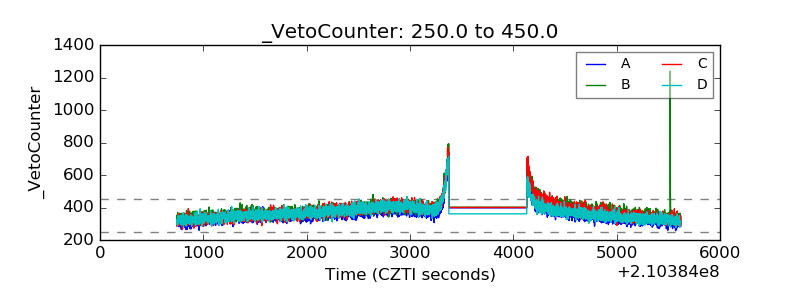 |