| Param | Original file | Final file |
|---|---|---|
| Filename | modeM0/AS1G05_250T02_9000000638_05019cztM0_level2.evt | modeM0/AS1G05_250T02_9000000638_05019cztM0_level2_quad_clean.evt |
| Size (bytes) | 381,732,480 | 69,888,960 |
| Size | 364.0 MB | 66.7 MB |
| Events in quadrant A | 2,610,764 | 426,305 |
| Events in quadrant B | 2,751,073 | 431,993 |
| Events in quadrant C | 2,572,068 | 435,448 |
| Events in quadrant D | 3,228,895 | 413,352 |
| Mode M9 | |||
|---|---|---|---|
| Quadrant | BADHDUFLAG | Total packets | Discarded packets |
| A | 0 | 11 | 0 |
| B | 0 | 11 | 0 |
| C | 0 | 11 | 0 |
| D | 0 | 11 | 0 |
| Mode SS | |||
|---|---|---|---|
| Quadrant | BADHDUFLAG | Total packets | Discarded packets |
| A | 0 | 120 | 0 |
| B | 0 | 120 | 0 |
| C | 0 | 120 | 0 |
| D | 0 | 120 | 0 |
| Mode M0 | |||
|---|---|---|---|
| Quadrant | BADHDUFLAG | Total packets | Discarded packets |
| A | 0 | 11947 | 2 |
| B | 0 | 12103 | 1 |
| C | 0 | 11963 | 1 |
| D | 0 | 13865 | 1 |
| Quadrant | Total seconds | Saturated seconds | Saturation percentage |
|---|---|---|---|
| A | 5851 | 21 | 0.358913% |
| B | 5851 | 34 | 0.581097% |
| C | 5851 | 16 | 0.273458% |
| D | 5851 | 46 | 0.786190% |
Noise dominated data is calculated using 1-second bins in cleaned event files. If a bin has >2000 counts, and if more than 50% of those come from <1% of pixels, then it is considered to be noise-dominated and hence unusable.
| Quadrant | # 1 sec bins | Bins with >0 counts | Bins with >2000 counts | High rate bins dominated by noise | Noise dominated (total time) | Noise dominated (detector-on time) | Marked lightcurve |
|---|---|---|---|---|---|---|---|
| A | 6931 | 5852 | 2 | 2 | 0.03% | 0.03% | 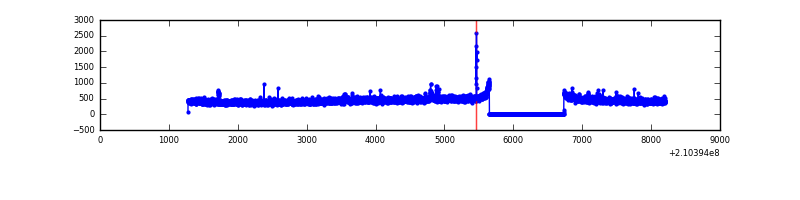 |
| B | 6931 | 5852 | 1 | 1 | 0.01% | 0.02% | 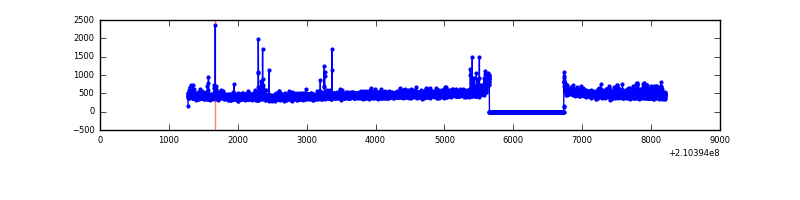 |
| C | 6931 | 5852 | 1 | 1 | 0.01% | 0.02% | 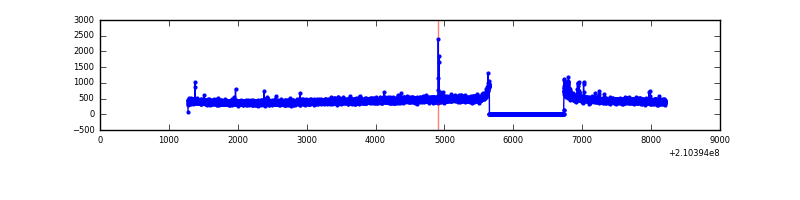 |
| D | 6931 | 5852 | 29 | 29 | 0.42% | 0.50% | 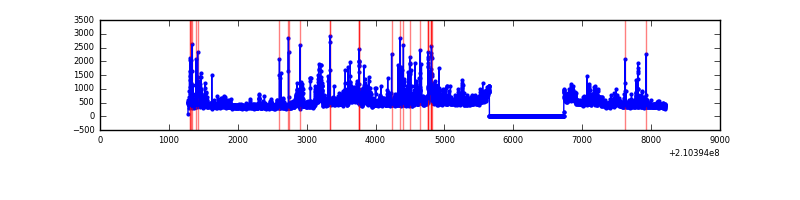 |
Top three noisy pixels from each quadrant. If the there are fewer than three noisy pixels in the level2.evt file, extra rows are filled as -1
| Pixel properties | Quadrant properties | ||||||
|---|---|---|---|---|---|---|---|
| Quadrant | DetID | PixID | Counts | Sigma | Mean | Median | Sigma |
| A | 13 | 251 | 44548 | 327.64 | 660 | 644 | 134.0 |
| A | 0 | 50 | 11698 | 82.49 | 660 | 644 | 134.0 |
| A | 15 | 174 | 8817 | 60.99 | 660 | 644 | 134.0 |
| B | 15 | 204 | 93589 | 728.54 | 666 | 651 | 127.6 |
| B | 4 | 80 | 50641 | 391.87 | 666 | 651 | 127.6 |
| B | 4 | 48 | 14978 | 112.31 | 666 | 651 | 127.6 |
| C | 1 | 16 | 72898 | 490.2 | 637 | 641 | 147.4 |
| C | 13 | 61 | 5399 | 32.28 | 637 | 641 | 147.4 |
| C | 14 | 67 | 4986 | 29.47 | 637 | 641 | 147.4 |
| D | 2 | 136 | 208594 | 1321.96 | 635 | 616 | 157.3 |
| D | 13 | 53 | 130343 | 824.57 | 635 | 616 | 157.3 |
| D | 12 | 227 | 127711 | 807.84 | 635 | 616 | 157.3 |
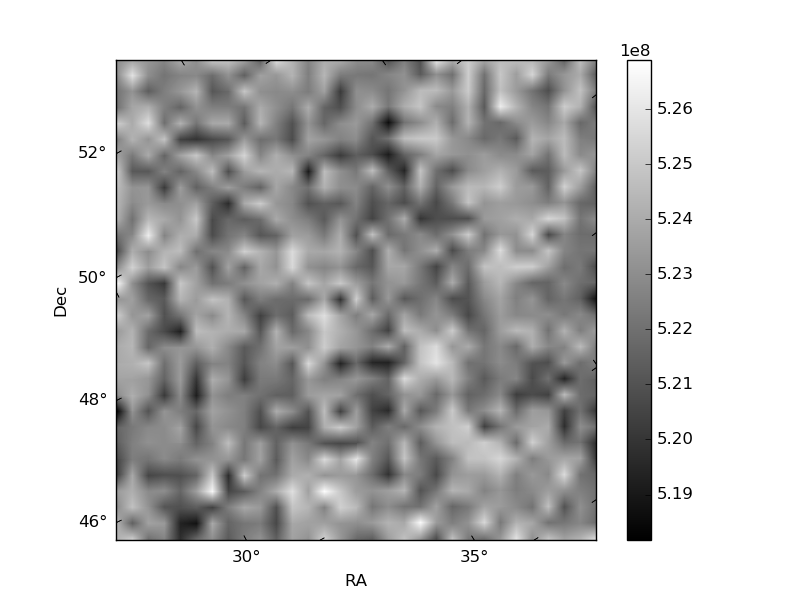
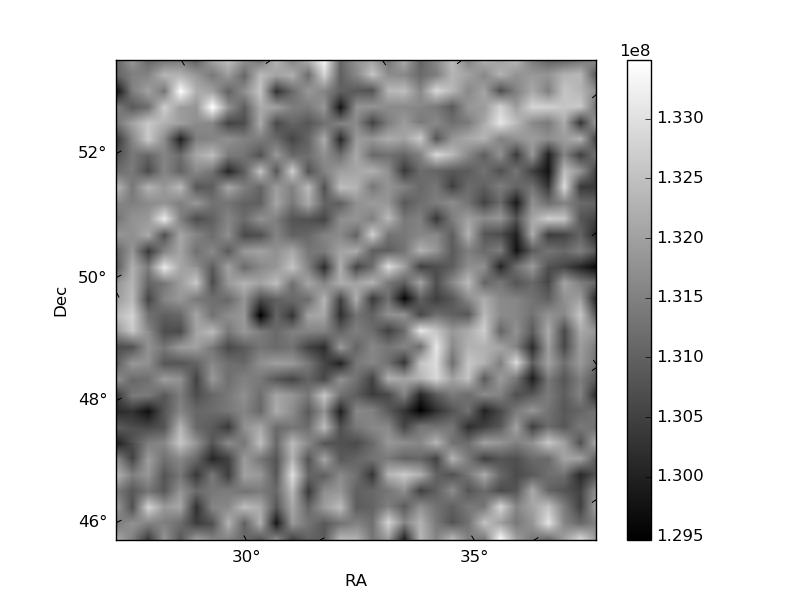
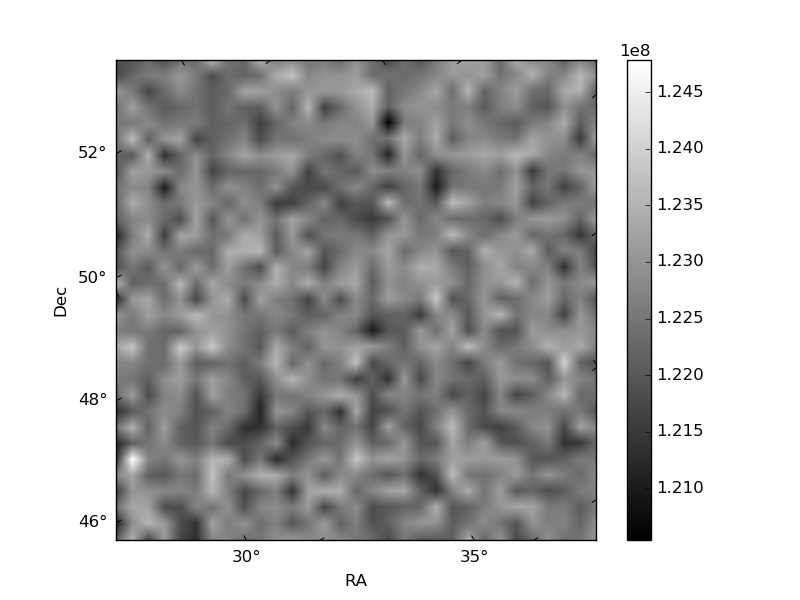
Histogram calculated using DETX and DETY for each event in the final _common_clean file
| Quadrant A | 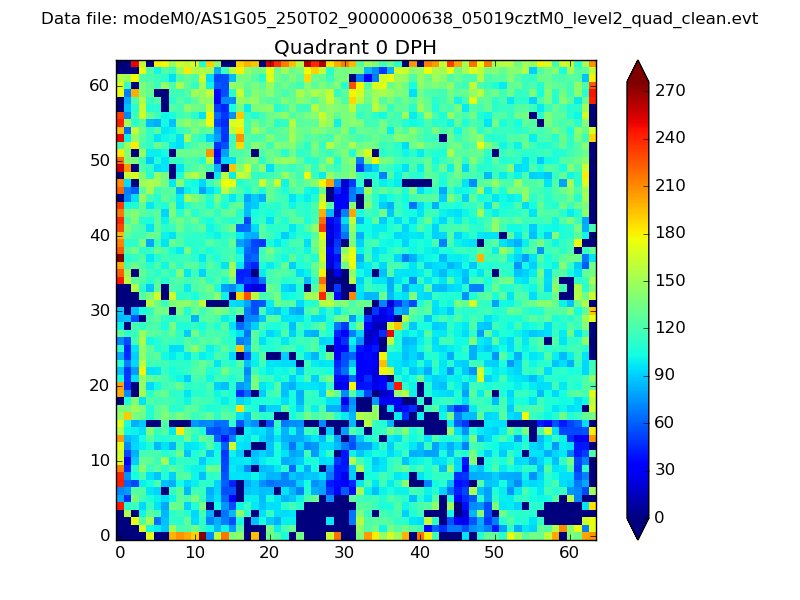 |
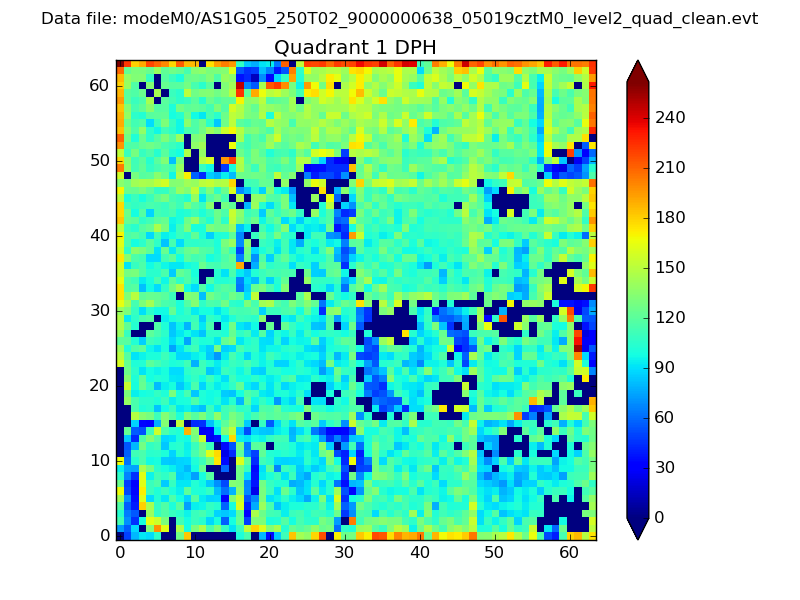 |
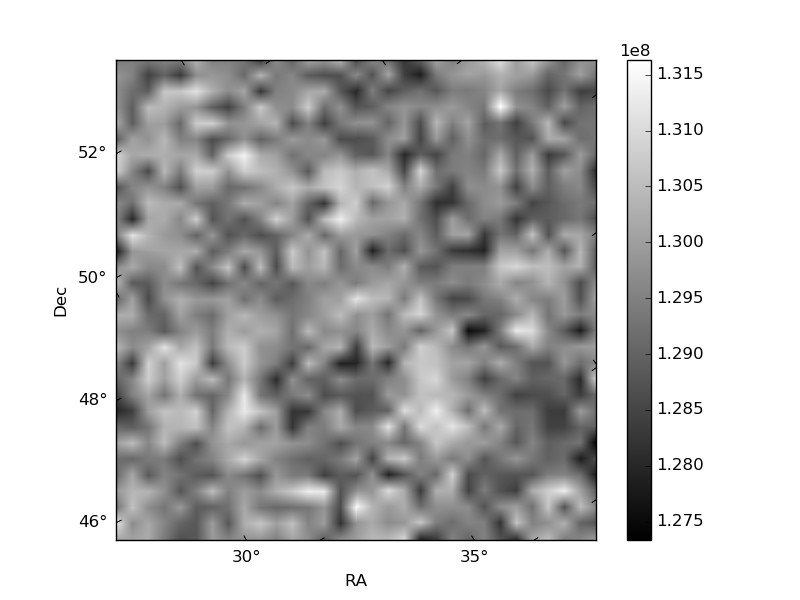
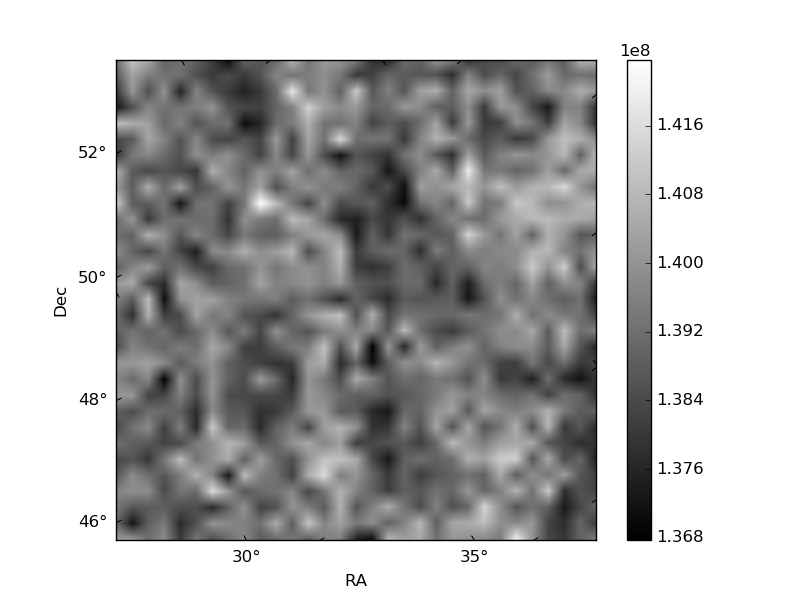
Quadrant B |
|---|---|---|---|
| Quadrant D | 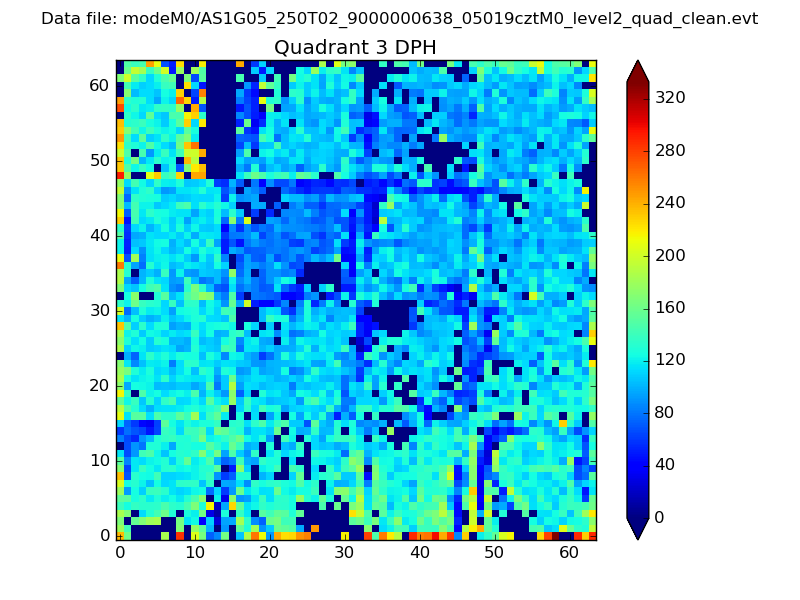 |
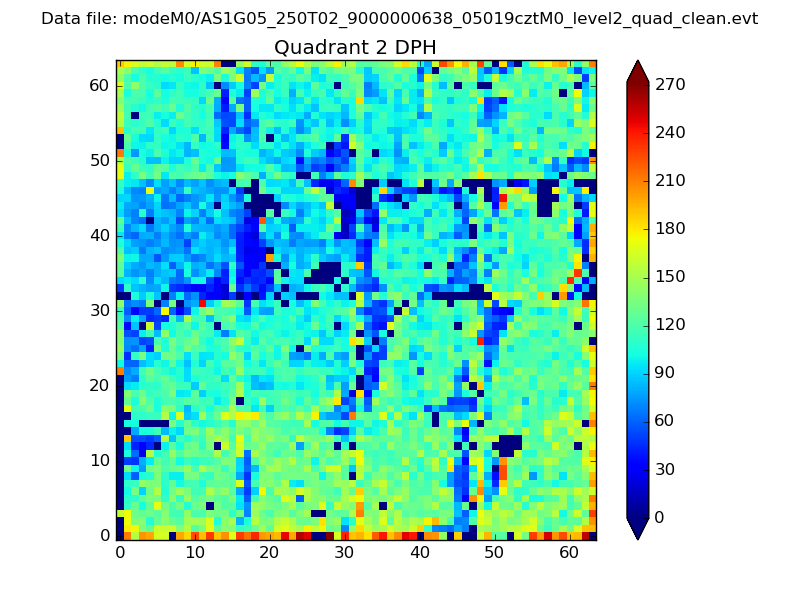 |
Quadrant C |
| Plot type | Count rate plots | Images |
|---|---|---|
| Comparison with Poisson distribution Blue bars denote a histogram of data divided into 1 sec bins. Red curve is a Poisson curve with rate = median count rate of data. |
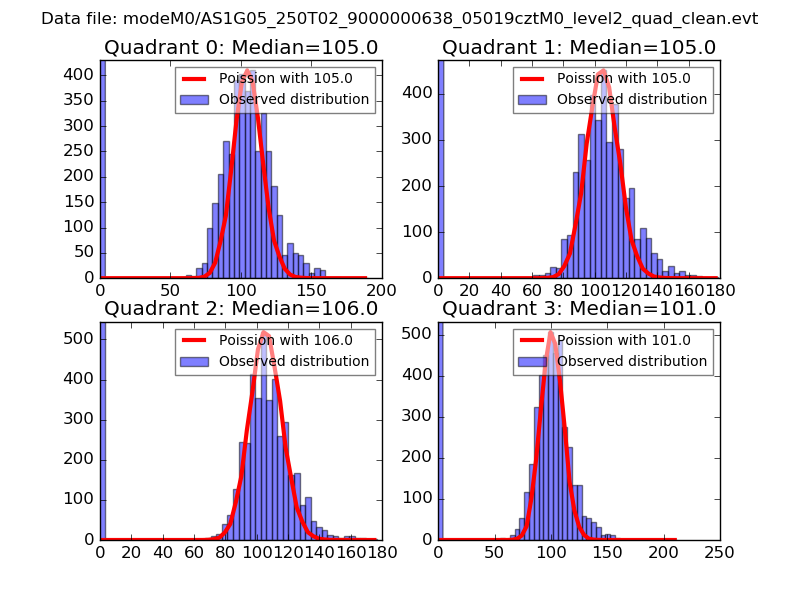 |
 |
| Quadrant-wise count rates Data is divided into 100 sec bins |
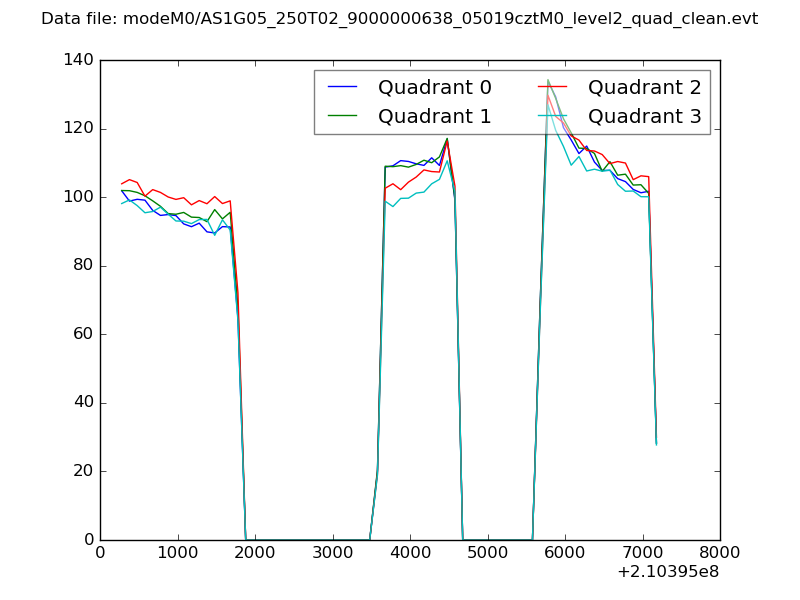 |
|
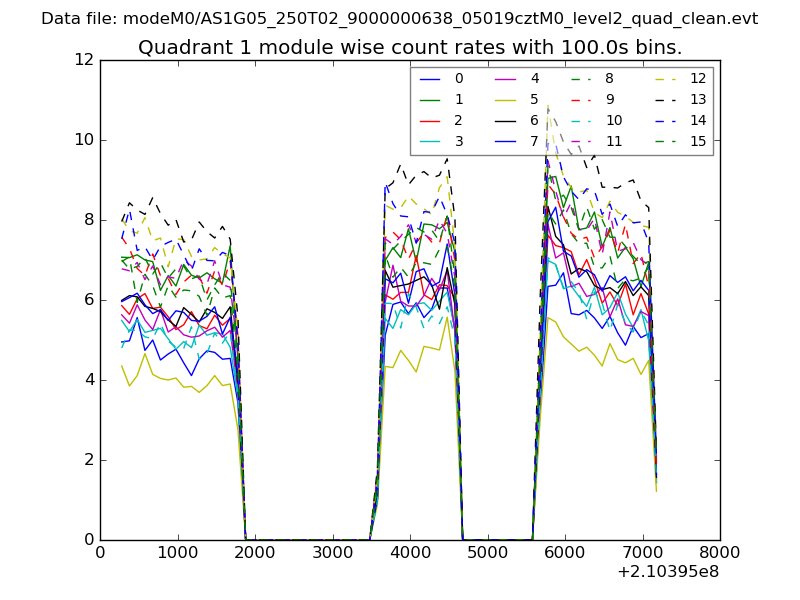
| Module-wise count rates for Quadrant A Data is divided into 100 sec bins |
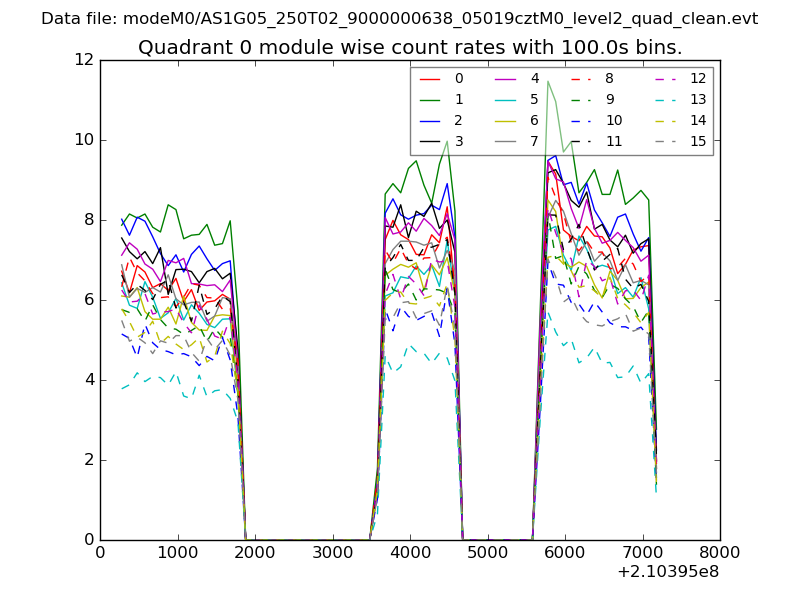 |
 |
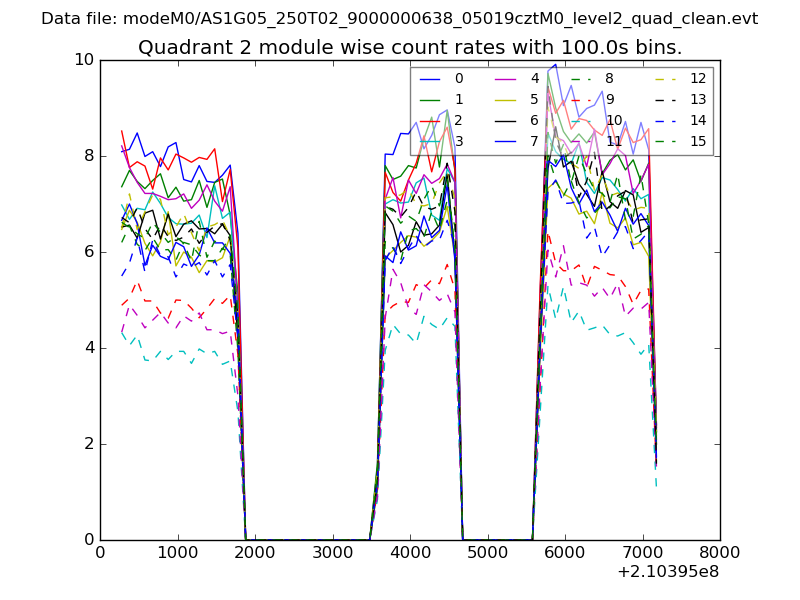
| Module-wise count rates for Quadrant B Data is divided into 100 sec bins |
 |
 |
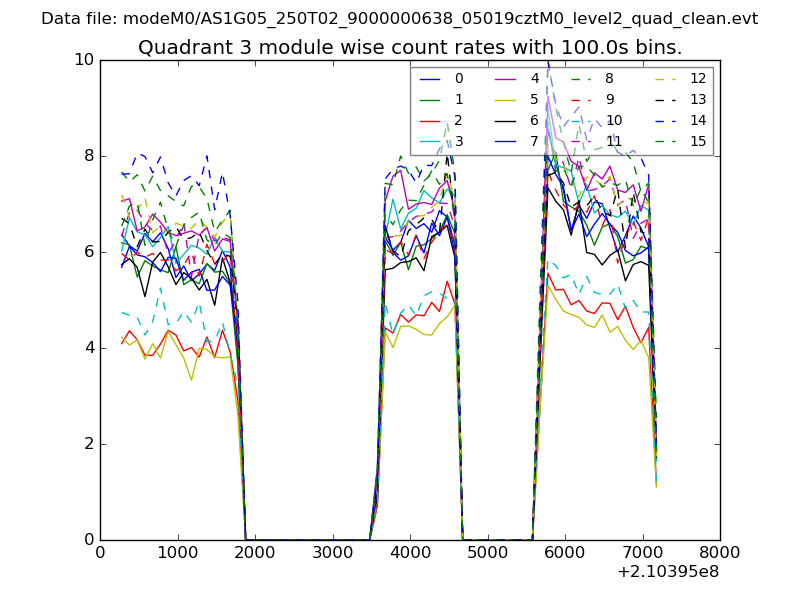
| Module-wise count rates for Quadrant C Data is divided into 100 sec bins |
 |
 |
| Module-wise count rates for Quadrant D Data is divided into 100 sec bins |
 |
 |
| Parameter | Plot |
|---|---|
| CZT HV Monitor | 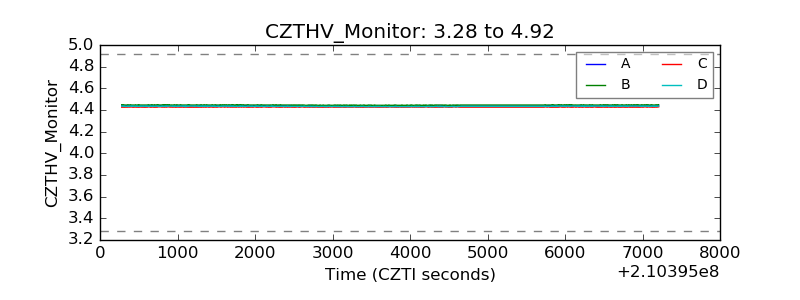 |
| D_VDD | 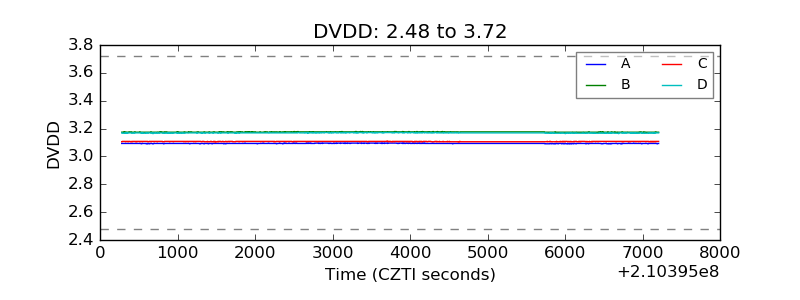 |
| Temperature 1 | 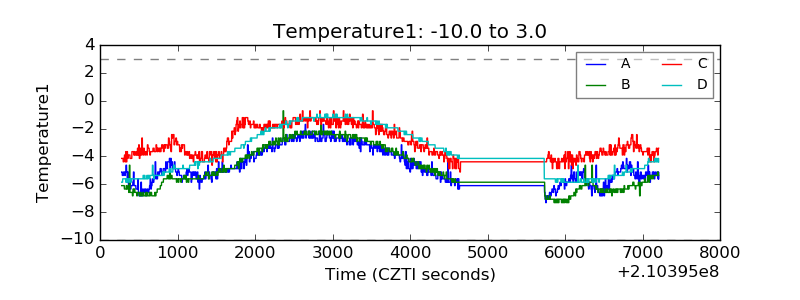 |
| Veto HV Monitor | 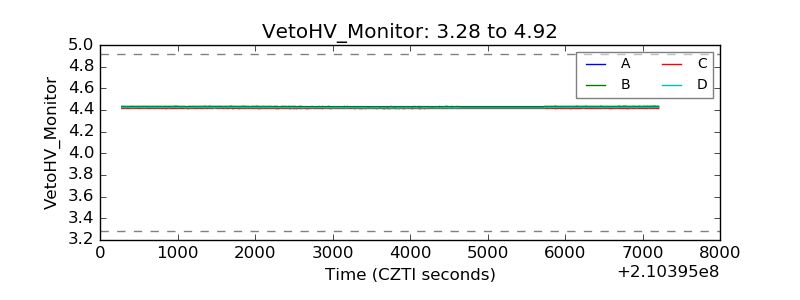 |
| Veto LLD | 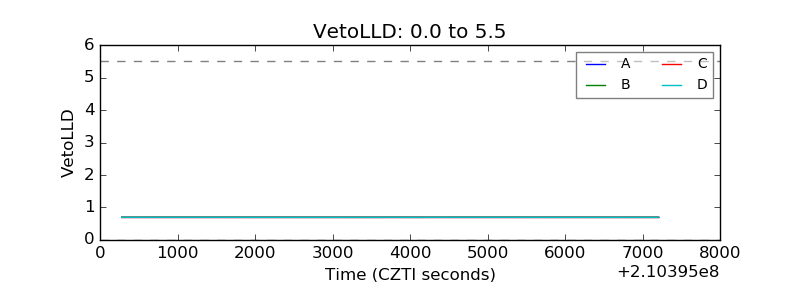 |
| Alpha Counter | 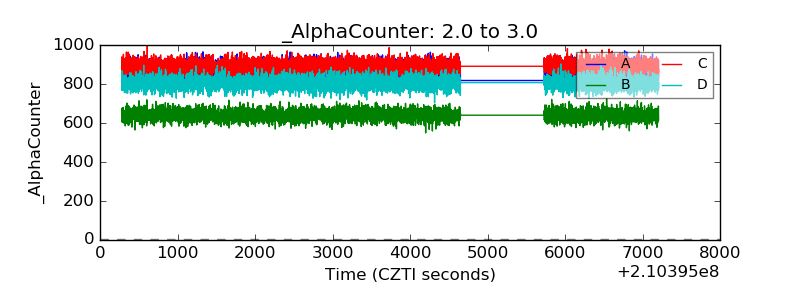 |
| _CPM_Rate | 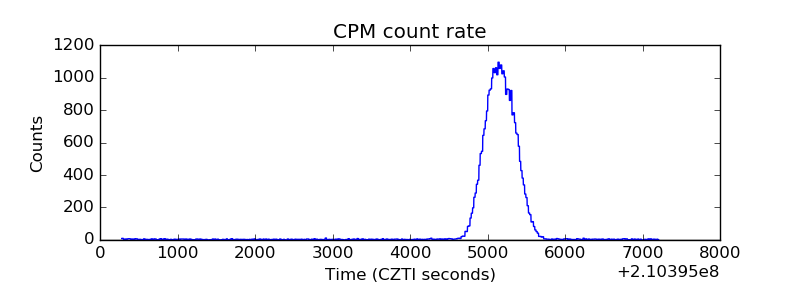 |
| CZT Counter | 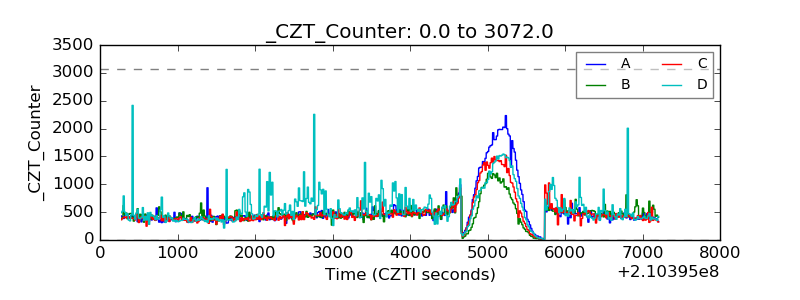 |
| +2.5 Volts monitor | 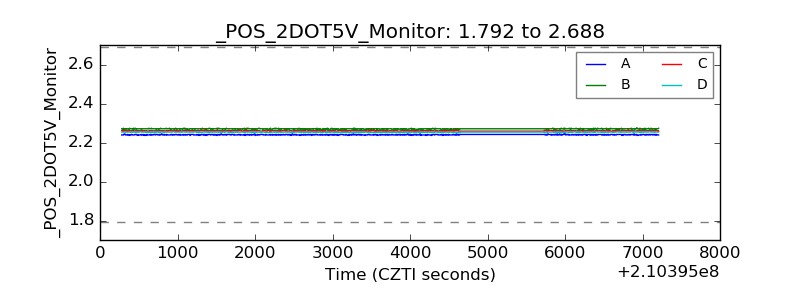 |
| +5 Volts monitor | 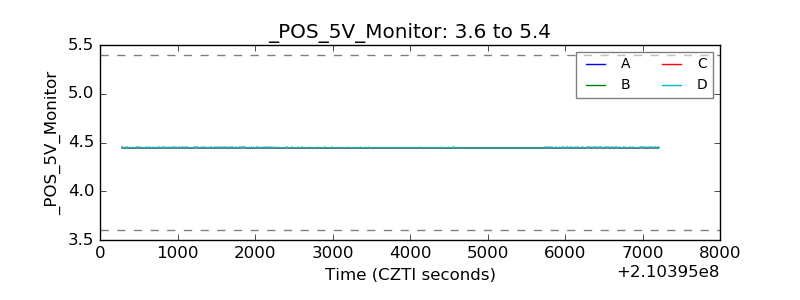 |
| _ROLL_ROT | 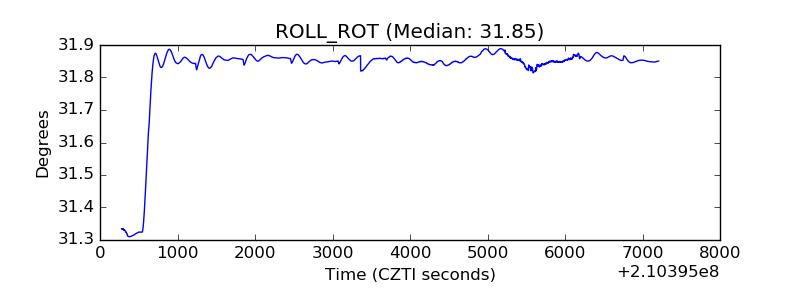 |
| _Roll_DEC | 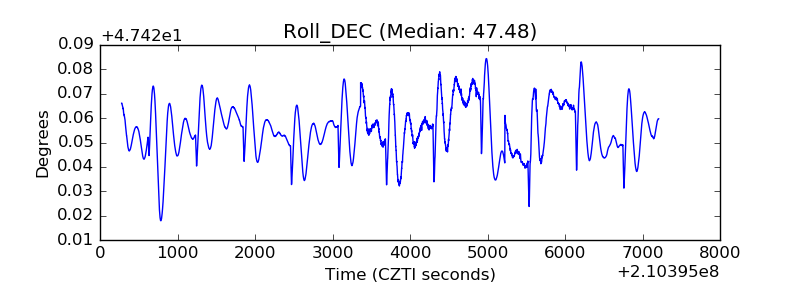 |
| _Roll_RA | 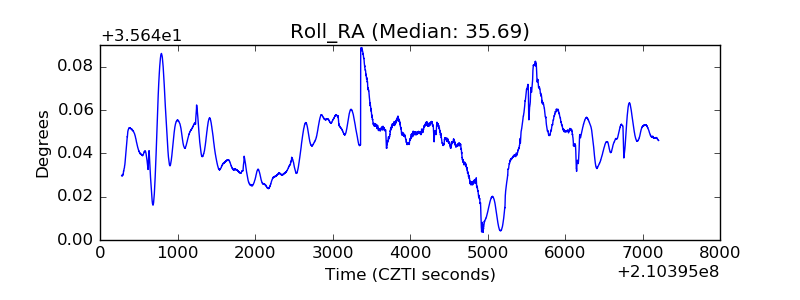 |
| Veto Counter | 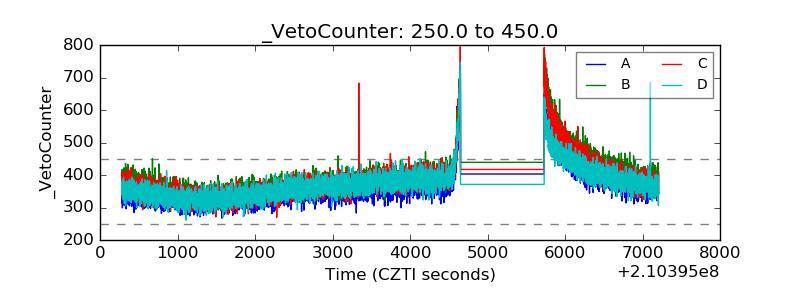 |