| Param | Original file | Final file |
|---|---|---|
| Filename | modeM0/AS1G05_250T02_9000000638_05022cztM0_level2.evt | modeM0/AS1G05_250T02_9000000638_05022cztM0_level2_quad_clean.evt |
| Size (bytes) | 1,119,602,880 | 186,114,240 |
| Size | 1.0 GB | 177.5 MB |
| Events in quadrant A | 8,022,497 | 1,139,361 |
| Events in quadrant B | 8,328,016 | 1,157,808 |
| Events in quadrant C | 7,299,630 | 1,151,654 |
| Events in quadrant D | 9,187,558 | 1,096,476 |
| Mode M9 | |||
|---|---|---|---|
| Quadrant | BADHDUFLAG | Total packets | Discarded packets |
| A | 0 | 36 | 0 |
| B | 0 | 36 | 0 |
| C | 0 | 36 | 0 |
| D | 0 | 36 | 0 |
| Mode SS | |||
|---|---|---|---|
| Quadrant | BADHDUFLAG | Total packets | Discarded packets |
| A | 0 | 322 | 0 |
| B | 0 | 322 | 0 |
| C | 0 | 322 | 0 |
| D | 0 | 322 | 0 |
| Mode M0 | |||
|---|---|---|---|
| Quadrant | BADHDUFLAG | Total packets | Discarded packets |
| A | 0 | 34444 | 4 |
| B | 0 | 34741 | 3 |
| C | 0 | 32407 | 3 |
| D | 0 | 38015 | 3 |
| Quadrant | Total seconds | Saturated seconds | Saturation percentage |
|---|---|---|---|
| A | 15818 | 359 | 2.269566% |
| B | 15818 | 259 | 1.637375% |
| C | 15818 | 132 | 0.834492% |
| D | 15818 | 334 | 2.111519% |
Noise dominated data is calculated using 1-second bins in cleaned event files. If a bin has >2000 counts, and if more than 50% of those come from <1% of pixels, then it is considered to be noise-dominated and hence unusable.
| Quadrant | # 1 sec bins | Bins with >0 counts | Bins with >2000 counts | High rate bins dominated by noise | Noise dominated (total time) | Noise dominated (detector-on time) | Marked lightcurve |
|---|---|---|---|---|---|---|---|
| A | 19458 | 15821 | 120 | 120 | 0.62% | 0.76% | 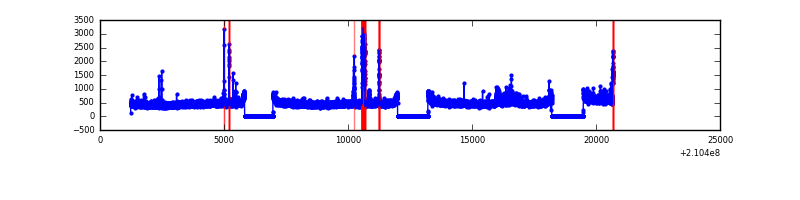 |
| B | 19458 | 15821 | 12 | 12 | 0.06% | 0.08% | 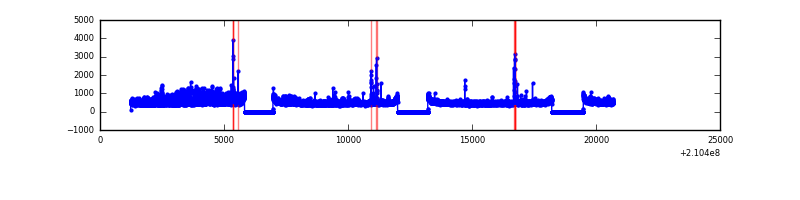 |
| C | 19458 | 15821 | 0 | 0 | 0.00% | 0.00% | 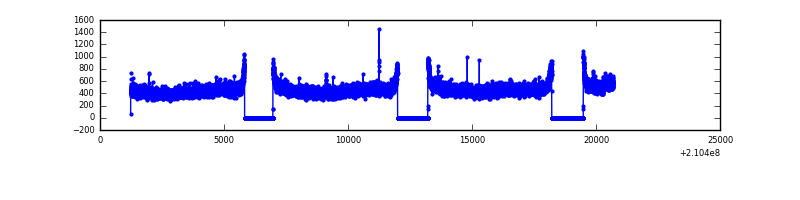 |
| D | 19458 | 15821 | 141 | 141 | 0.72% | 0.89% | 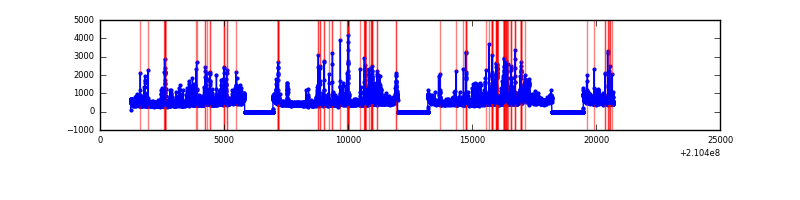 |
Top three noisy pixels from each quadrant. If the there are fewer than three noisy pixels in the level2.evt file, extra rows are filled as -1
| Pixel properties | Quadrant properties | ||||||
|---|---|---|---|---|---|---|---|
| Quadrant | DetID | PixID | Counts | Sigma | Mean | Median | Sigma |
| A | 0 | 50 | 351114 | 908.8 | 1903 | 1865 | 384.3 |
| A | 14 | 111 | 176402 | 454.17 | 1903 | 1865 | 384.3 |
| A | 13 | 251 | 134082 | 344.05 | 1903 | 1865 | 384.3 |
| B | 15 | 204 | 668234 | 1847.14 | 1909 | 1866 | 360.8 |
| B | 0 | 219 | 111417 | 303.67 | 1909 | 1866 | 360.8 |
| B | 4 | 48 | 108319 | 295.08 | 1909 | 1866 | 360.8 |
| C | 1 | 16 | 143955 | 341.3 | 1830 | 1838 | 416.4 |
| C | 13 | 61 | 14995 | 31.6 | 1830 | 1838 | 416.4 |
| C | 9 | 54 | 10228 | 20.15 | 1830 | 1838 | 416.4 |
| D | 2 | 136 | 704301 | 1562.22 | 1839 | 1779 | 449.7 |
| D | 13 | 239 | 397217 | 879.35 | 1839 | 1779 | 449.7 |
| D | 12 | 227 | 337164 | 745.81 | 1839 | 1779 | 449.7 |
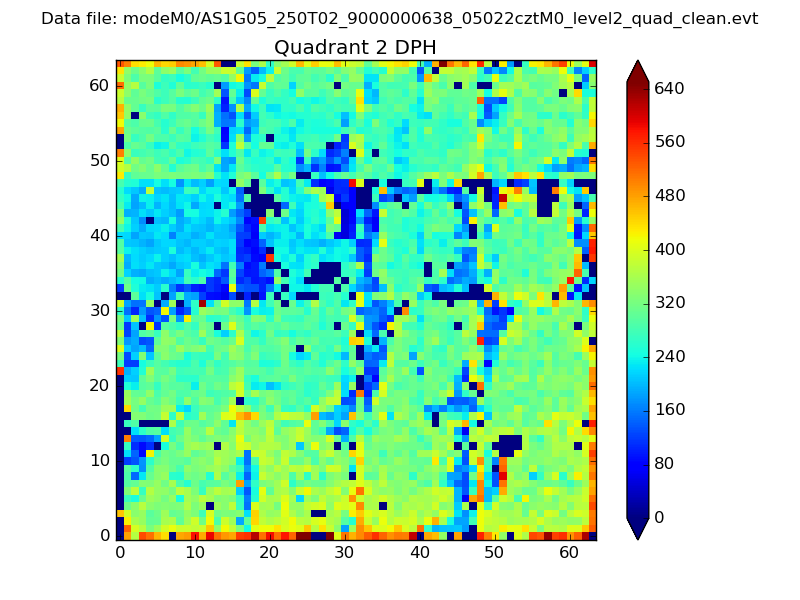
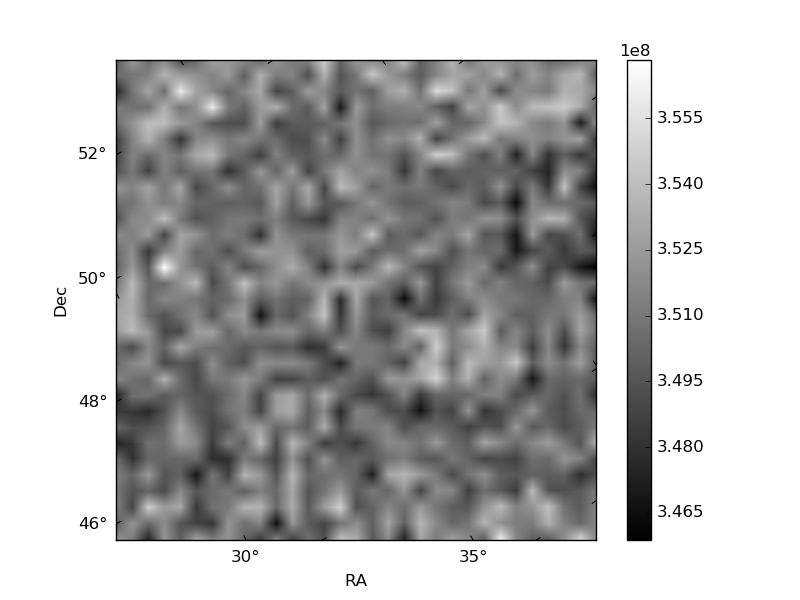
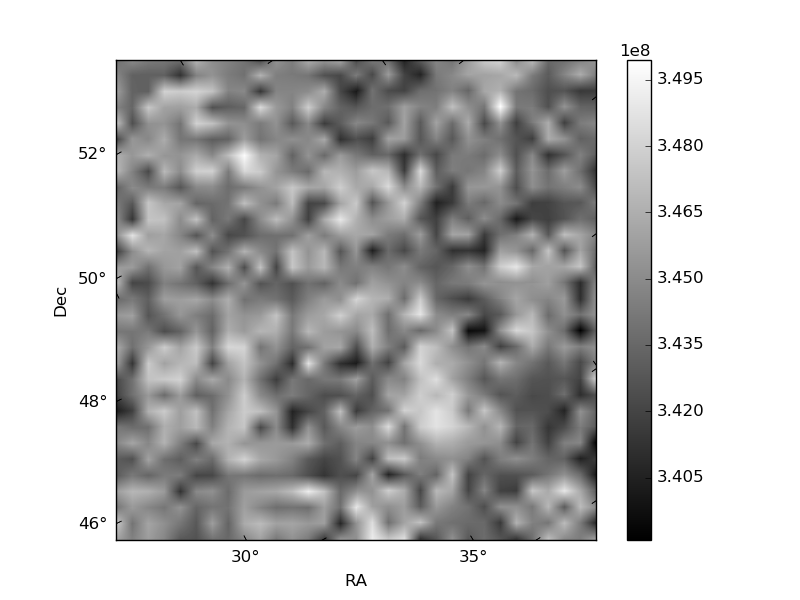
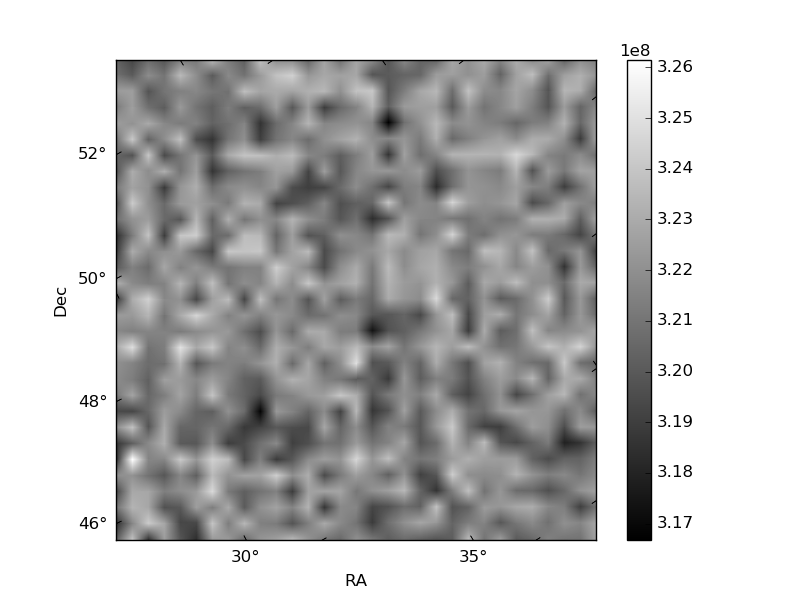
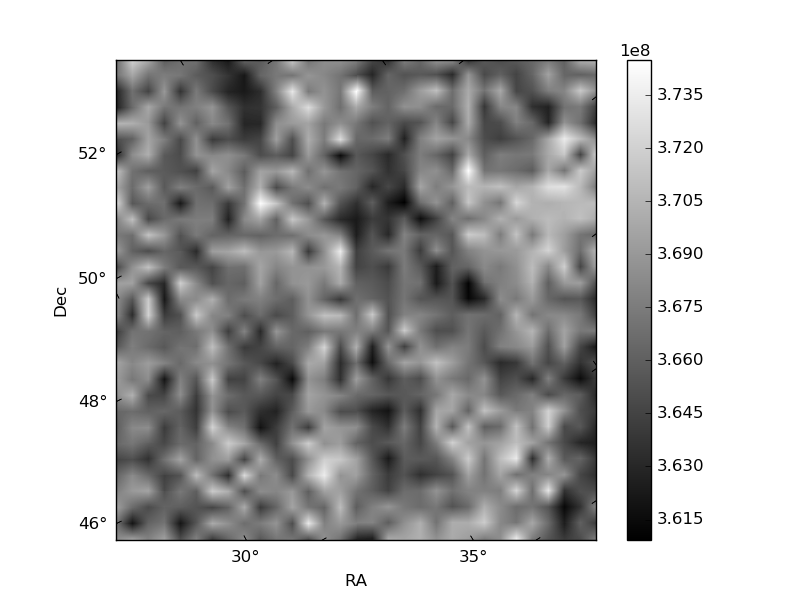
Histogram calculated using DETX and DETY for each event in the final _common_clean file
| Quadrant A | 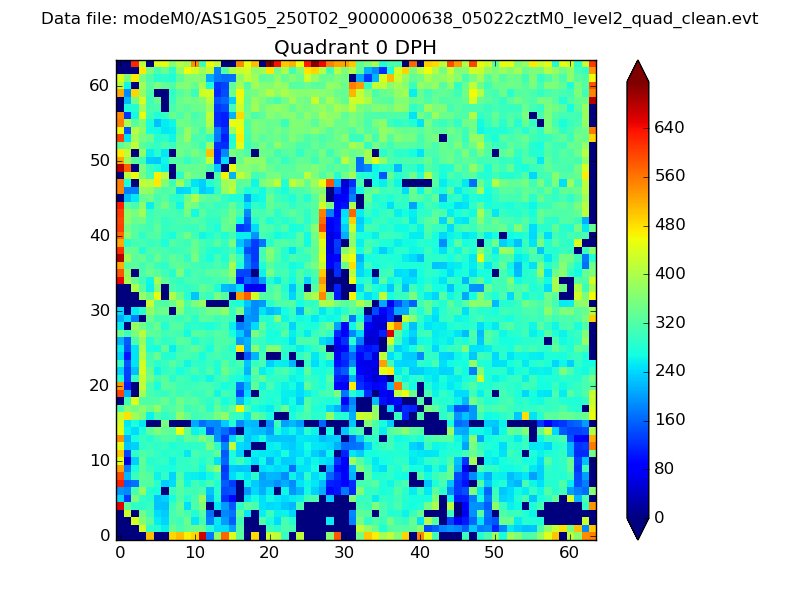 |
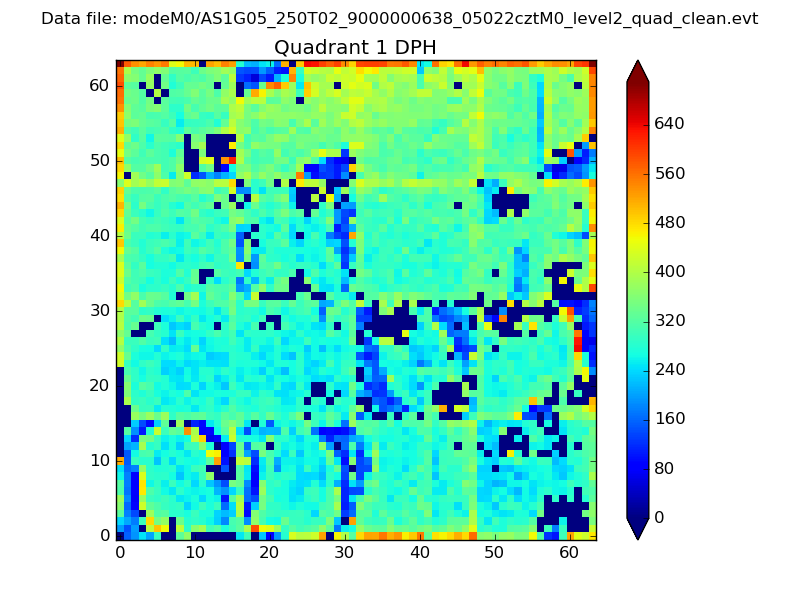 |
Quadrant B |
|---|---|---|---|
| Quadrant D | 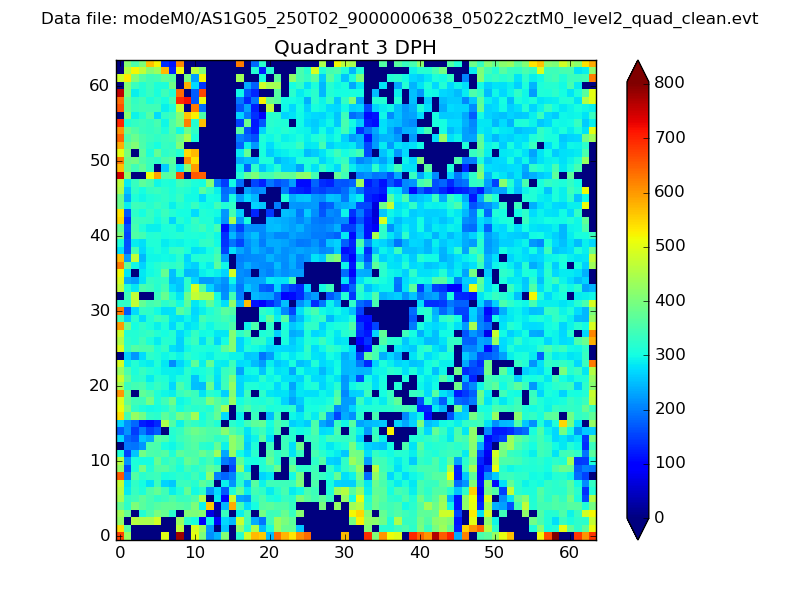 |
 |
Quadrant C |
| Plot type | Count rate plots | Images |
|---|---|---|
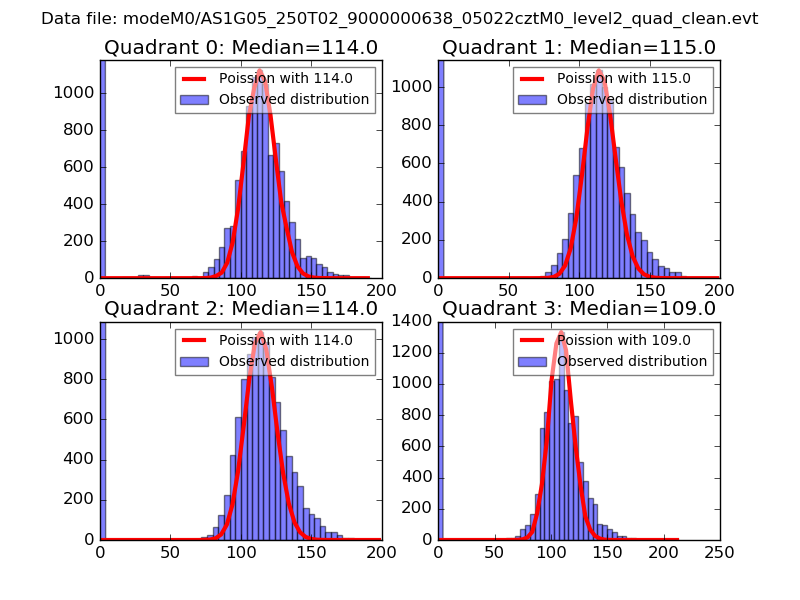
| Comparison with Poisson distribution Blue bars denote a histogram of data divided into 1 sec bins. Red curve is a Poisson curve with rate = median count rate of data. |
 |
 |
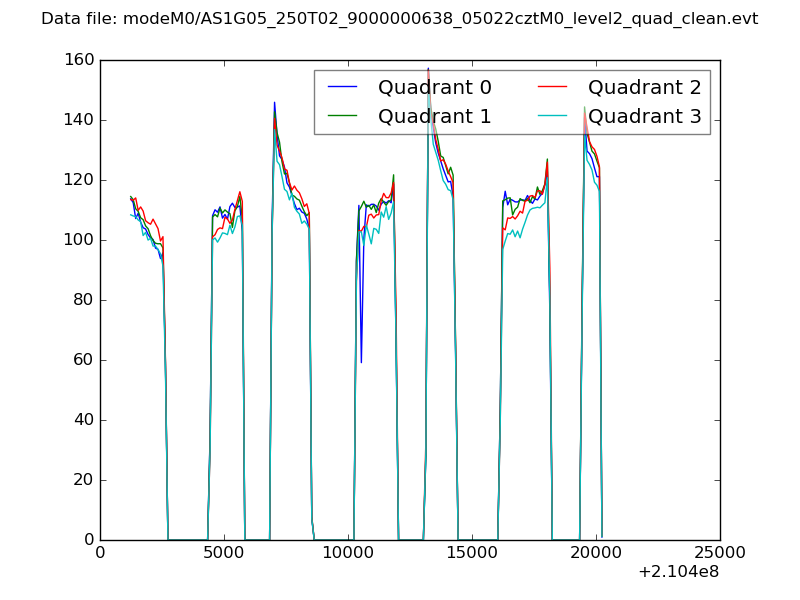
| Quadrant-wise count rates Data is divided into 100 sec bins |
 |
|
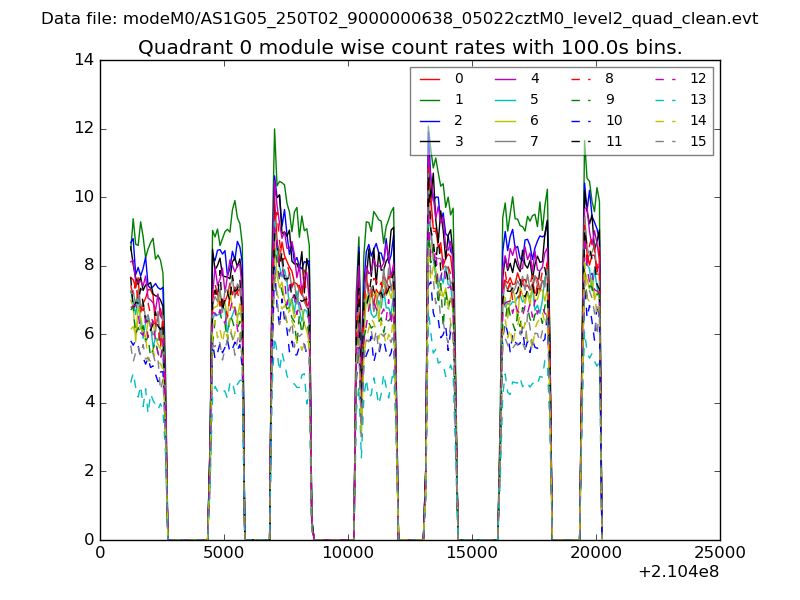
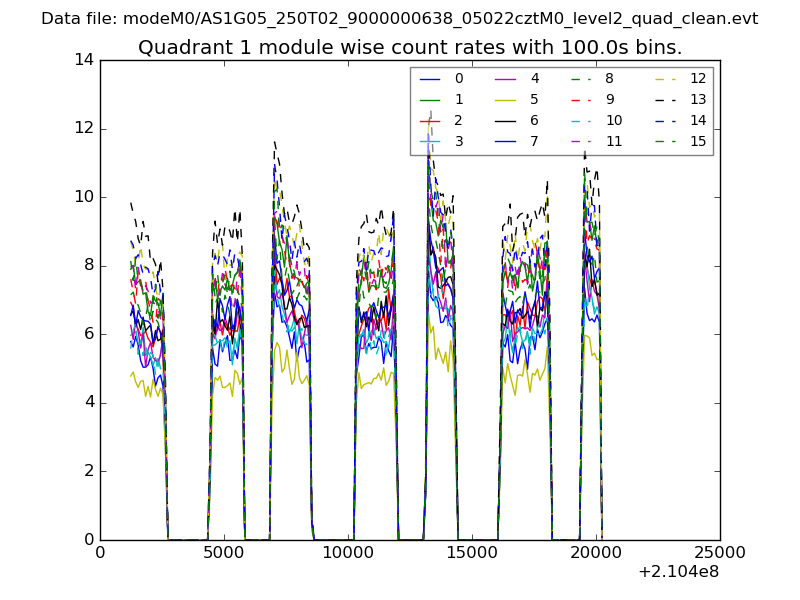
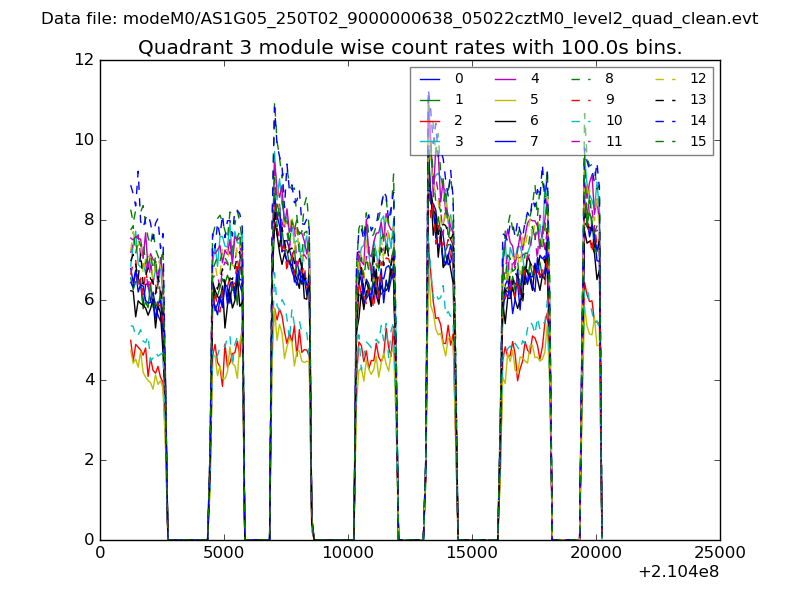
| Module-wise count rates for Quadrant A Data is divided into 100 sec bins |
 |
 |
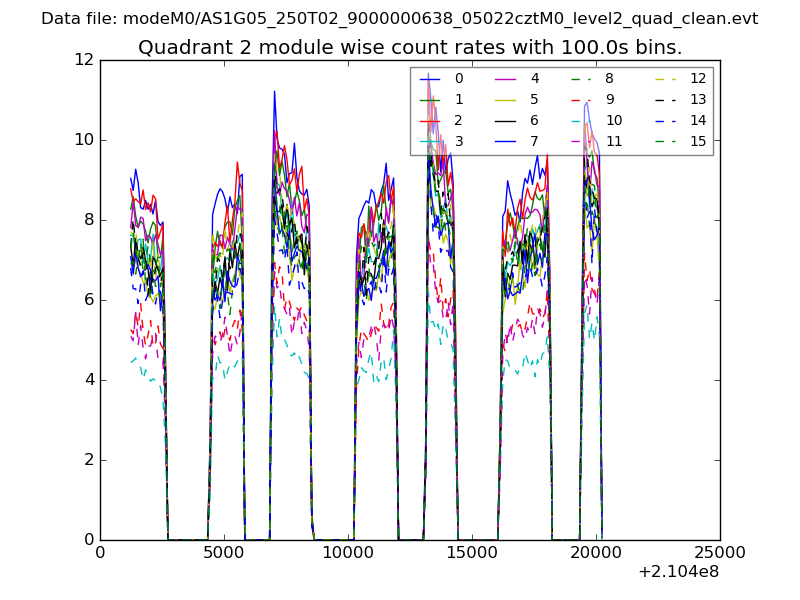
| Module-wise count rates for Quadrant B Data is divided into 100 sec bins |
 |
 |
| Module-wise count rates for Quadrant C Data is divided into 100 sec bins |
 |
 |
| Module-wise count rates for Quadrant D Data is divided into 100 sec bins |
 |
 |
| Parameter | Plot |
|---|---|
| CZT HV Monitor | 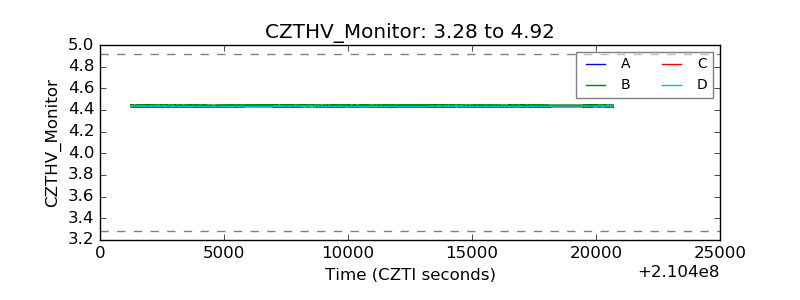 |
| D_VDD | 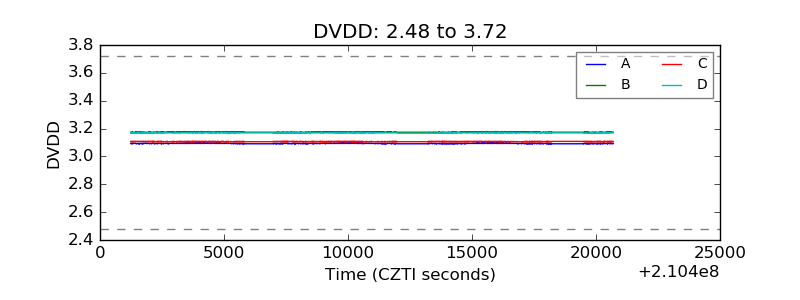 |
| Temperature 1 | 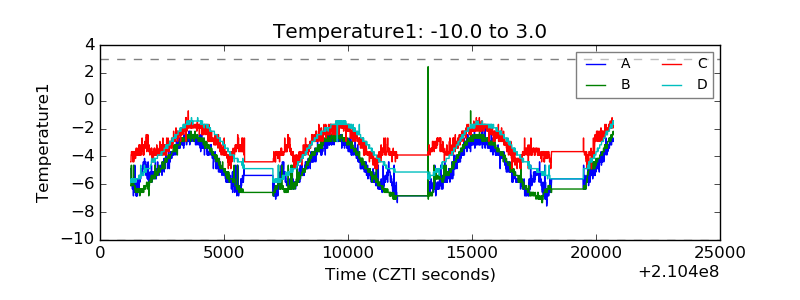 |
| Veto HV Monitor |  |
| Veto LLD | 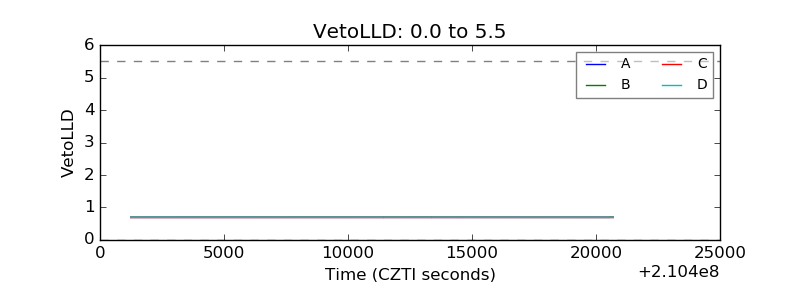 |
| Alpha Counter | 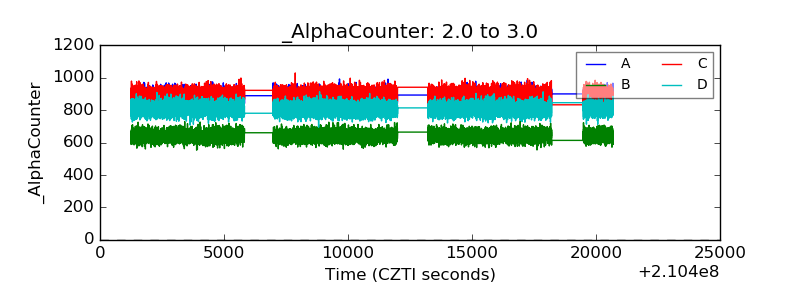 |
| _CPM_Rate | 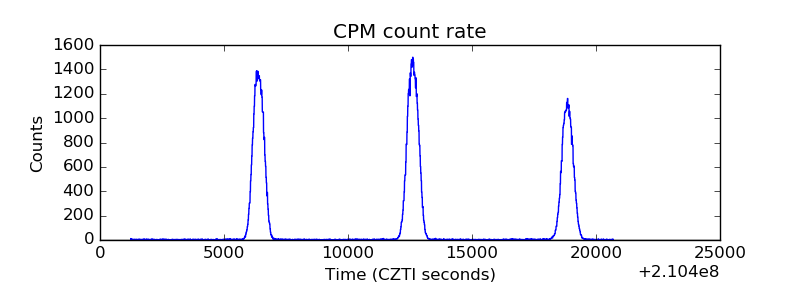 |
| CZT Counter | 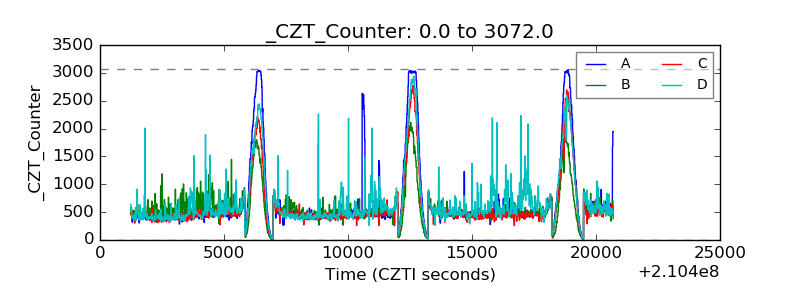 |
| +2.5 Volts monitor |  |
| +5 Volts monitor |  |
| _ROLL_ROT | 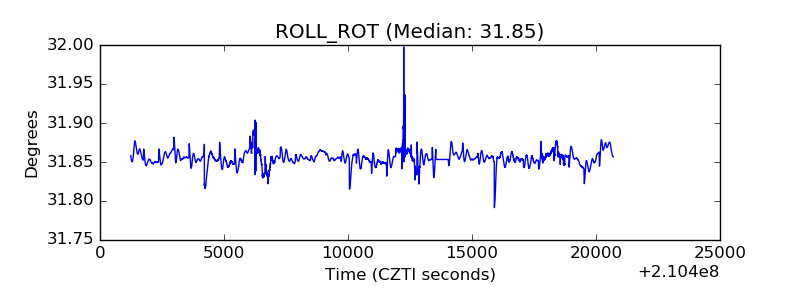 |
| _Roll_DEC | 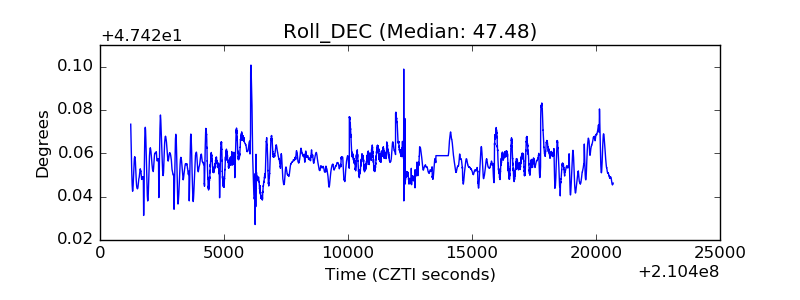 |
| _Roll_RA | 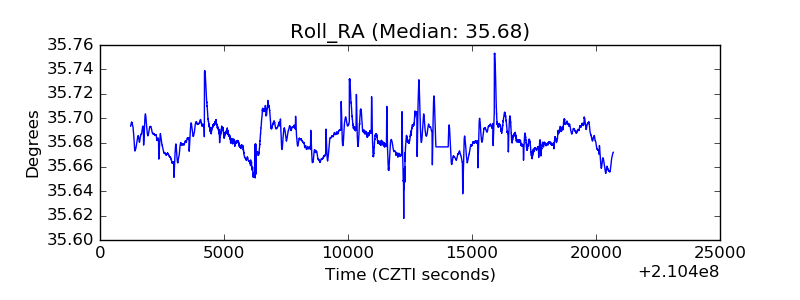 |
| Veto Counter | 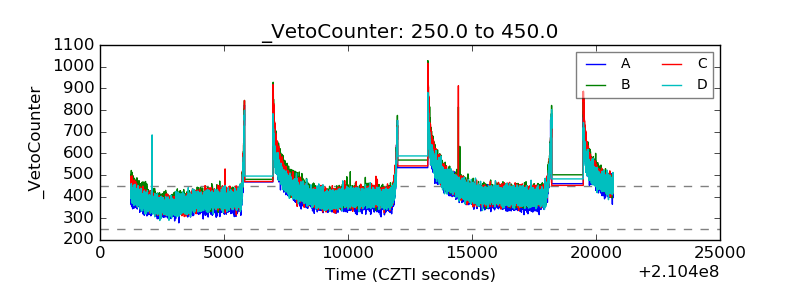 |