| Param | Original file | Final file |
|---|---|---|
| Filename | modeM0/AS1G05_250T02_9000000638_05023cztM0_level2.evt | modeM0/AS1G05_250T02_9000000638_05023cztM0_level2_quad_clean.evt |
| Size (bytes) | 504,936,000 | 69,382,080 |
| Size | 481.5 MB | 66.2 MB |
| Events in quadrant A | 3,521,563 | 418,138 |
| Events in quadrant B | 3,445,473 | 422,408 |
| Events in quadrant C | 3,513,693 | 420,157 |
| Events in quadrant D | 4,373,960 | 390,287 |
| Mode M9 | |||
|---|---|---|---|
| Quadrant | BADHDUFLAG | Total packets | Discarded packets |
| A | 0 | 13 | 0 |
| B | 0 | 13 | 0 |
| C | 0 | 13 | 0 |
| D | 0 | 14 | 0 |
| Mode SS | |||
|---|---|---|---|
| Quadrant | BADHDUFLAG | Total packets | Discarded packets |
| A | 0 | 130 | 0 |
| B | 0 | 130 | 0 |
| C | 0 | 130 | 0 |
| D | 0 | 130 | 0 |
| Mode M0 | |||
|---|---|---|---|
| Quadrant | BADHDUFLAG | Total packets | Discarded packets |
| A | 0 | 14927 | 3 |
| B | 0 | 14133 | 2 |
| C | 0 | 14169 | 2 |
| D | 0 | 17151 | 2 |
| Quadrant | Total seconds | Saturated seconds | Saturation percentage |
|---|---|---|---|
| A | 6447 | 151 | 2.342175% |
| B | 6447 | 144 | 2.233597% |
| C | 6447 | 93 | 1.442531% |
| D | 6447 | 295 | 4.575772% |
Noise dominated data is calculated using 1-second bins in cleaned event files. If a bin has >2000 counts, and if more than 50% of those come from <1% of pixels, then it is considered to be noise-dominated and hence unusable.
| Quadrant | # 1 sec bins | Bins with >0 counts | Bins with >2000 counts | High rate bins dominated by noise | Noise dominated (total time) | Noise dominated (detector-on time) | Marked lightcurve |
|---|---|---|---|---|---|---|---|
| A | 7692 | 6448 | 21 | 21 | 0.27% | 0.33% | 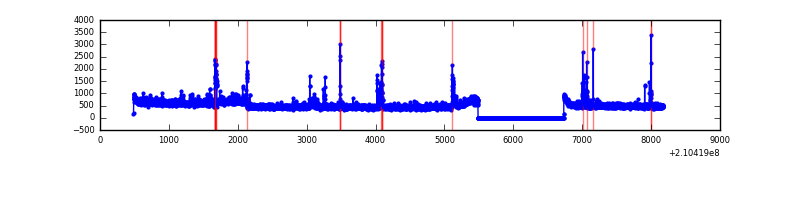 |
| B | 7692 | 6448 | 22 | 22 | 0.29% | 0.34% | 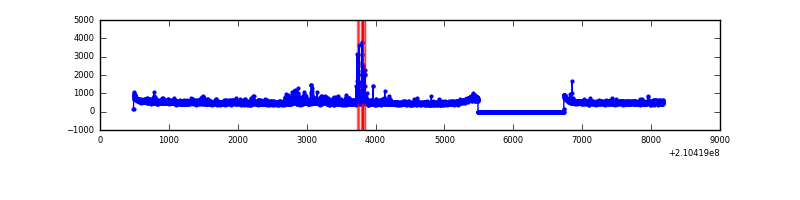 |
| C | 7692 | 6448 | 1 | 1 | 0.01% | 0.02% | 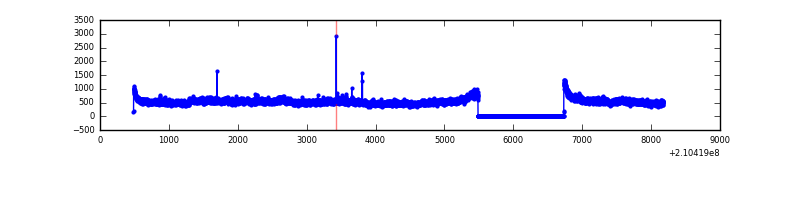 |
| D | 7692 | 6448 | 112 | 112 | 1.46% | 1.74% | 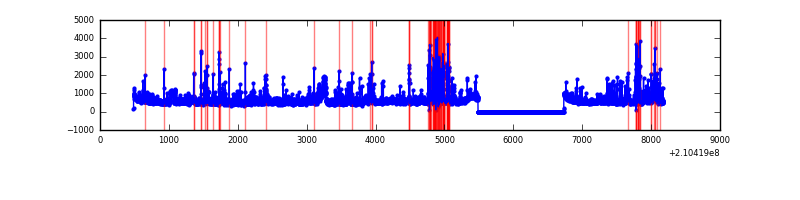 |
Top three noisy pixels from each quadrant. If the there are fewer than three noisy pixels in the level2.evt file, extra rows are filled as -1
| Pixel properties | Quadrant properties | ||||||
|---|---|---|---|---|---|---|---|
| Quadrant | DetID | PixID | Counts | Sigma | Mean | Median | Sigma |
| A | 14 | 111 | 282667 | 1732.6 | 803 | 786 | 162.7 |
| A | 0 | 50 | 94392 | 575.36 | 803 | 786 | 162.7 |
| A | 4 | 2 | 45805 | 276.71 | 803 | 786 | 162.7 |
| B | 15 | 204 | 206958 | 1352.8 | 804 | 786 | 152.4 |
| B | 0 | 219 | 109190 | 711.29 | 804 | 786 | 152.4 |
| B | 15 | 54 | 16642 | 104.04 | 804 | 786 | 152.4 |
| C | 1 | 16 | 480850 | 2698.34 | 772 | 777 | 177.9 |
| C | 8 | 128 | 7387 | 37.15 | 772 | 777 | 177.9 |
| C | 13 | 61 | 6407 | 31.64 | 772 | 777 | 177.9 |
| D | 13 | 235 | 489813 | 2631.79 | 766 | 743 | 185.8 |
| D | 12 | 227 | 283325 | 1520.63 | 766 | 743 | 185.8 |
| D | 2 | 136 | 146560 | 784.67 | 766 | 743 | 185.8 |
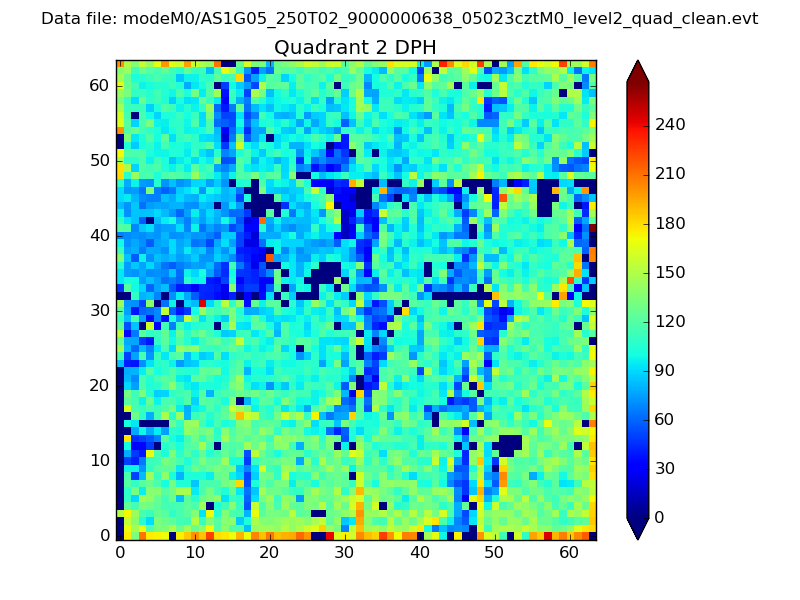
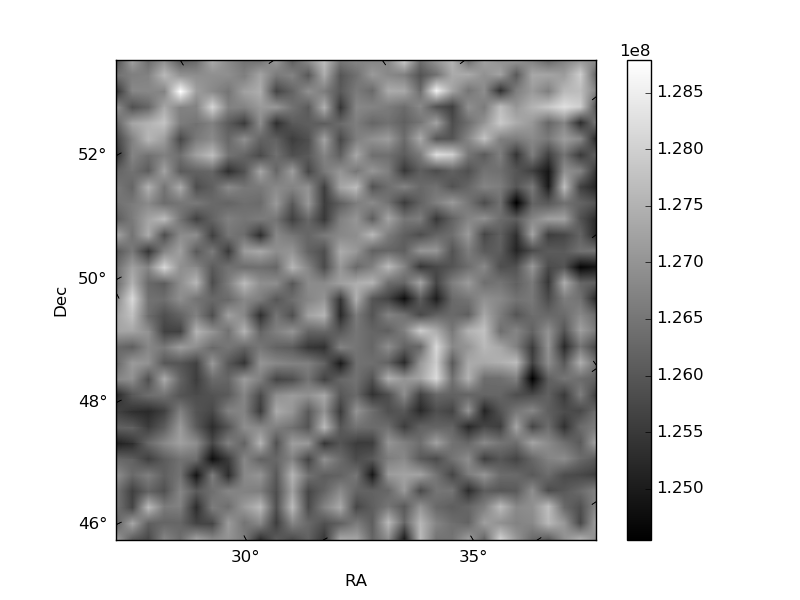
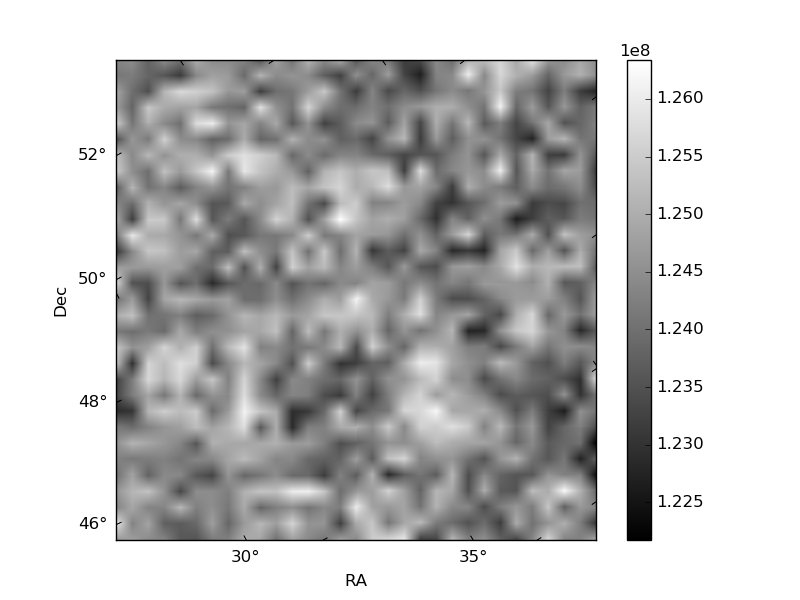
Histogram calculated using DETX and DETY for each event in the final _common_clean file
| Quadrant A | 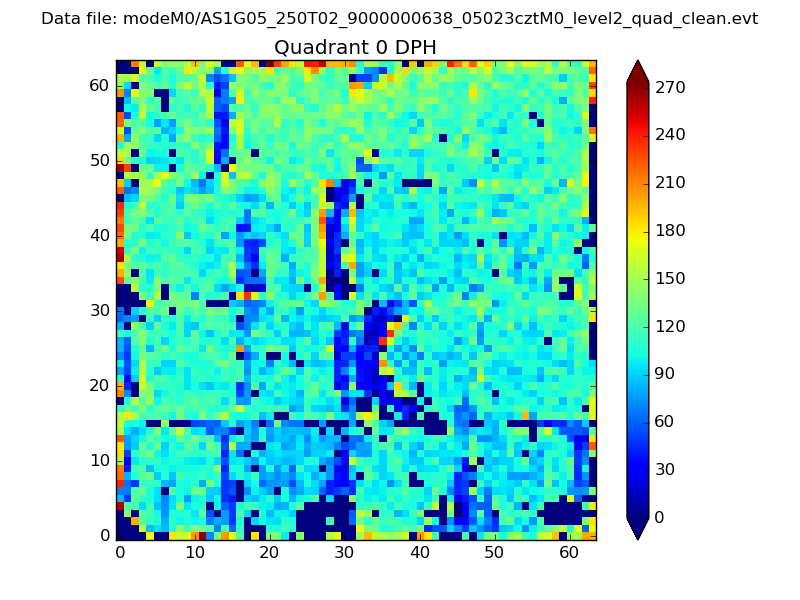 |
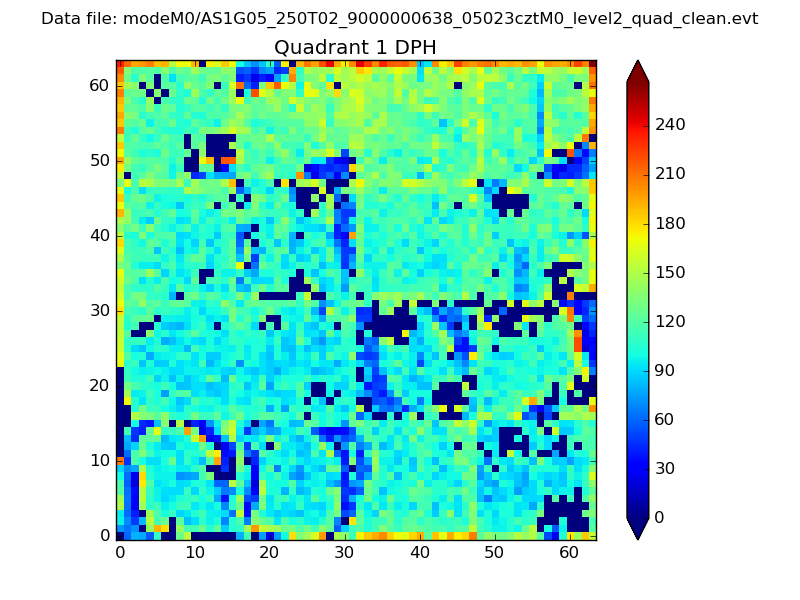 |
Quadrant B |
|---|---|---|---|
| Quadrant D | 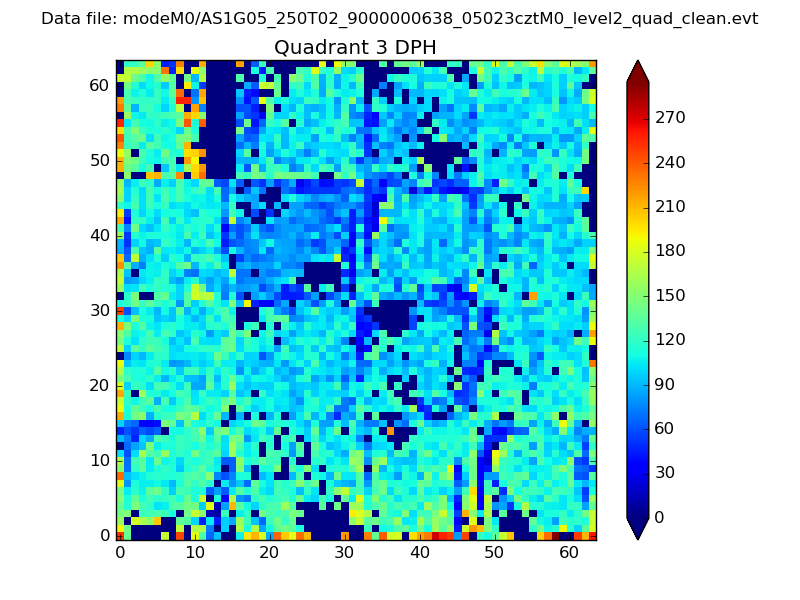 |
 |
Quadrant C |
| Plot type | Count rate plots | Images |
|---|---|---|
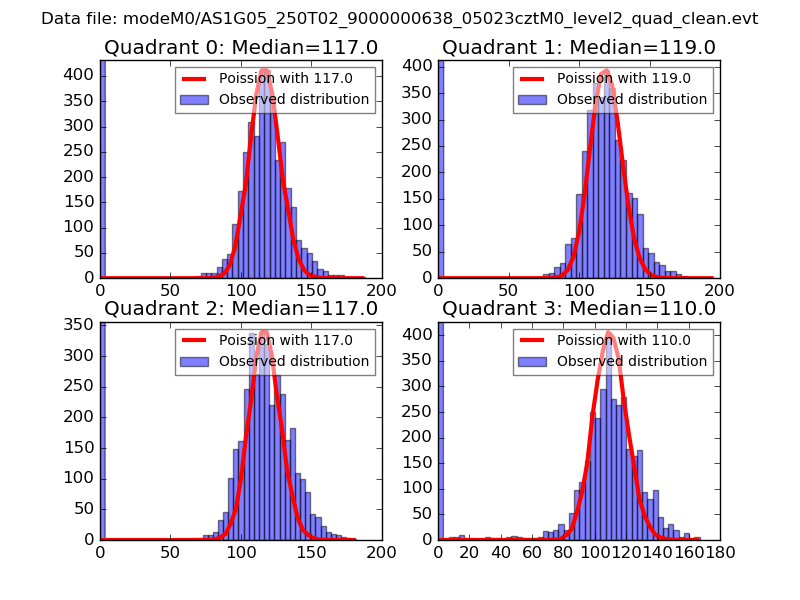
| Comparison with Poisson distribution Blue bars denote a histogram of data divided into 1 sec bins. Red curve is a Poisson curve with rate = median count rate of data. |
 |
 |
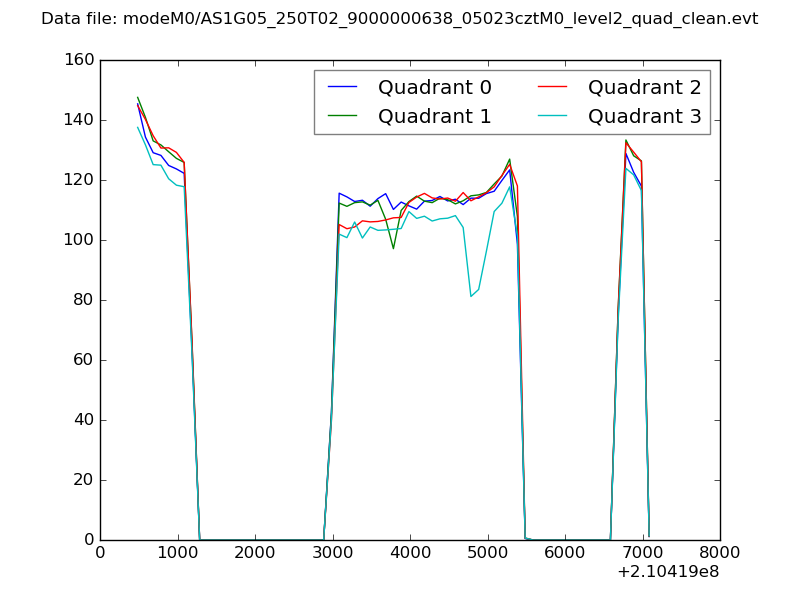
| Quadrant-wise count rates Data is divided into 100 sec bins |
 |
|
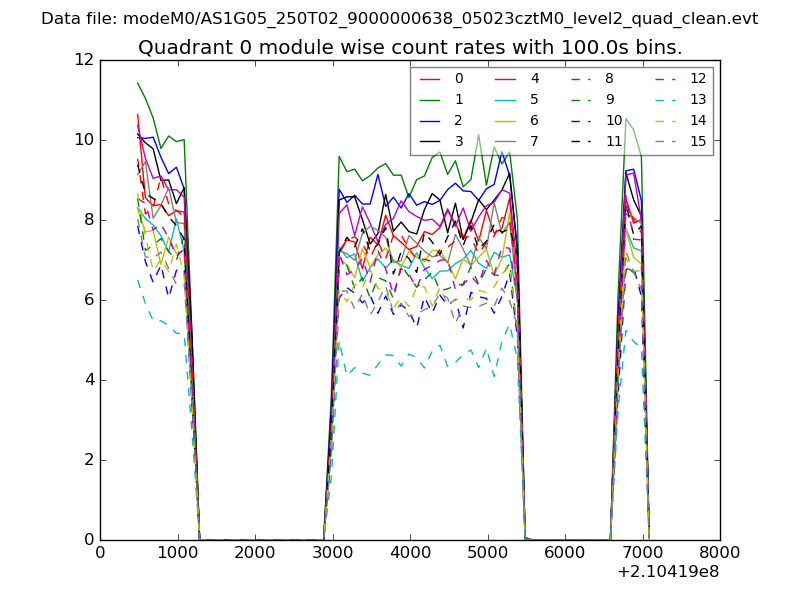
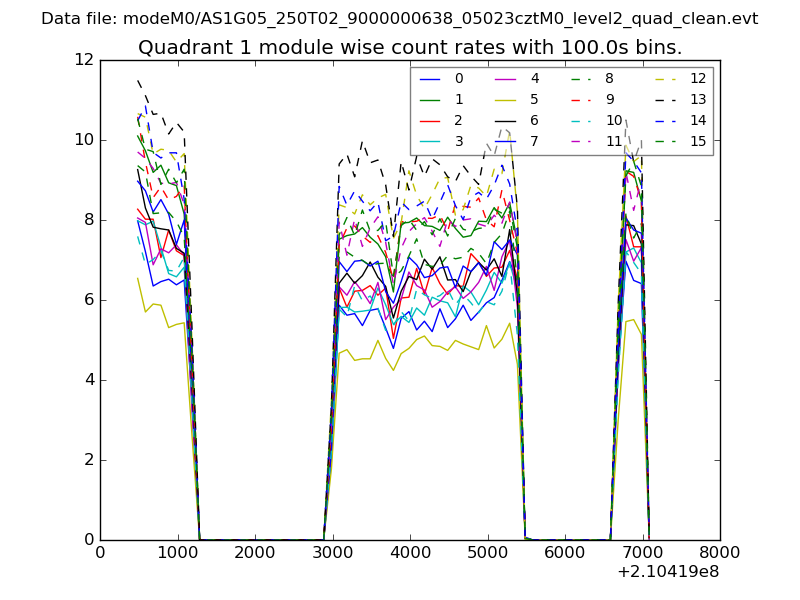
| Module-wise count rates for Quadrant A Data is divided into 100 sec bins |
 |
 |
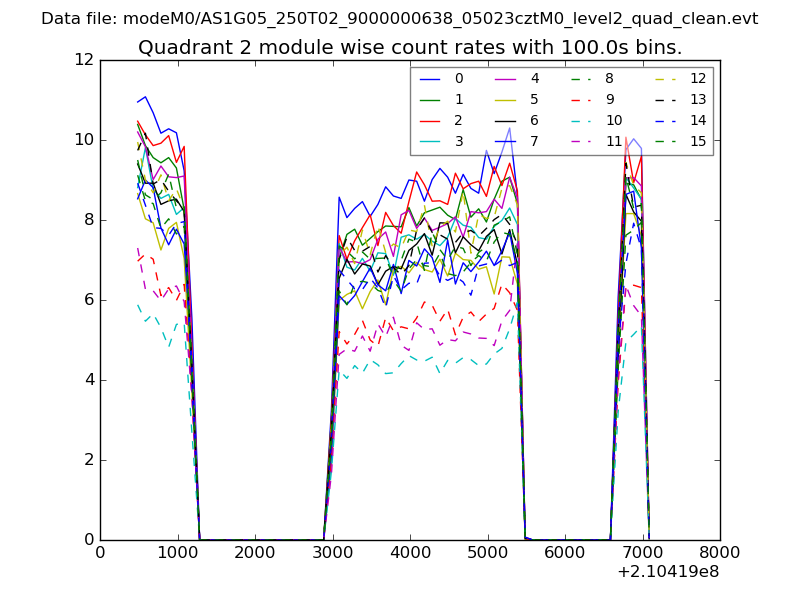
| Module-wise count rates for Quadrant B Data is divided into 100 sec bins |
 |
 |
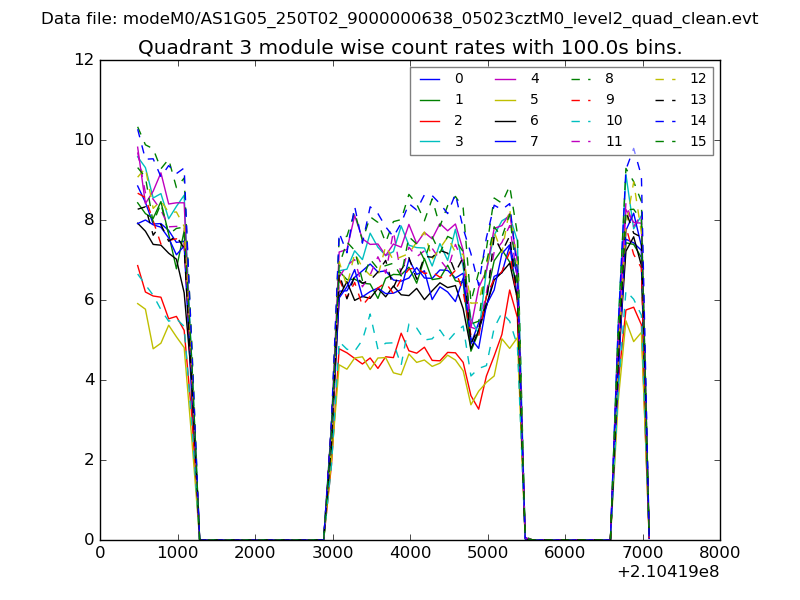
| Module-wise count rates for Quadrant C Data is divided into 100 sec bins |
 |
 |
| Module-wise count rates for Quadrant D Data is divided into 100 sec bins |
 |
 |
| Parameter | Plot |
|---|---|
| CZT HV Monitor | 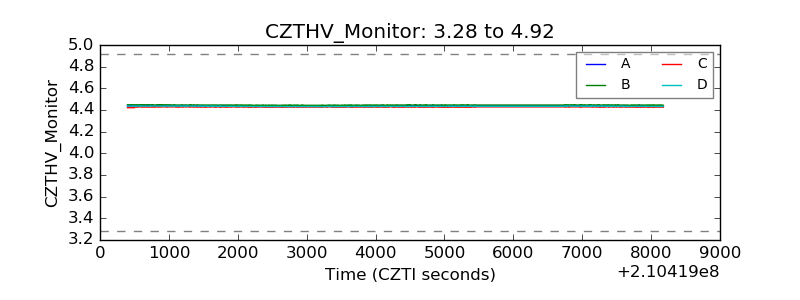 |
| D_VDD |  |
| Temperature 1 | 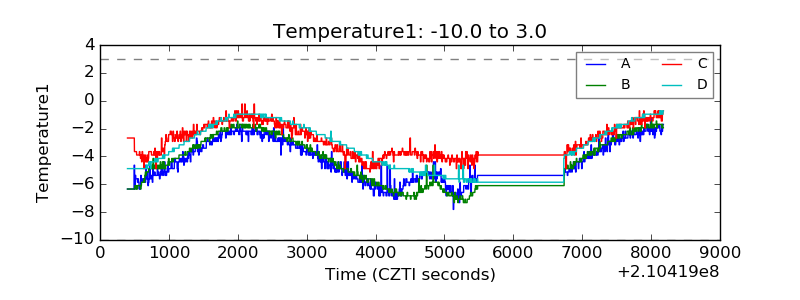 |
| Veto HV Monitor | 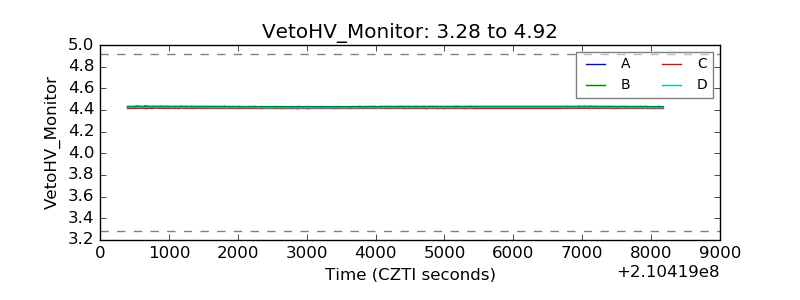 |
| Veto LLD | 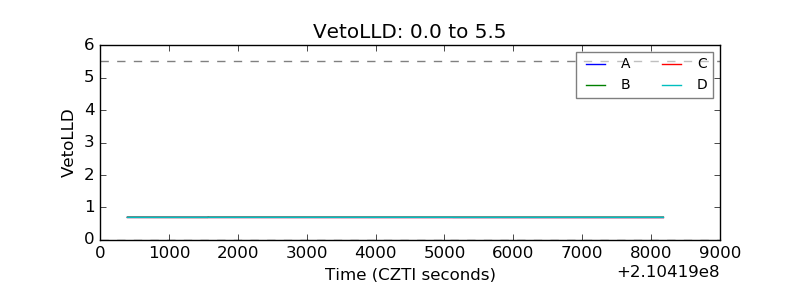 |
| Alpha Counter | 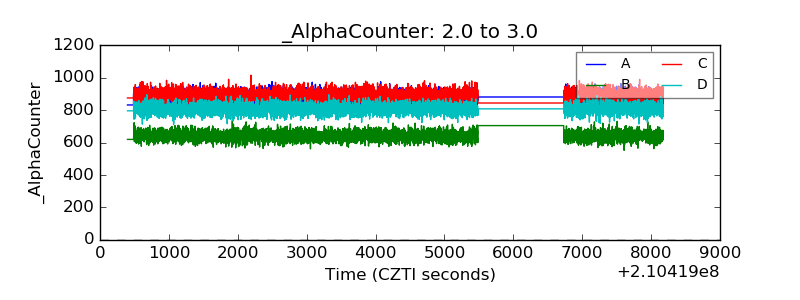 |
| _CPM_Rate | 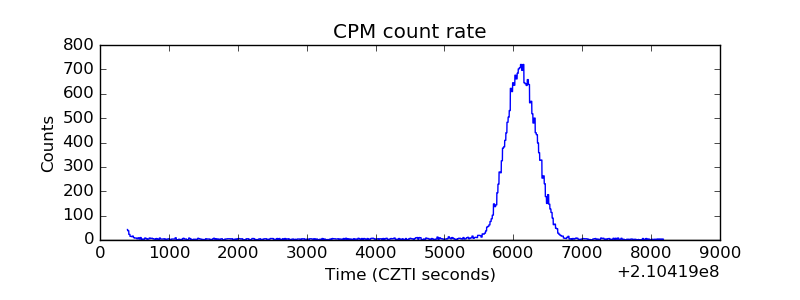 |
| CZT Counter | 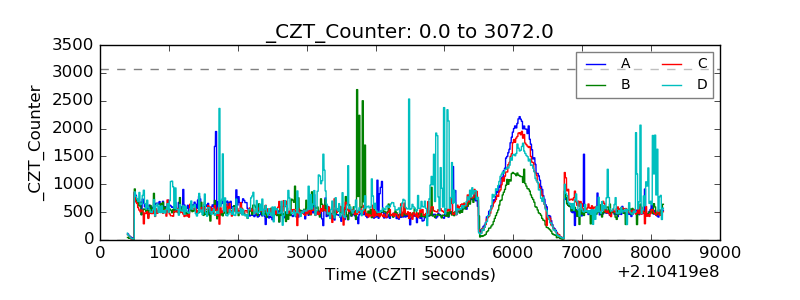 |
| +2.5 Volts monitor |  |
| +5 Volts monitor |  |
| _ROLL_ROT | 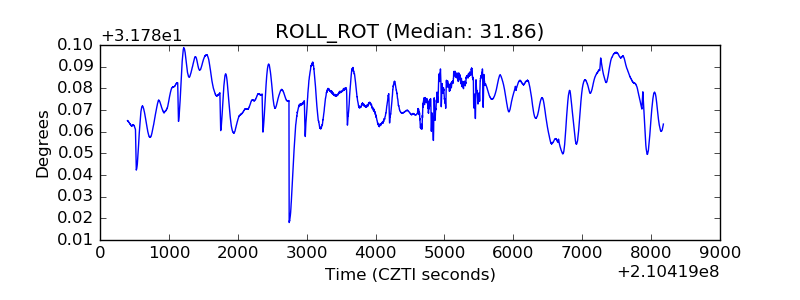 |
| _Roll_DEC | 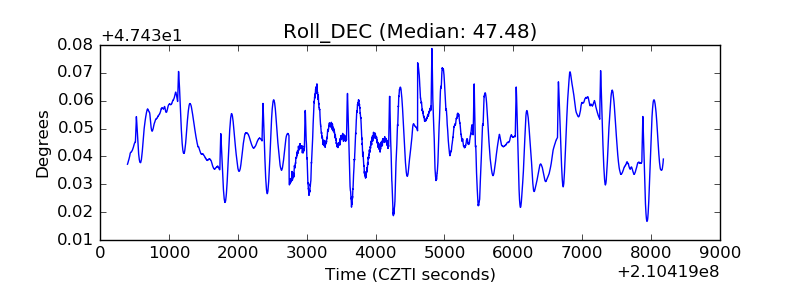 |
| _Roll_RA | 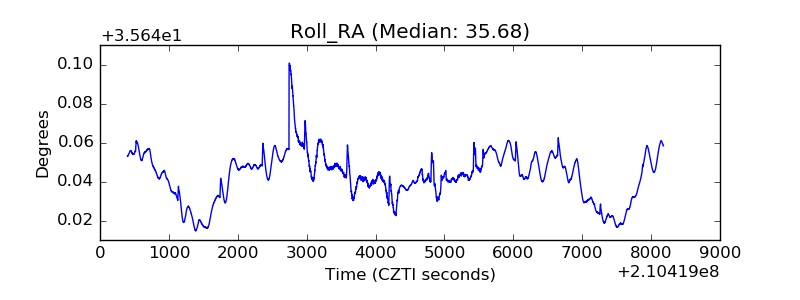 |
| Veto Counter | 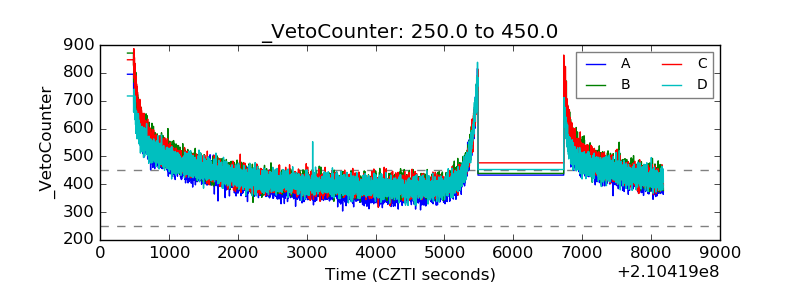 |