| Param | Original file | Final file |
|---|---|---|
| Filename | modeM0/AS1G05_250T02_9000000638_05024cztM0_level2.evt | modeM0/AS1G05_250T02_9000000638_05024cztM0_level2_quad_clean.evt |
| Size (bytes) | 491,054,400 | 64,491,840 |
| Size | 468.3 MB | 61.5 MB |
| Events in quadrant A | 3,292,332 | 375,615 |
| Events in quadrant B | 3,354,121 | 377,166 |
| Events in quadrant C | 3,518,301 | 373,560 |
| Events in quadrant D | 4,249,787 | 356,948 |
| Mode M9 | |||
|---|---|---|---|
| Quadrant | BADHDUFLAG | Total packets | Discarded packets |
| A | 0 | 12 | 0 |
| B | 0 | 12 | 0 |
| C | 0 | 12 | 0 |
| D | 0 | 13 | 0 |
| Mode SS | |||
|---|---|---|---|
| Quadrant | BADHDUFLAG | Total packets | Discarded packets |
| A | 0 | 136 | 0 |
| B | 0 | 136 | 0 |
| C | 0 | 136 | 0 |
| D | 0 | 136 | 0 |
| Mode M0 | |||
|---|---|---|---|
| Quadrant | BADHDUFLAG | Total packets | Discarded packets |
| A | 0 | 14170 | 3 |
| B | 0 | 14219 | 2 |
| C | 0 | 14568 | 2 |
| D | 0 | 17207 | 2 |
| Quadrant | Total seconds | Saturated seconds | Saturation percentage |
|---|---|---|---|
| A | 6734 | 131 | 1.945352% |
| B | 6734 | 131 | 1.945352% |
| C | 6734 | 113 | 1.678052% |
| D | 6734 | 197 | 2.925453% |
Noise dominated data is calculated using 1-second bins in cleaned event files. If a bin has >2000 counts, and if more than 50% of those come from <1% of pixels, then it is considered to be noise-dominated and hence unusable.
| Quadrant | # 1 sec bins | Bins with >0 counts | Bins with >2000 counts | High rate bins dominated by noise | Noise dominated (total time) | Noise dominated (detector-on time) | Marked lightcurve |
|---|---|---|---|---|---|---|---|
| A | 7804 | 6735 | 6 | 6 | 0.08% | 0.09% | 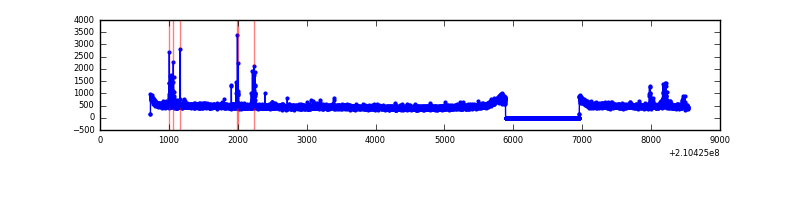 |
| B | 7804 | 6735 | 1 | 1 | 0.01% | 0.01% | 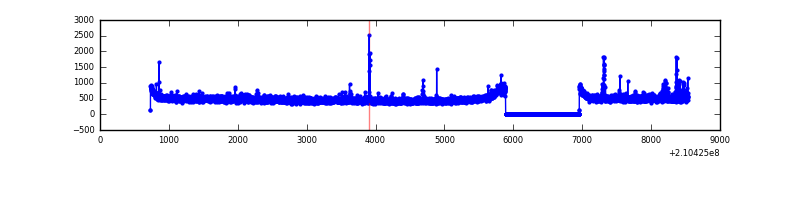 |
| C | 7804 | 6735 | 0 | 0 | 0.00% | 0.00% | 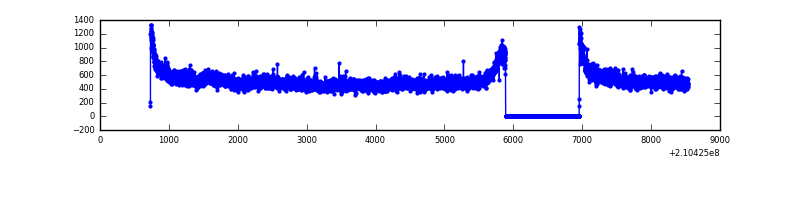 |
| D | 7804 | 6735 | 54 | 54 | 0.69% | 0.80% |  |
Top three noisy pixels from each quadrant. If the there are fewer than three noisy pixels in the level2.evt file, extra rows are filled as -1
| Pixel properties | Quadrant properties | ||||||
|---|---|---|---|---|---|---|---|
| Quadrant | DetID | PixID | Counts | Sigma | Mean | Median | Sigma |
| A | 4 | 2 | 62938 | 371.55 | 824 | 806 | 167.2 |
| A | 0 | 50 | 36851 | 215.55 | 824 | 806 | 167.2 |
| A | 0 | 247 | 10222 | 56.31 | 824 | 806 | 167.2 |
| B | 15 | 204 | 73495 | 464.22 | 825 | 805 | 156.6 |
| B | 0 | 219 | 40238 | 251.83 | 825 | 805 | 156.6 |
| B | 15 | 54 | 35351 | 220.62 | 825 | 805 | 156.6 |
| C | 1 | 16 | 387044 | 2101.92 | 793 | 796 | 183.8 |
| C | 8 | 128 | 18164 | 94.51 | 793 | 796 | 183.8 |
| C | 8 | 112 | 8326 | 40.98 | 793 | 796 | 183.8 |
| D | 12 | 227 | 546978 | 2828.26 | 791 | 765 | 193.1 |
| D | 13 | 235 | 258677 | 1335.46 | 791 | 765 | 193.1 |
| D | 2 | 136 | 107464 | 552.48 | 791 | 765 | 193.1 |
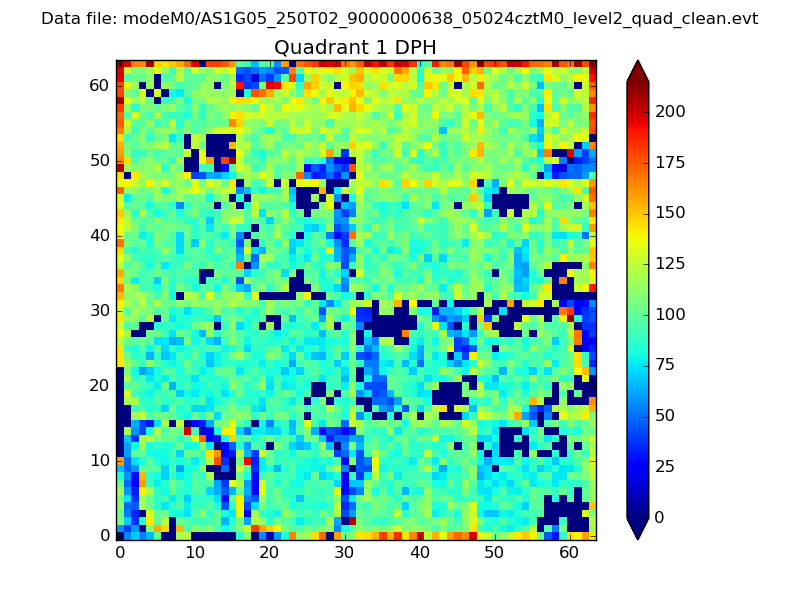
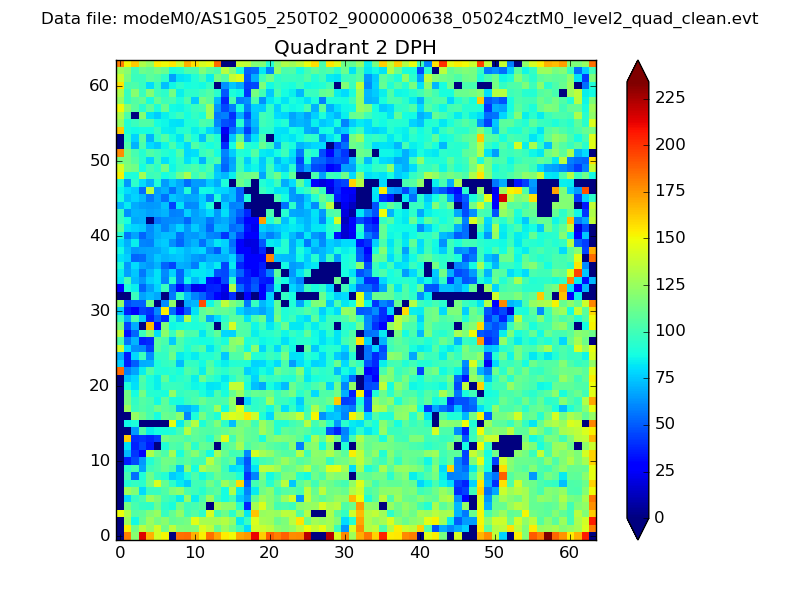
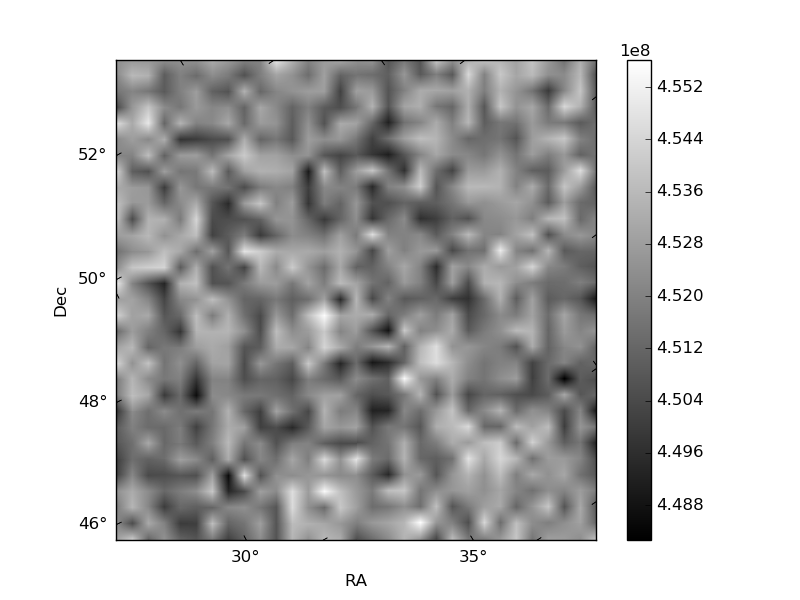
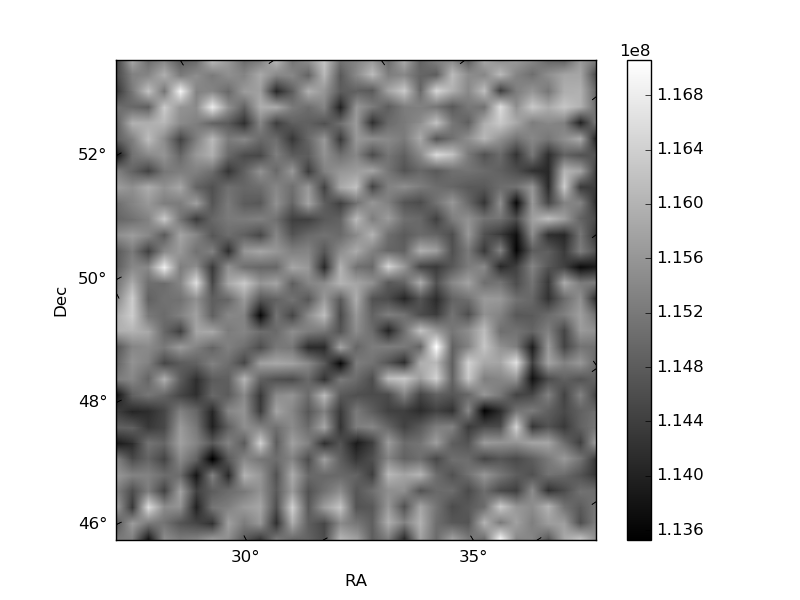
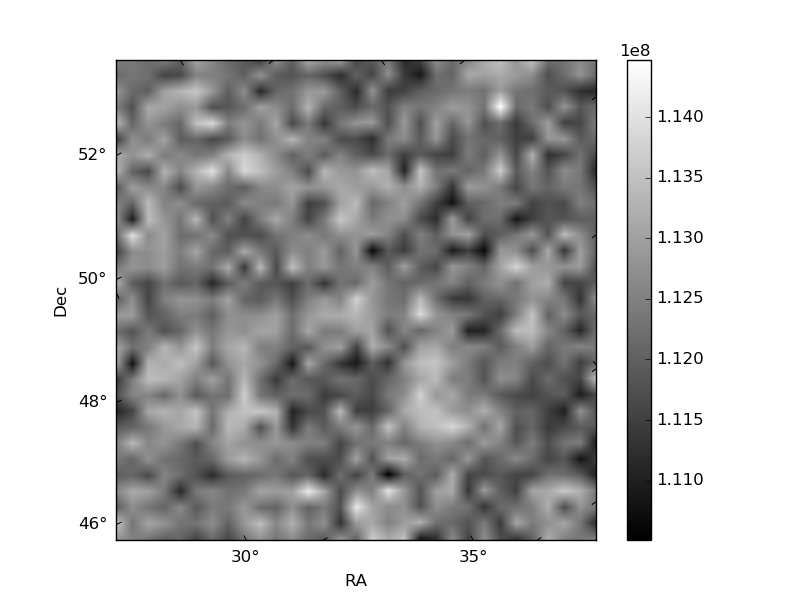
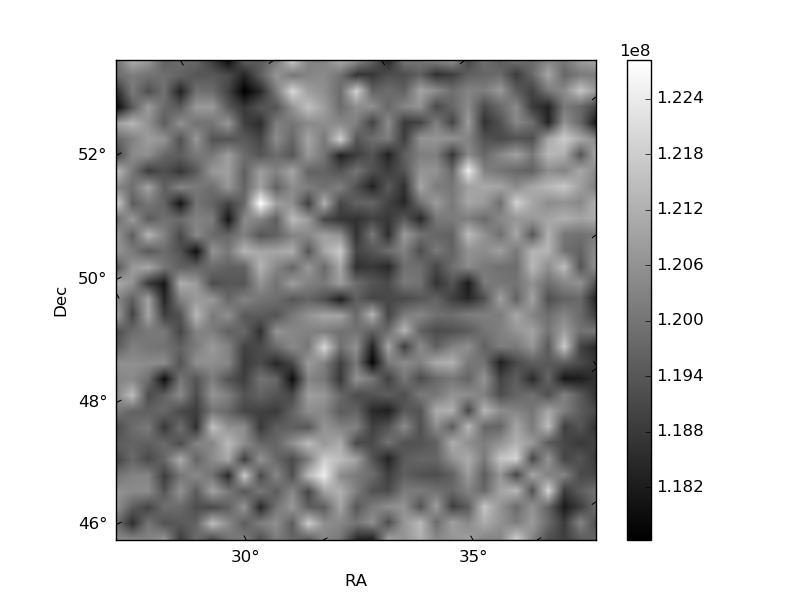
Histogram calculated using DETX and DETY for each event in the final _common_clean file
| Quadrant A | 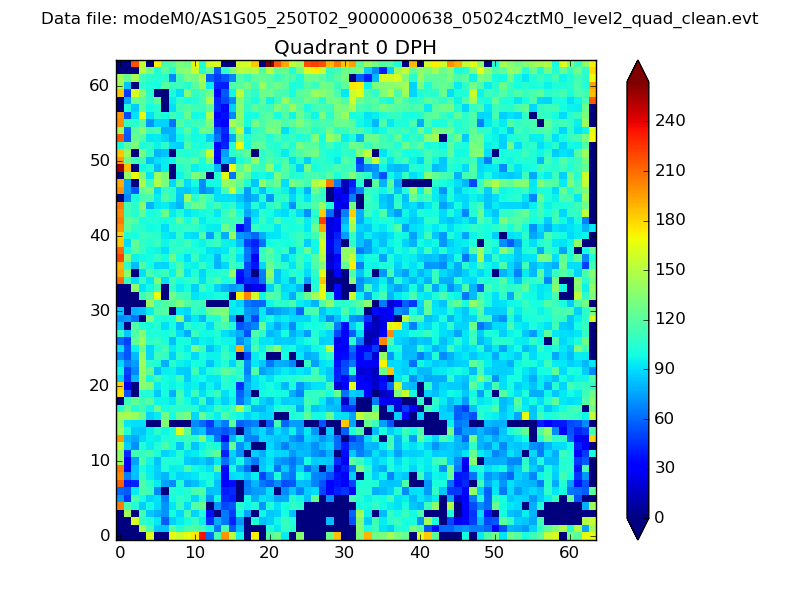 |
 |
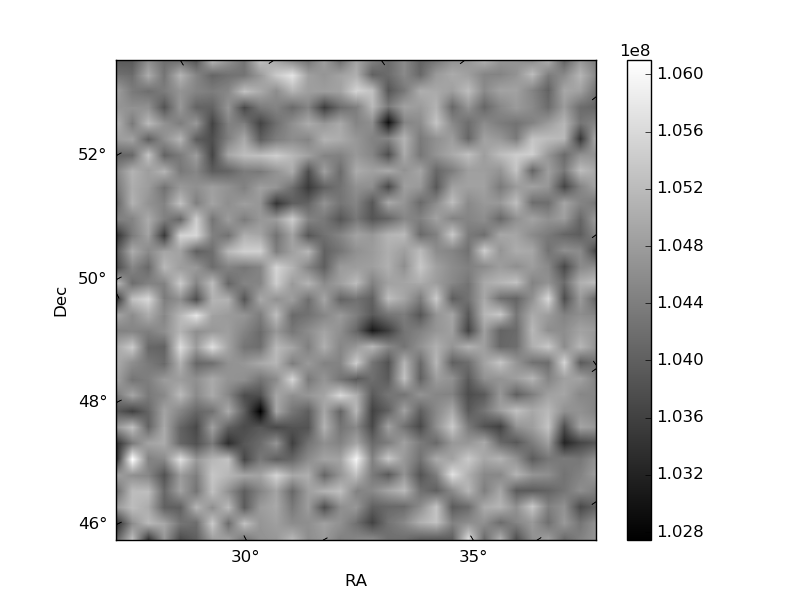
Quadrant B |
|---|---|---|---|
| Quadrant D | 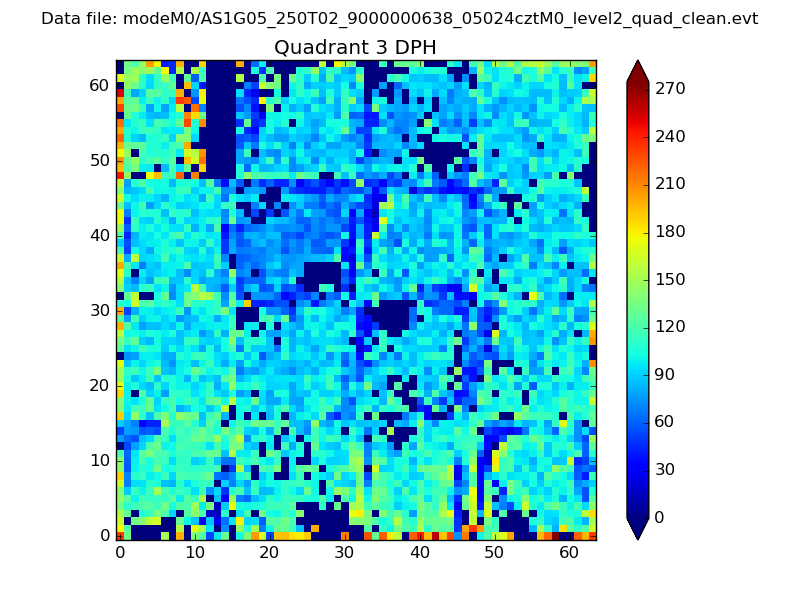 |
 |
Quadrant C |
| Plot type | Count rate plots | Images |
|---|---|---|
| Comparison with Poisson distribution Blue bars denote a histogram of data divided into 1 sec bins. Red curve is a Poisson curve with rate = median count rate of data. |
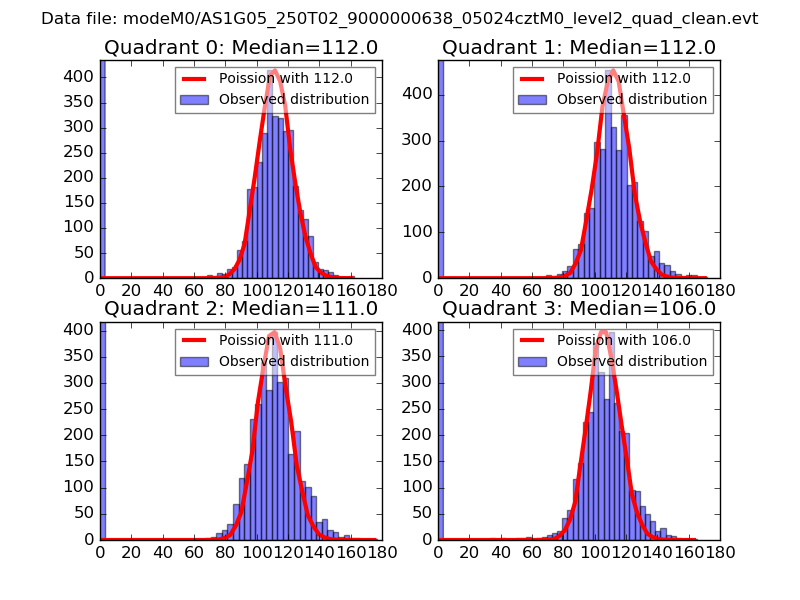 |
 |
| Quadrant-wise count rates Data is divided into 100 sec bins |
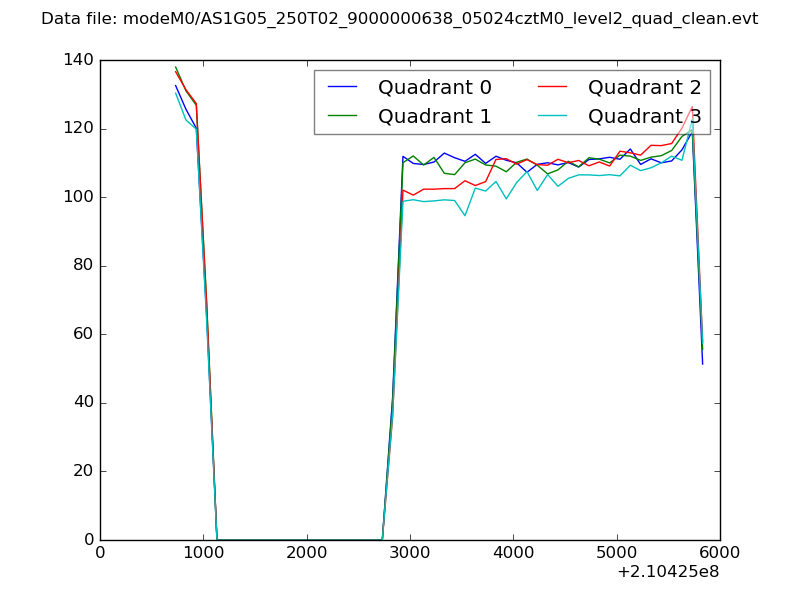 |
|
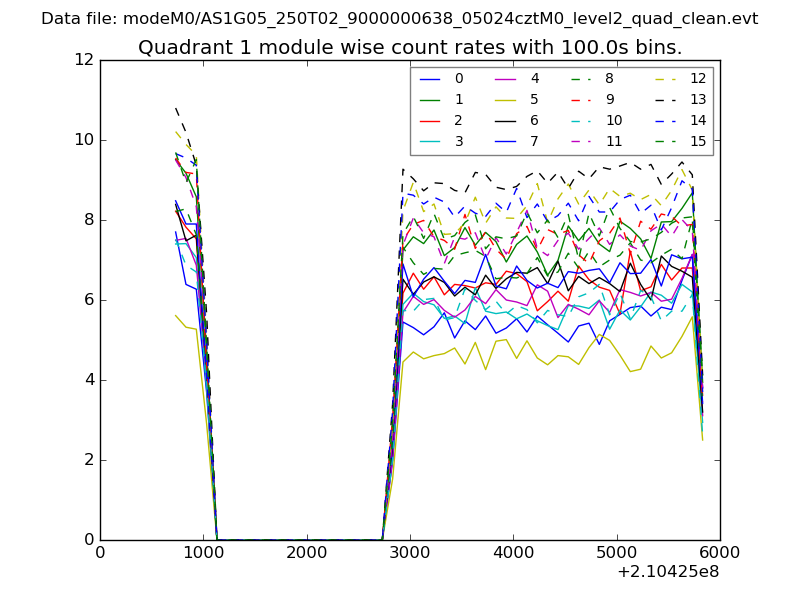
| Module-wise count rates for Quadrant A Data is divided into 100 sec bins |
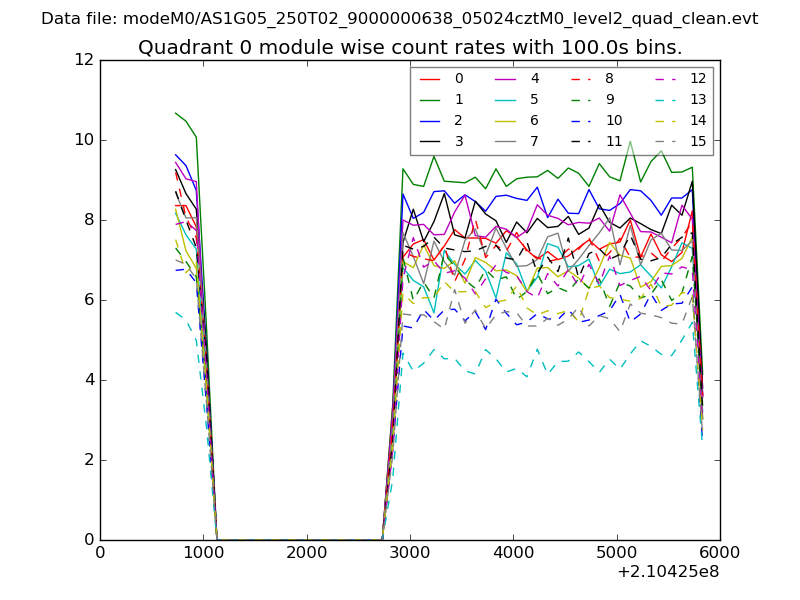 |
 |
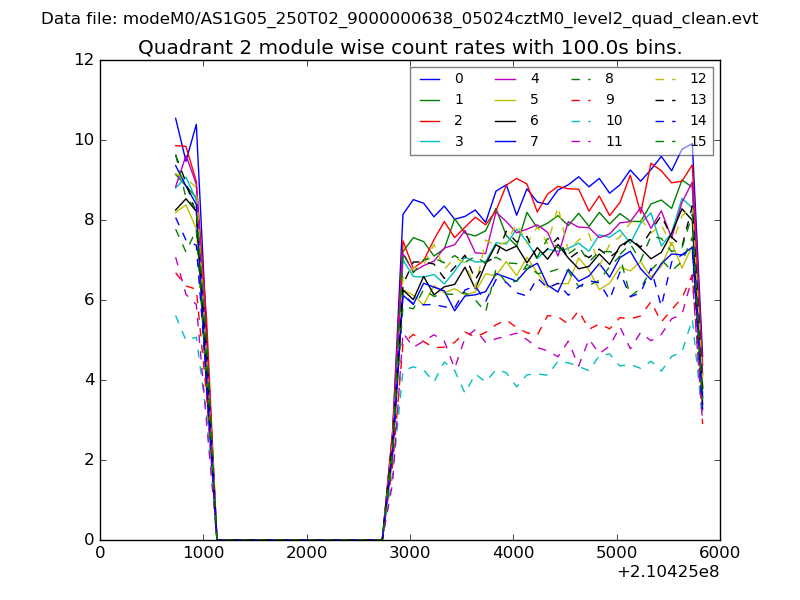
| Module-wise count rates for Quadrant B Data is divided into 100 sec bins |
 |
 |
| Module-wise count rates for Quadrant C Data is divided into 100 sec bins |
 |
 |
| Module-wise count rates for Quadrant D Data is divided into 100 sec bins |
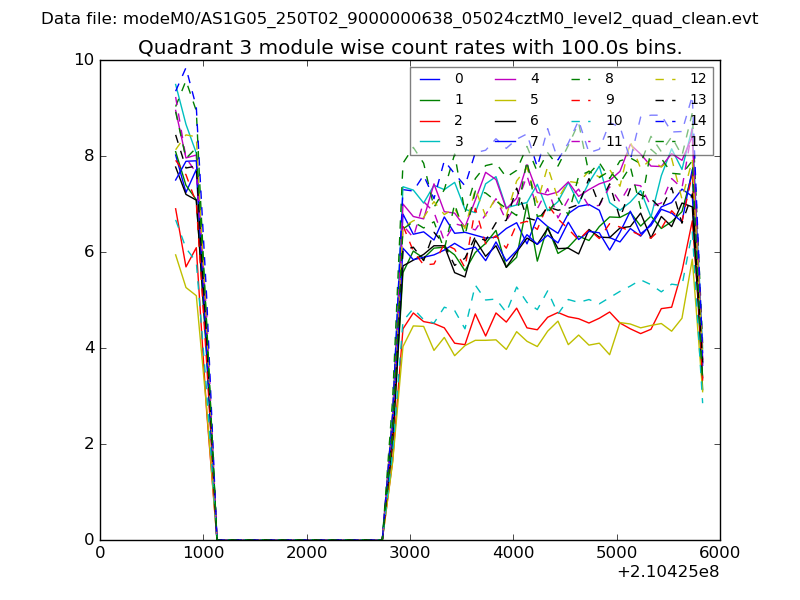 |
 |
| Parameter | Plot |
|---|---|
| CZT HV Monitor | 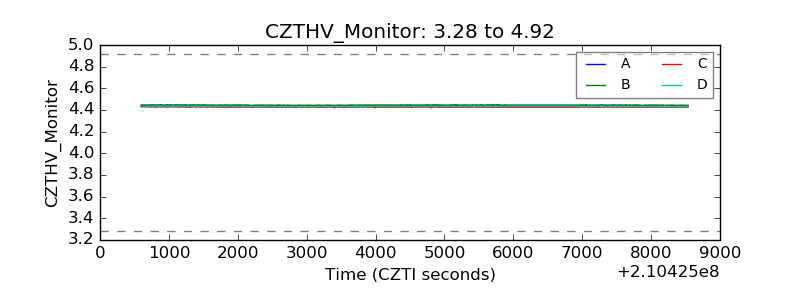 |
| D_VDD | 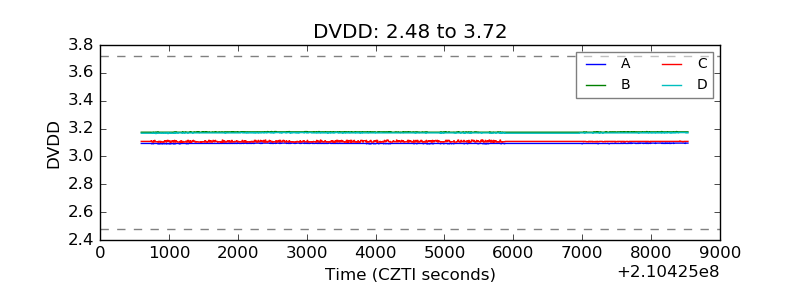 |
| Temperature 1 | 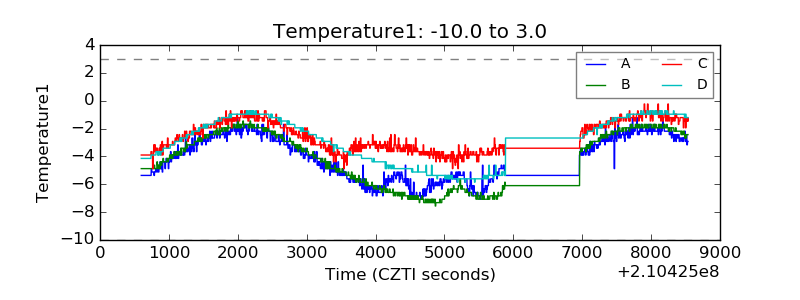 |
| Veto HV Monitor | 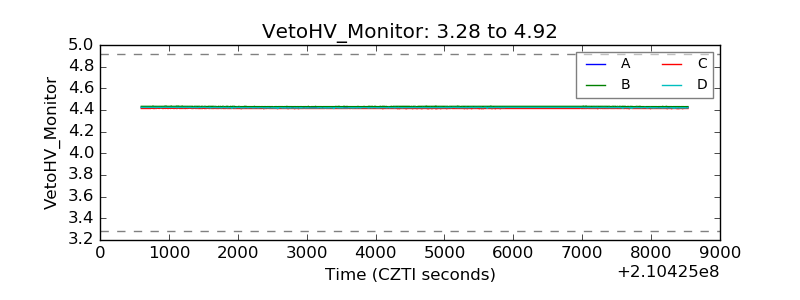 |
| Veto LLD | 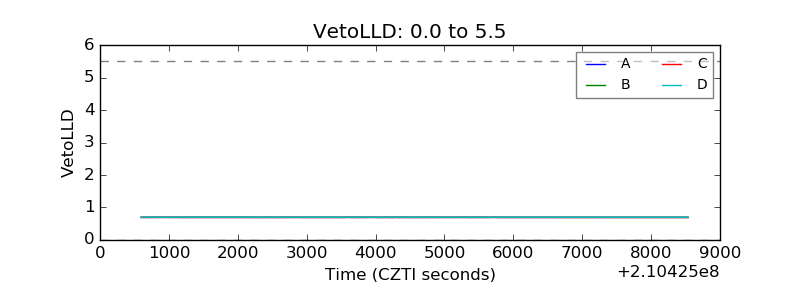 |
| Alpha Counter | 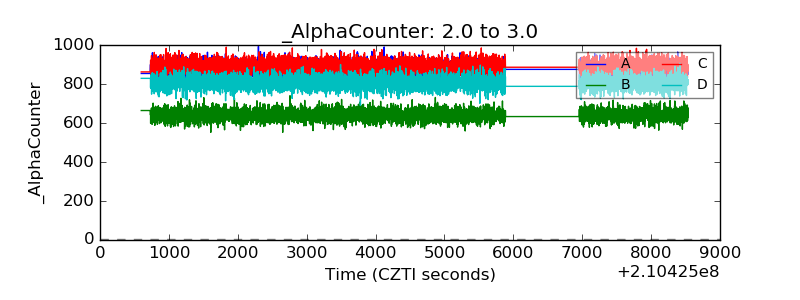 |
| _CPM_Rate | 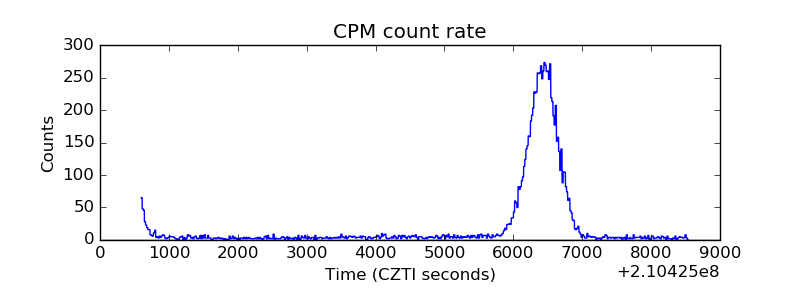 |
| CZT Counter | 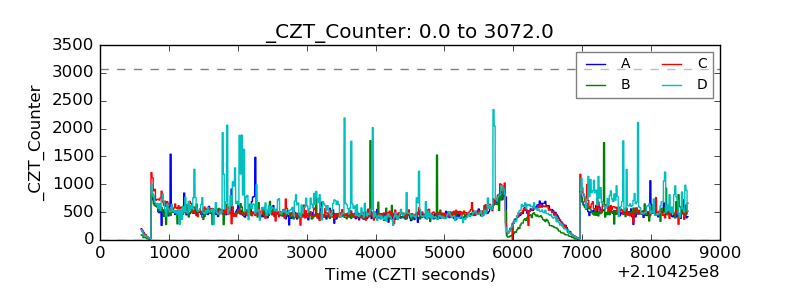 |
| +2.5 Volts monitor | 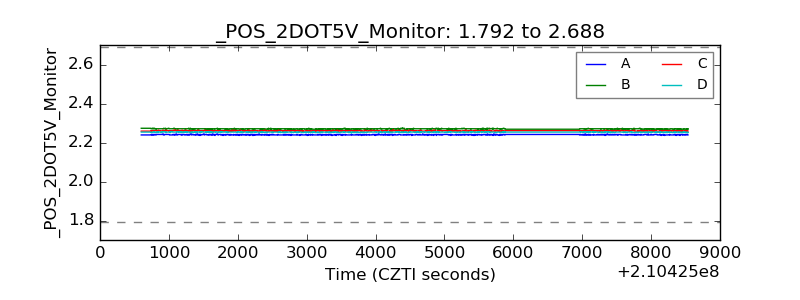 |
| +5 Volts monitor | 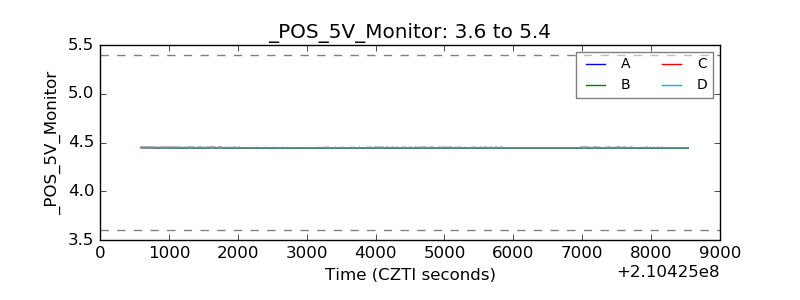 |
| _ROLL_ROT | 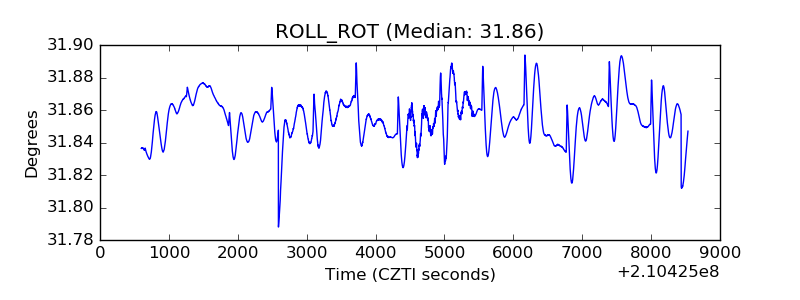 |
| _Roll_DEC | 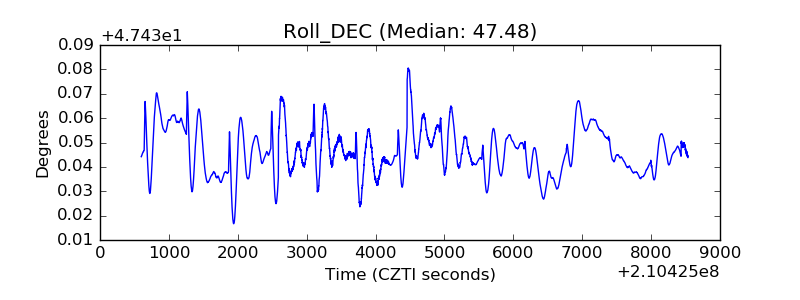 |
| _Roll_RA | 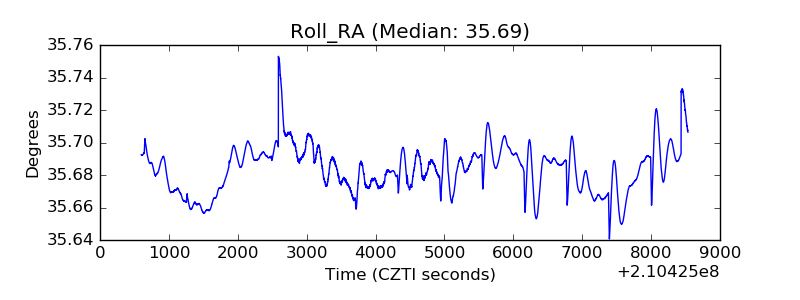 |
| Veto Counter | 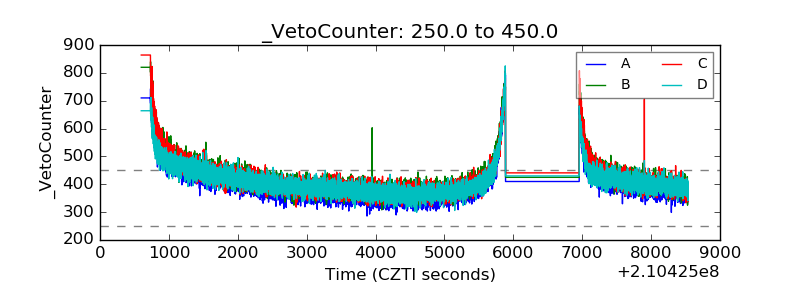 |