| Param | Original file | Final file |
|---|---|---|
| Filename | modeM0/AS1G05_250T02_9000000638_05025cztM0_level2.evt | modeM0/AS1G05_250T02_9000000638_05025cztM0_level2_quad_clean.evt |
| Size (bytes) | 488,456,640 | 68,408,640 |
| Size | 465.8 MB | 65.2 MB |
| Events in quadrant A | 3,300,790 | 403,263 |
| Events in quadrant B | 3,523,472 | 395,813 |
| Events in quadrant C | 3,464,117 | 400,227 |
| Events in quadrant D | 4,035,209 | 390,663 |
| Mode M9 | |||
|---|---|---|---|
| Quadrant | BADHDUFLAG | Total packets | Discarded packets |
| A | 0 | 7 | 0 |
| B | 0 | 7 | 0 |
| C | 0 | 7 | 0 |
| D | 0 | 8 | 0 |
| Mode SS | |||
|---|---|---|---|
| Quadrant | BADHDUFLAG | Total packets | Discarded packets |
| A | 0 | 142 | 0 |
| B | 0 | 142 | 0 |
| C | 0 | 142 | 0 |
| D | 0 | 142 | 0 |
| Mode M0 | |||
|---|---|---|---|
| Quadrant | BADHDUFLAG | Total packets | Discarded packets |
| A | 0 | 14442 | 3 |
| B | 0 | 14994 | 2 |
| C | 0 | 14670 | 2 |
| D | 0 | 16753 | 2 |
| Quadrant | Total seconds | Saturated seconds | Saturation percentage |
|---|---|---|---|
| A | 6901 | 115 | 1.666425% |
| B | 6901 | 132 | 1.912766% |
| C | 6901 | 124 | 1.796841% |
| D | 6901 | 186 | 2.695262% |
Noise dominated data is calculated using 1-second bins in cleaned event files. If a bin has >2000 counts, and if more than 50% of those come from <1% of pixels, then it is considered to be noise-dominated and hence unusable.
| Quadrant | # 1 sec bins | Bins with >0 counts | Bins with >2000 counts | High rate bins dominated by noise | Noise dominated (total time) | Noise dominated (detector-on time) | Marked lightcurve |
|---|---|---|---|---|---|---|---|
| A | 7641 | 6902 | 0 | 0 | 0.00% | 0.00% | 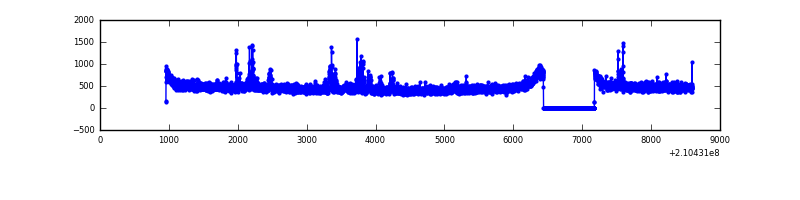 |
| B | 7641 | 6902 | 0 | 0 | 0.00% | 0.00% | 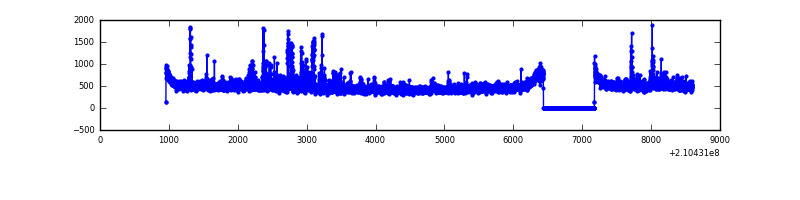 |
| C | 7641 | 6902 | 0 | 0 | 0.00% | 0.00% | 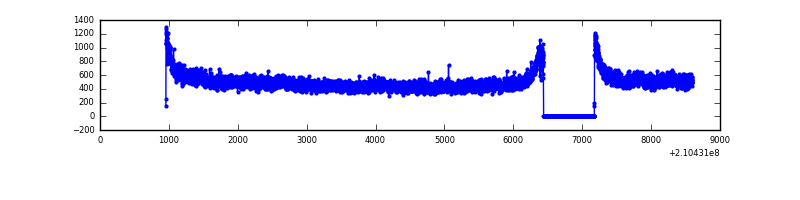 |
| D | 7641 | 6902 | 54 | 54 | 0.71% | 0.78% | 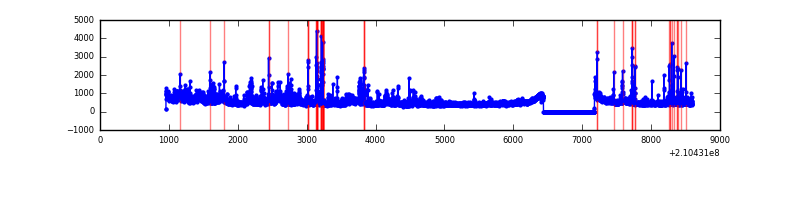 |
Top three noisy pixels from each quadrant. If the there are fewer than three noisy pixels in the level2.evt file, extra rows are filled as -1
| Pixel properties | Quadrant properties | ||||||
|---|---|---|---|---|---|---|---|
| Quadrant | DetID | PixID | Counts | Sigma | Mean | Median | Sigma |
| A | 4 | 2 | 50964 | 299.43 | 821 | 800 | 167.5 |
| A | 0 | 50 | 36861 | 215.25 | 821 | 800 | 167.5 |
| A | 0 | 247 | 28964 | 168.11 | 821 | 800 | 167.5 |
| B | 15 | 204 | 217280 | 1367.81 | 824 | 803 | 158.3 |
| B | 15 | 54 | 41539 | 257.39 | 824 | 803 | 158.3 |
| B | 0 | 219 | 38746 | 239.74 | 824 | 803 | 158.3 |
| C | 1 | 16 | 370041 | 2008.63 | 792 | 794 | 183.8 |
| C | 13 | 61 | 6634 | 31.77 | 792 | 794 | 183.8 |
| C | 14 | 67 | 2521 | 9.39 | 792 | 794 | 183.8 |
| D | 12 | 227 | 502273 | 2574.29 | 795 | 771 | 194.8 |
| D | 13 | 235 | 190097 | 971.84 | 795 | 771 | 194.8 |
| D | 2 | 33 | 121504 | 619.74 | 795 | 771 | 194.8 |
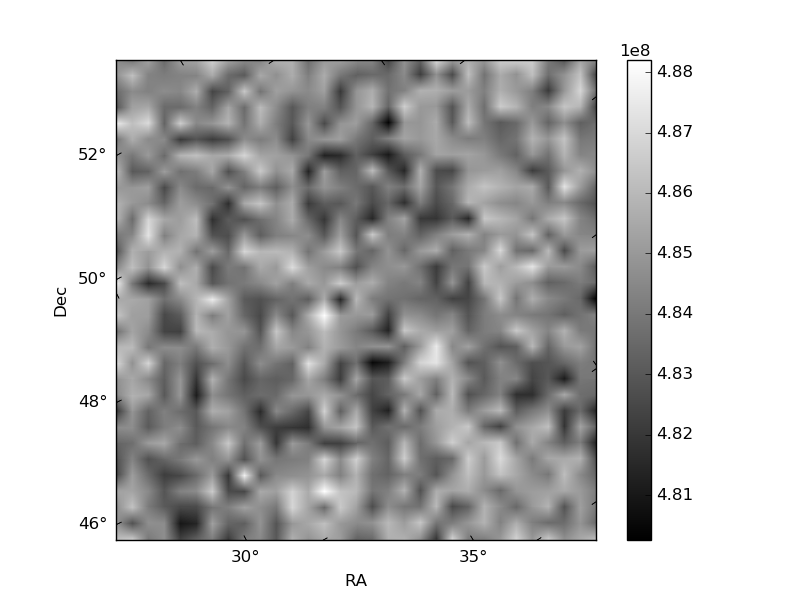
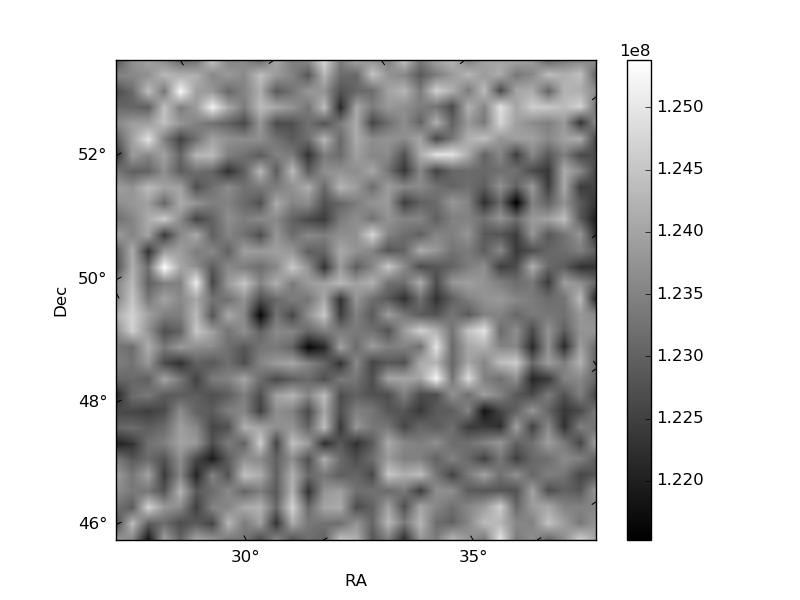
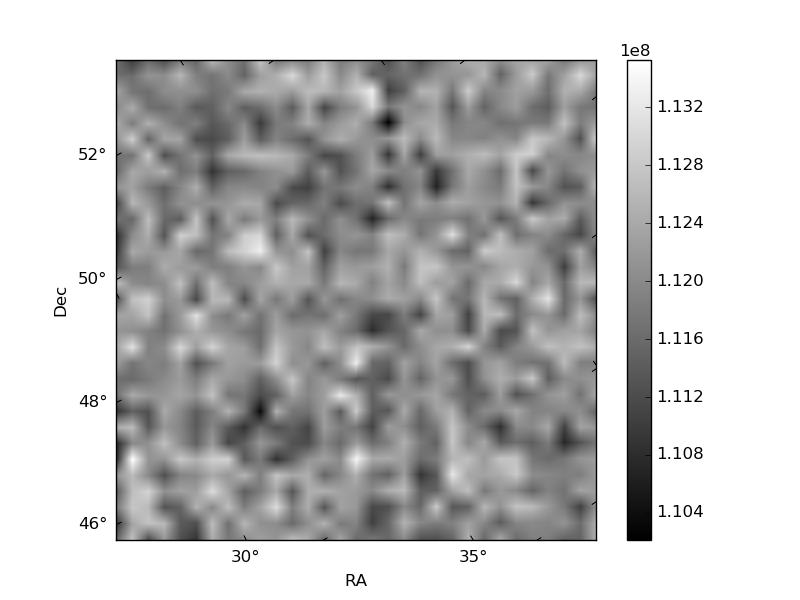
Histogram calculated using DETX and DETY for each event in the final _common_clean file
| Quadrant A | 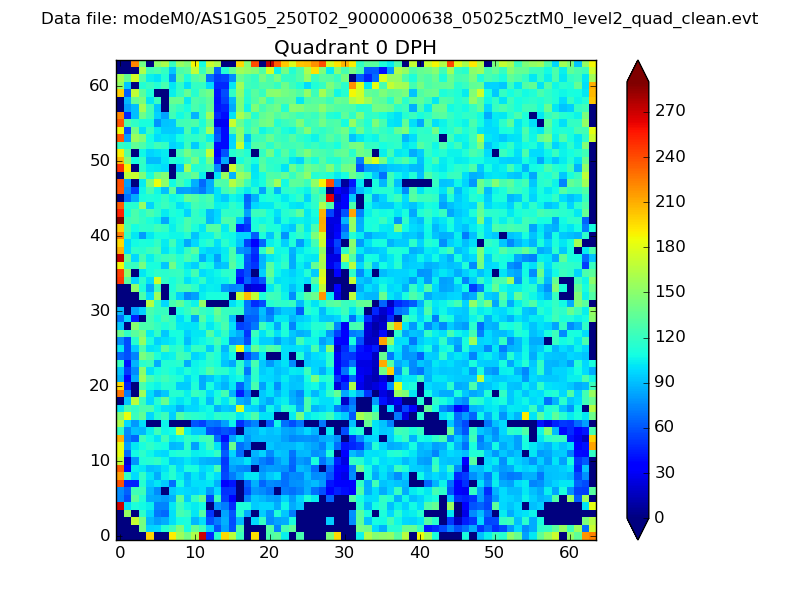 |
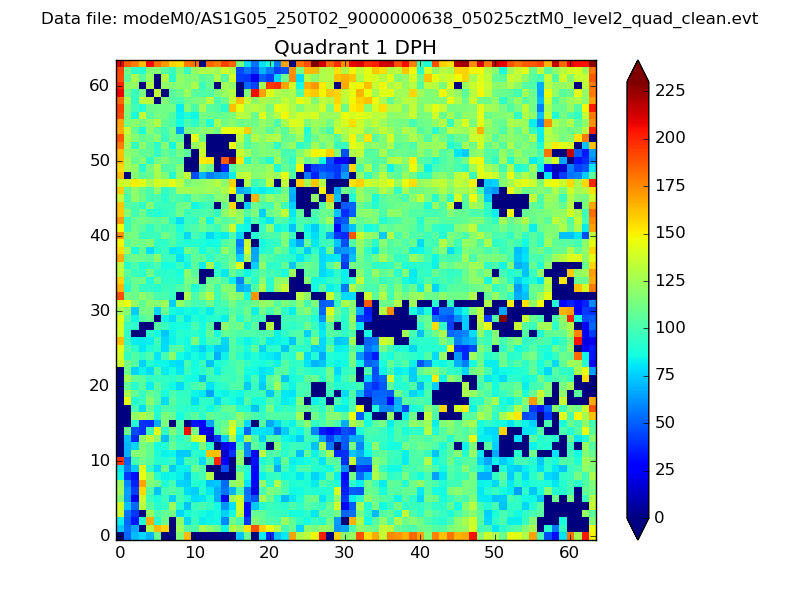 |
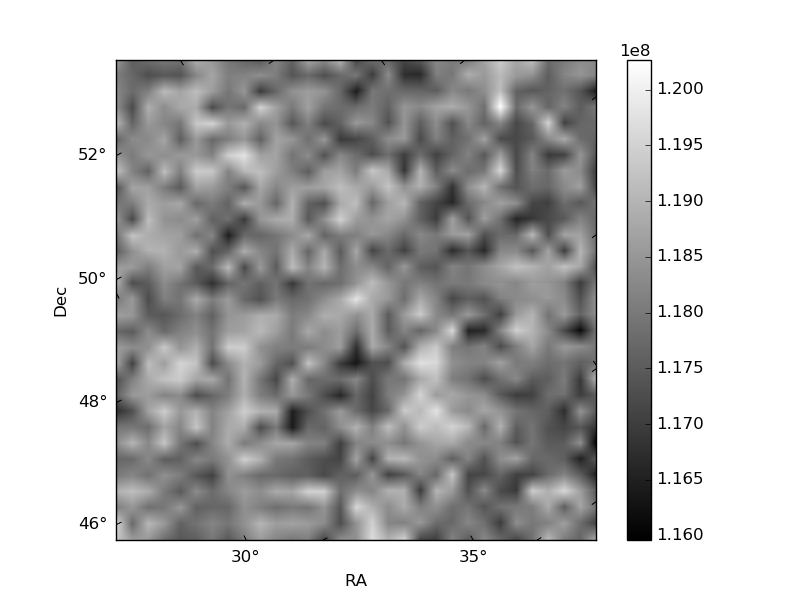
Quadrant B |
|---|---|---|---|
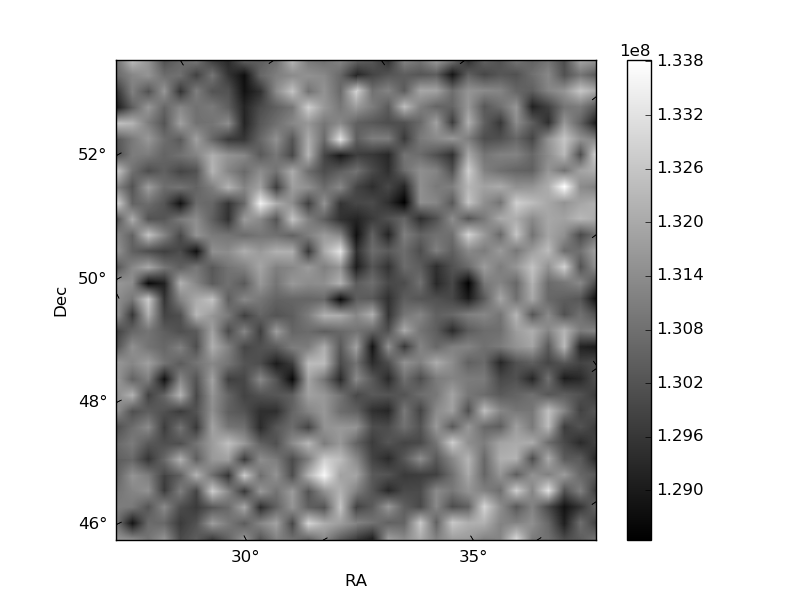
| Quadrant D | 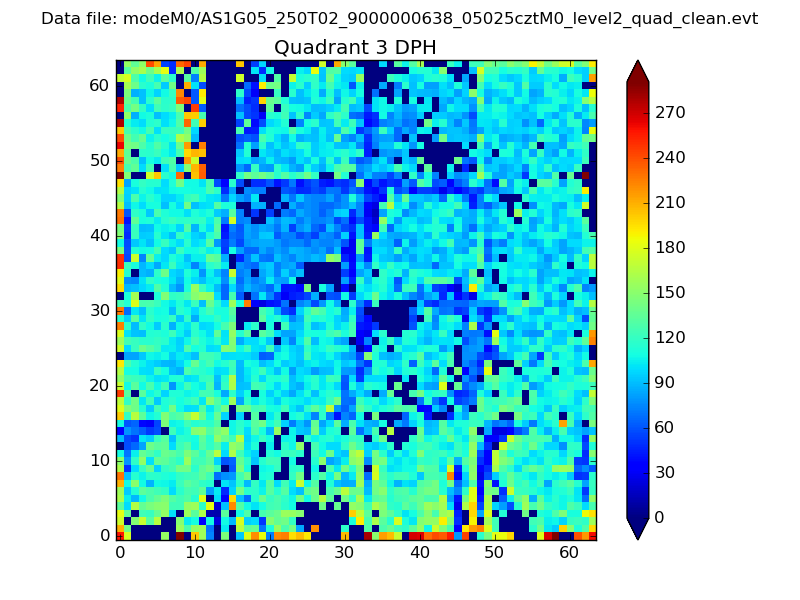 |
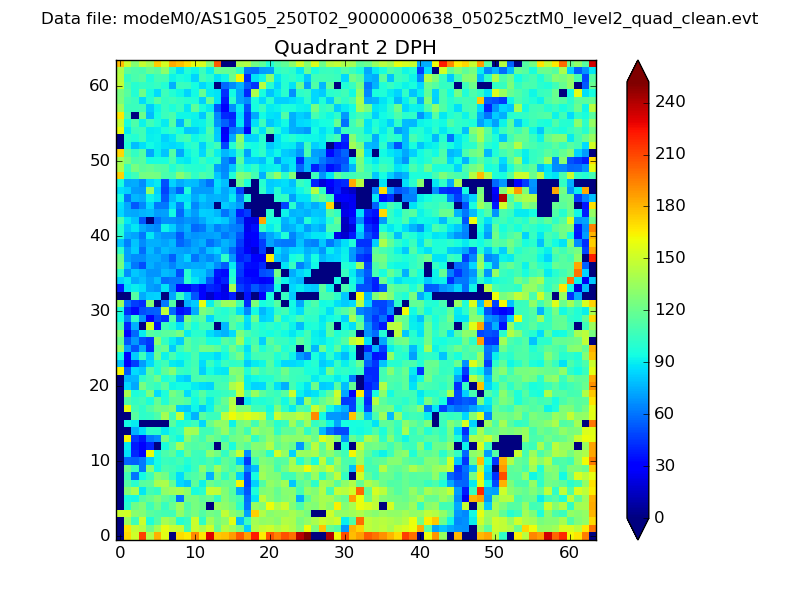 |
Quadrant C |
| Plot type | Count rate plots | Images |
|---|---|---|
| Comparison with Poisson distribution Blue bars denote a histogram of data divided into 1 sec bins. Red curve is a Poisson curve with rate = median count rate of data. |
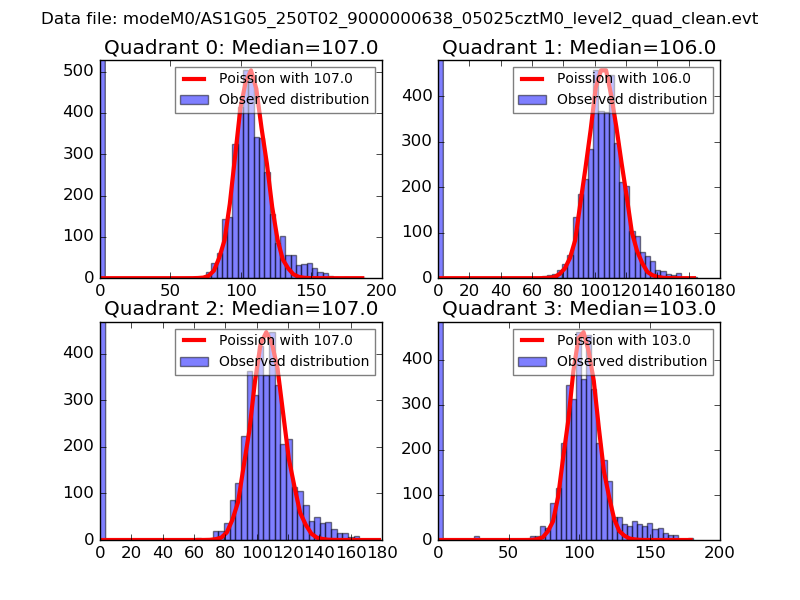 |
 |
| Quadrant-wise count rates Data is divided into 100 sec bins |
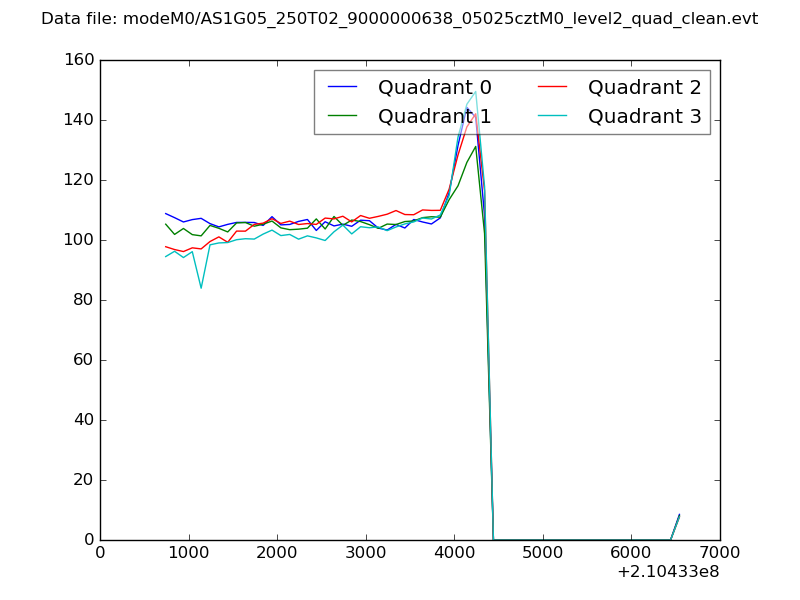 |
|
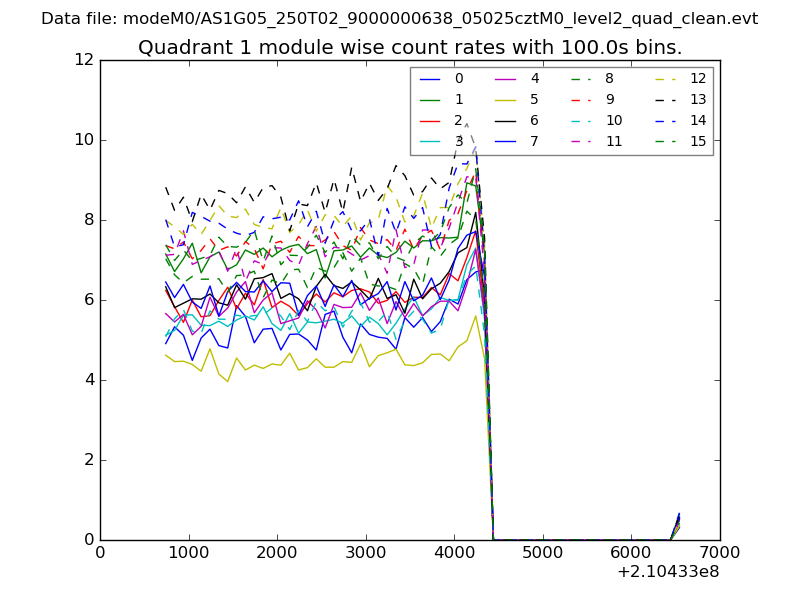
| Module-wise count rates for Quadrant A Data is divided into 100 sec bins |
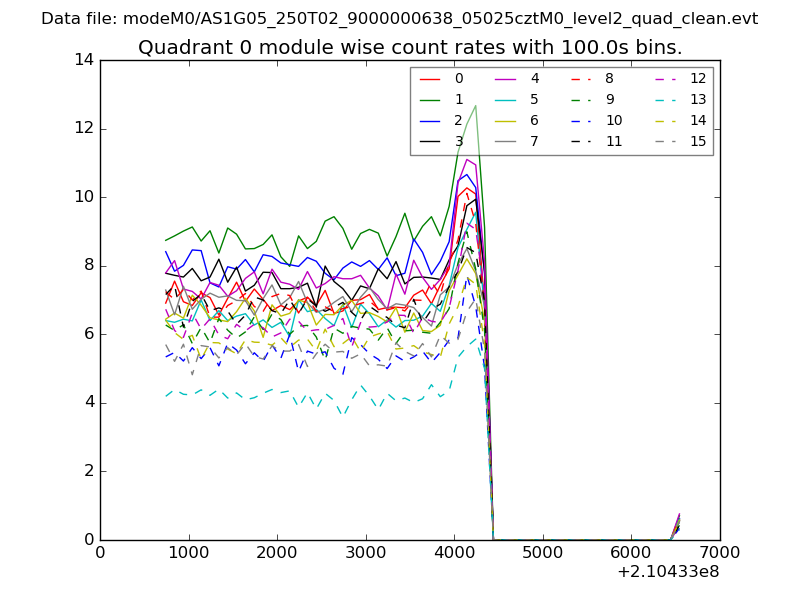 |
 |
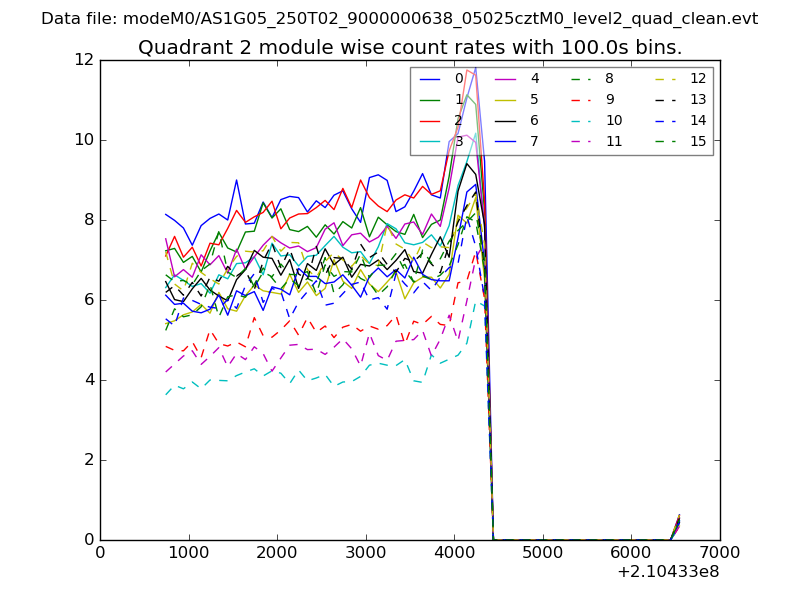
| Module-wise count rates for Quadrant B Data is divided into 100 sec bins |
 |
 |
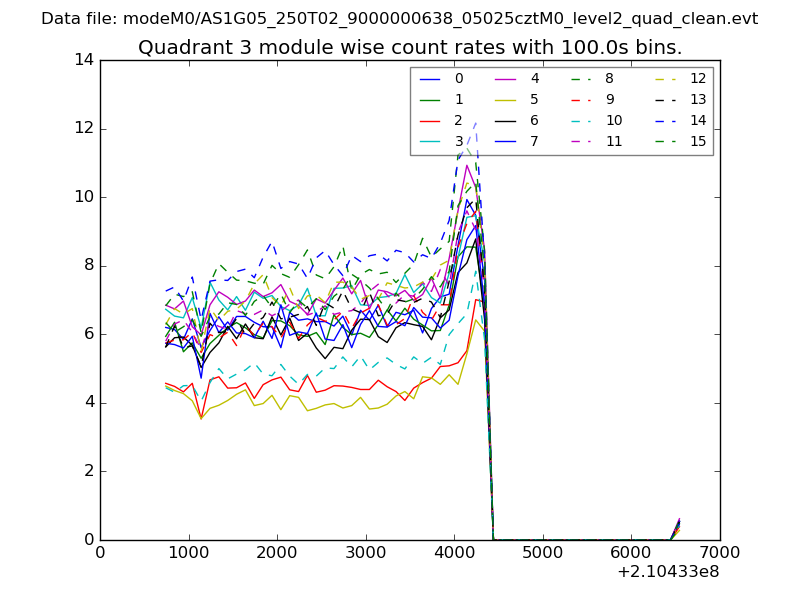
| Module-wise count rates for Quadrant C Data is divided into 100 sec bins |
 |
 |
| Module-wise count rates for Quadrant D Data is divided into 100 sec bins |
 |
 |
| Parameter | Plot |
|---|---|
| CZT HV Monitor | 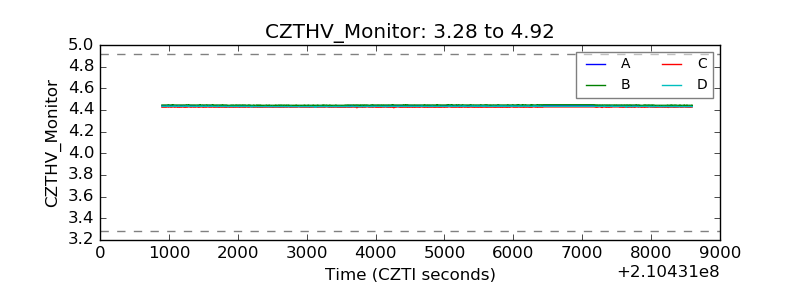 |
| D_VDD |  |
| Temperature 1 | 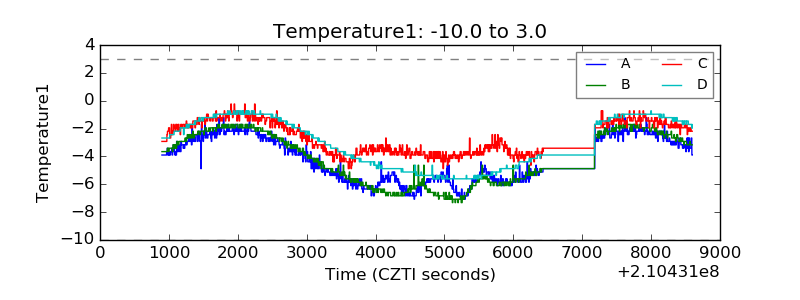 |
| Veto HV Monitor | 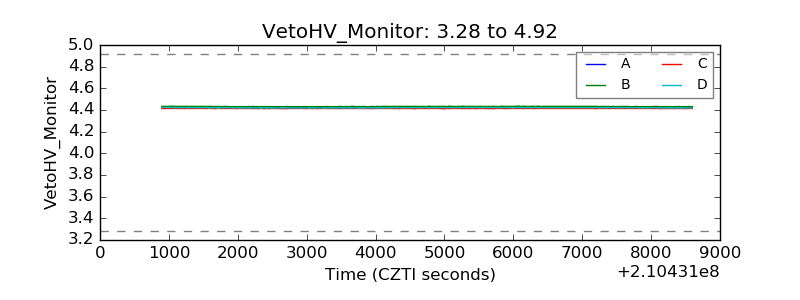 |
| Veto LLD | 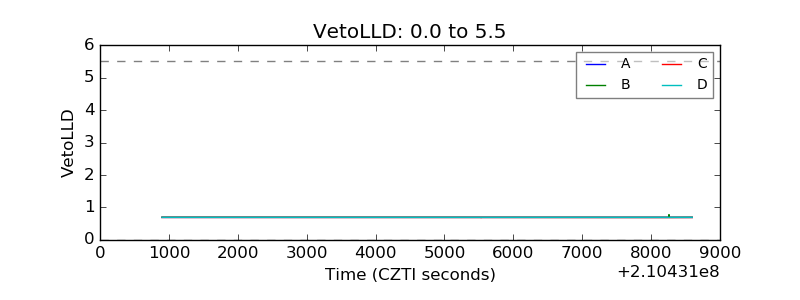 |
| Alpha Counter | 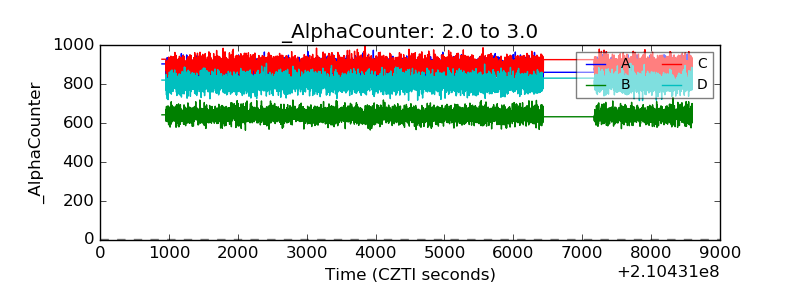 |
| _CPM_Rate | 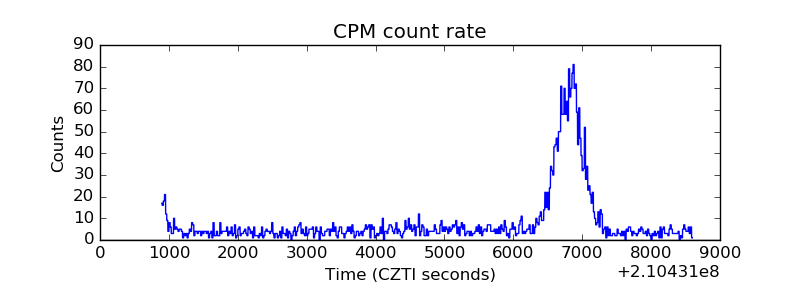 |
| CZT Counter | 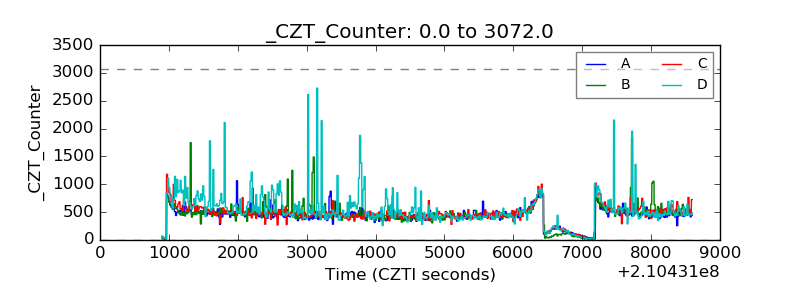 |
| +2.5 Volts monitor |  |
| +5 Volts monitor |  |
| _ROLL_ROT | 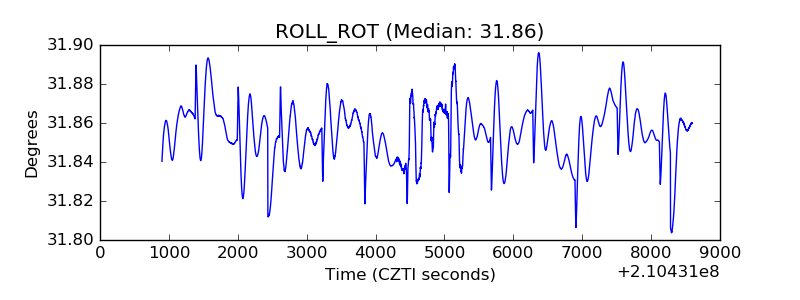 |
| _Roll_DEC | 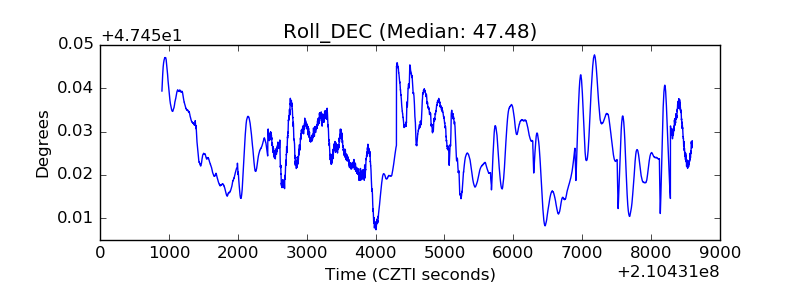 |
| _Roll_RA | 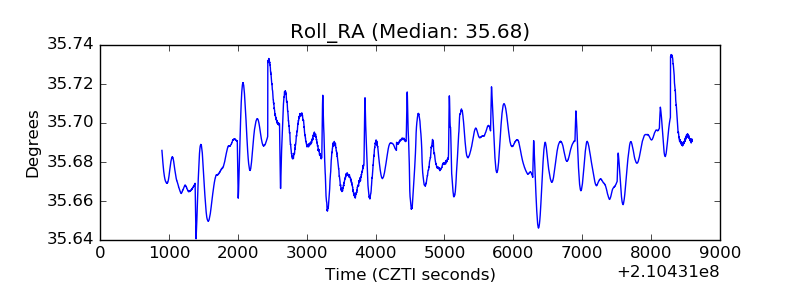 |
| Veto Counter | 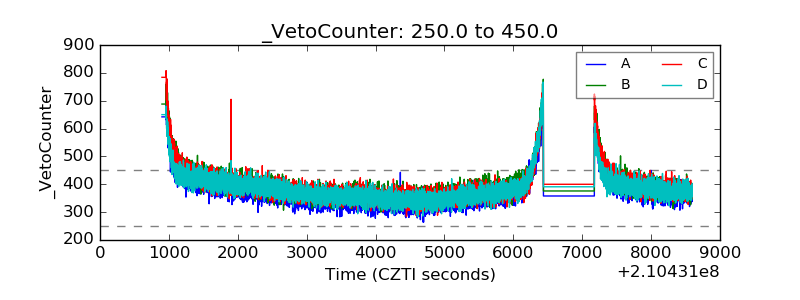 |