| Param | Original file | Final file |
|---|---|---|
| Filename | modeM0/AS1G05_250T02_9000000638_05028cztM0_level2.evt | modeM0/AS1G05_250T02_9000000638_05028cztM0_level2_quad_clean.evt |
| Size (bytes) | 504,751,680 | 87,442,560 |
| Size | 481.4 MB | 83.4 MB |
| Events in quadrant A | 3,365,880 | 539,859 |
| Events in quadrant B | 3,531,187 | 541,781 |
| Events in quadrant C | 3,195,859 | 542,808 |
| Events in quadrant D | 4,697,087 | 514,758 |
| Mode M9 | |||
|---|---|---|---|
| Quadrant | BADHDUFLAG | Total packets | Discarded packets |
| A | 0 | 4 | 0 |
| B | 0 | 4 | 0 |
| C | 0 | 4 | 0 |
| D | 0 | 4 | 0 |
| Mode SS | |||
|---|---|---|---|
| Quadrant | BADHDUFLAG | Total packets | Discarded packets |
| A | 0 | 146 | 0 |
| B | 0 | 146 | 0 |
| C | 0 | 146 | 0 |
| D | 0 | 146 | 0 |
| Mode M0 | |||
|---|---|---|---|
| Quadrant | BADHDUFLAG | Total packets | Discarded packets |
| A | 0 | 15098 | 2 |
| B | 0 | 15510 | 1 |
| C | 0 | 14851 | 1 |
| D | 0 | 19062 | 5 |
| Quadrant | Total seconds | Saturated seconds | Saturation percentage |
|---|---|---|---|
| A | 7317 | 32 | 0.437338% |
| B | 7317 | 47 | 0.642340% |
| C | 7317 | 20 | 0.273336% |
| D | 7316 | 245 | 3.348824% |
Noise dominated data is calculated using 1-second bins in cleaned event files. If a bin has >2000 counts, and if more than 50% of those come from <1% of pixels, then it is considered to be noise-dominated and hence unusable.
| Quadrant | # 1 sec bins | Bins with >0 counts | Bins with >2000 counts | High rate bins dominated by noise | Noise dominated (total time) | Noise dominated (detector-on time) | Marked lightcurve |
|---|---|---|---|---|---|---|---|
| A | 7662 | 7318 | 12 | 12 | 0.16% | 0.16% | 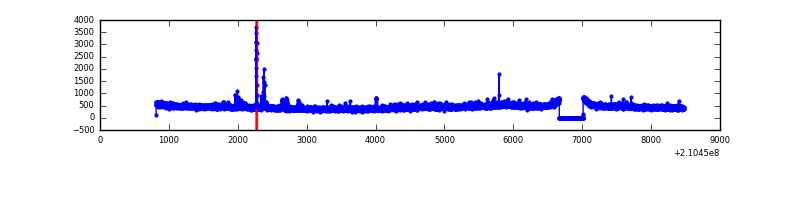 |
| B | 7662 | 7318 | 0 | 0 | 0.00% | 0.00% | 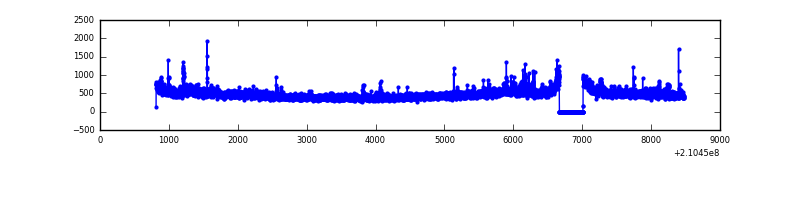 |
| C | 7662 | 7318 | 0 | 0 | 0.00% | 0.00% | 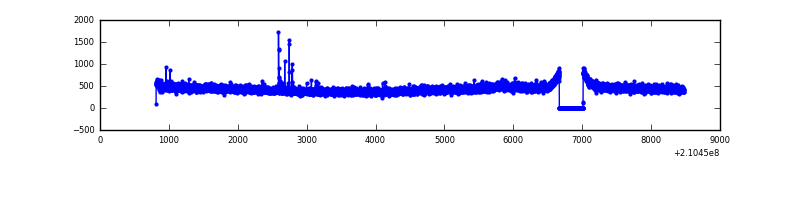 |
| D | 7662 | 7318 | 126 | 126 | 1.64% | 1.72% | 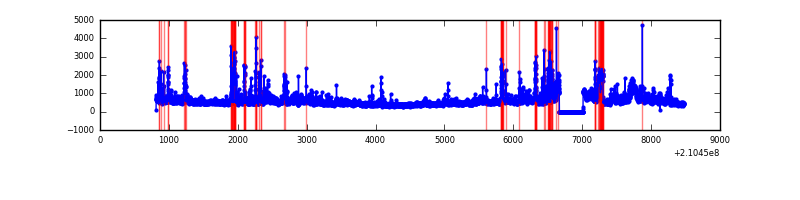 |
Top three noisy pixels from each quadrant. If the there are fewer than three noisy pixels in the level2.evt file, extra rows are filled as -1
| Pixel properties | Quadrant properties | ||||||
|---|---|---|---|---|---|---|---|
| Quadrant | DetID | PixID | Counts | Sigma | Mean | Median | Sigma |
| A | 13 | 251 | 84509 | 487.85 | 834 | 814 | 171.6 |
| A | 15 | 174 | 45962 | 263.16 | 834 | 814 | 171.6 |
| A | 0 | 50 | 24879 | 140.27 | 834 | 814 | 171.6 |
| B | 15 | 204 | 73759 | 446.86 | 845 | 825 | 163.2 |
| B | 8 | 3 | 53724 | 324.11 | 845 | 825 | 163.2 |
| B | 15 | 54 | 39913 | 239.49 | 845 | 825 | 163.2 |
| C | 9 | 54 | 18959 | 95.58 | 814 | 814 | 189.8 |
| C | 13 | 61 | 6590 | 30.42 | 814 | 814 | 189.8 |
| C | 3 | 202 | 2025 | 6.38 | 814 | 814 | 189.8 |
| D | 12 | 227 | 546626 | 2749.88 | 804 | 780 | 198.5 |
| D | 13 | 235 | 346063 | 1739.48 | 804 | 780 | 198.5 |
| D | 1 | 7 | 325968 | 1638.24 | 804 | 780 | 198.5 |
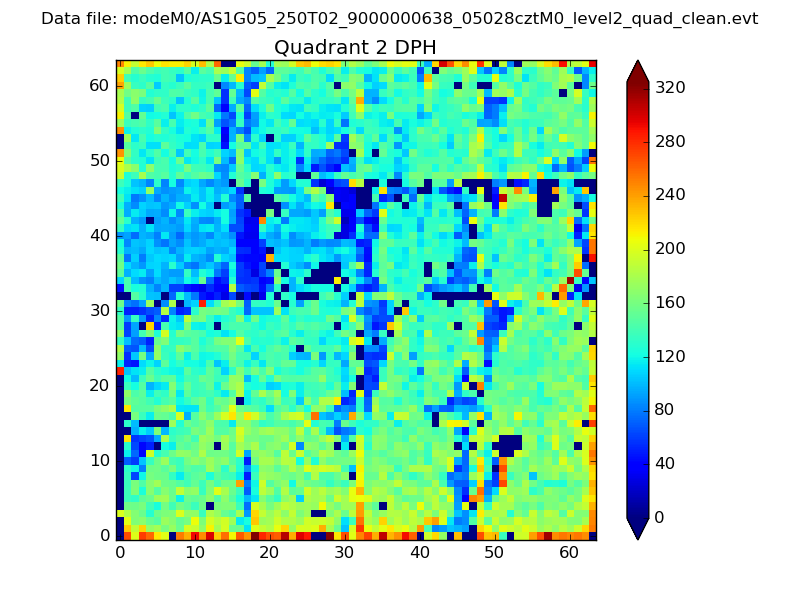
Histogram calculated using DETX and DETY for each event in the final _common_clean file
| Quadrant A | 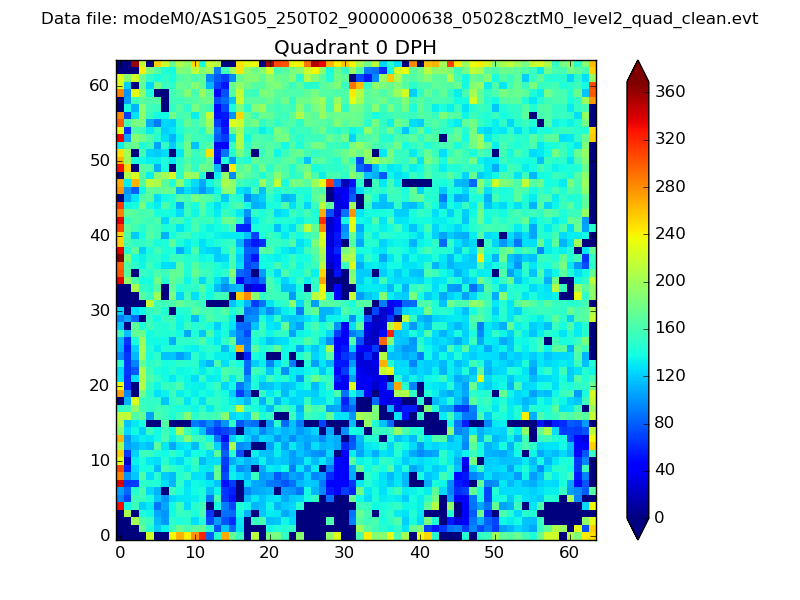 |
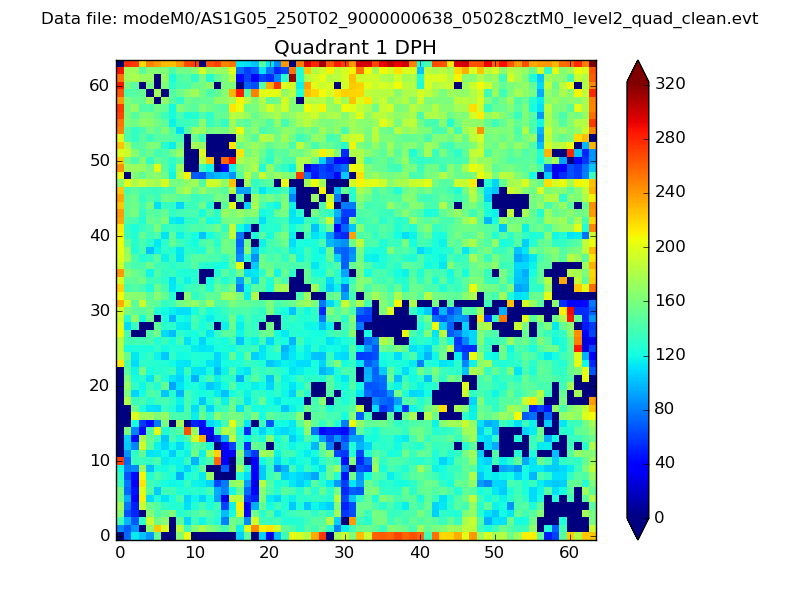 |
Quadrant B |
|---|---|---|---|
| Quadrant D | 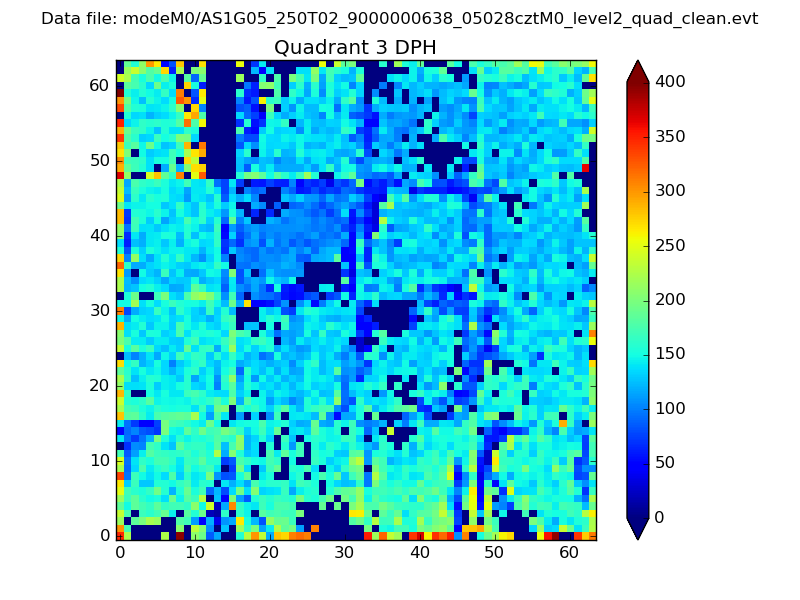 |
 |
Quadrant C |
| Plot type | Count rate plots | Images |
|---|---|---|
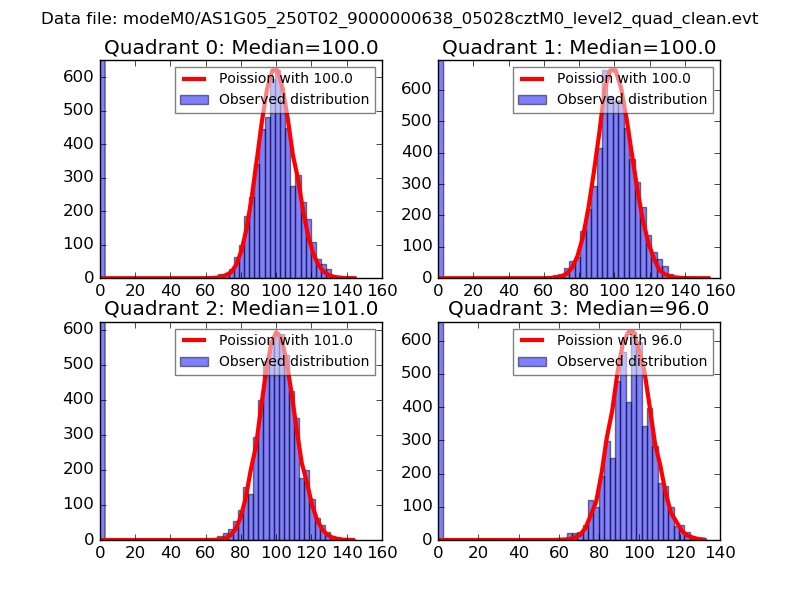
| Comparison with Poisson distribution Blue bars denote a histogram of data divided into 1 sec bins. Red curve is a Poisson curve with rate = median count rate of data. |
 |
 |
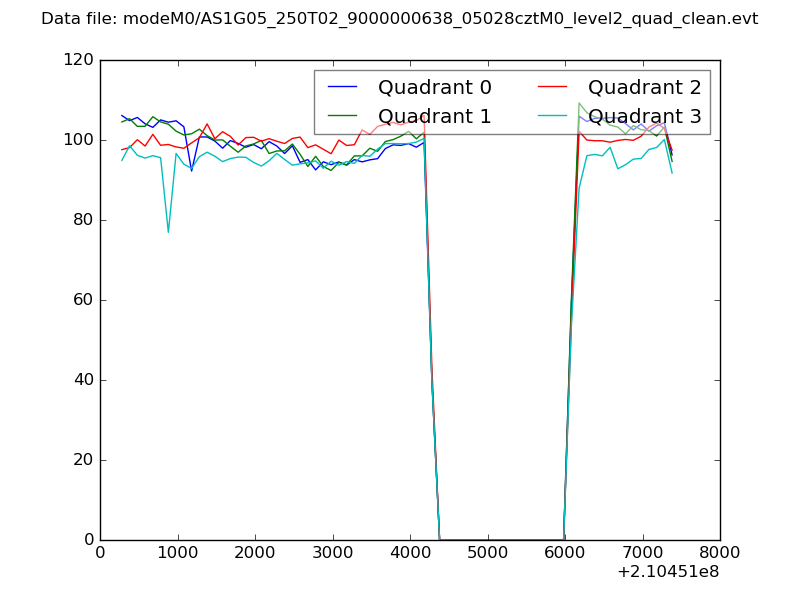
| Quadrant-wise count rates Data is divided into 100 sec bins |
 |
|
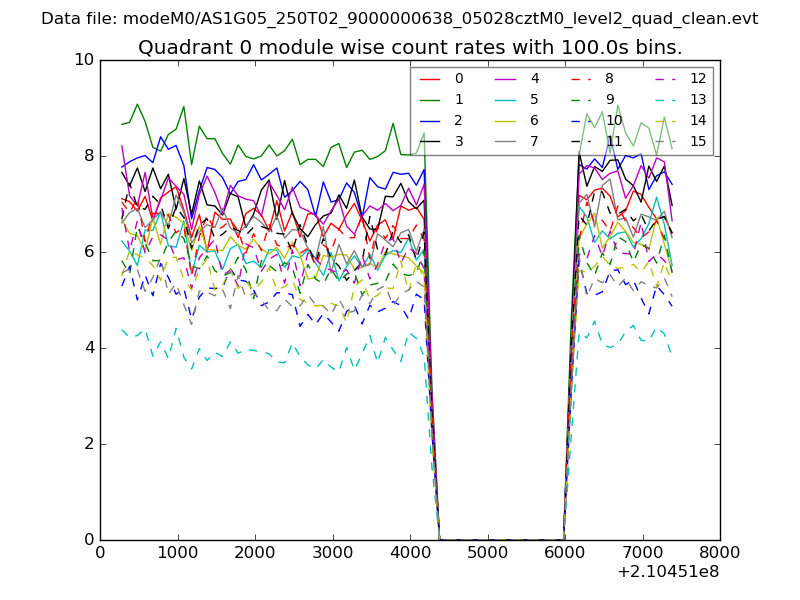
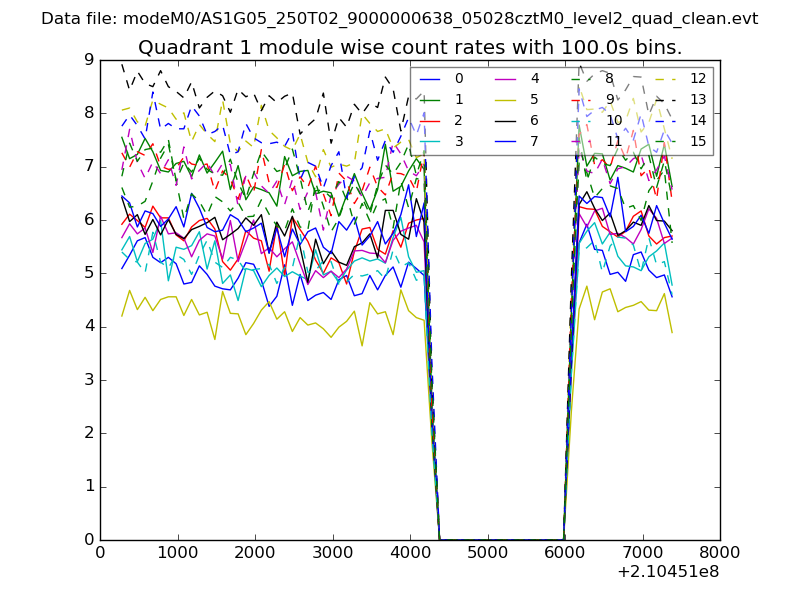
| Module-wise count rates for Quadrant A Data is divided into 100 sec bins |
 |
 |
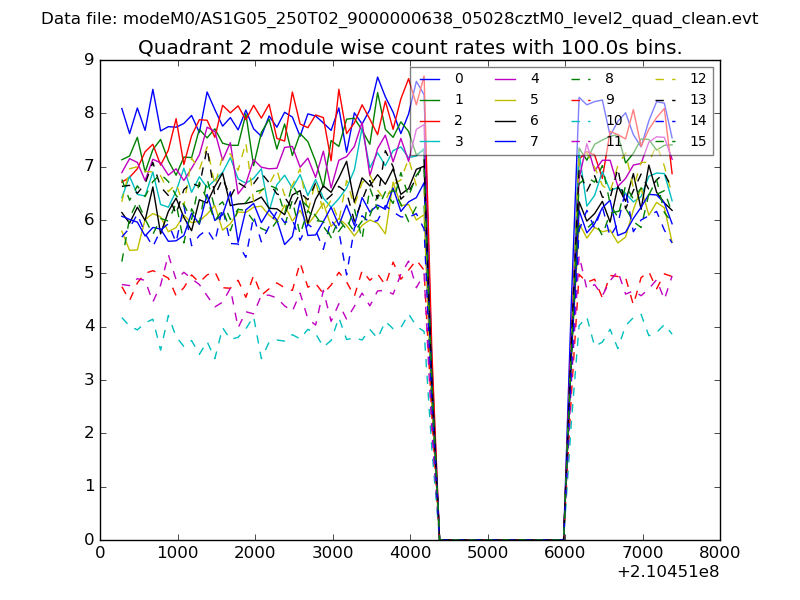
| Module-wise count rates for Quadrant B Data is divided into 100 sec bins |
 |
 |
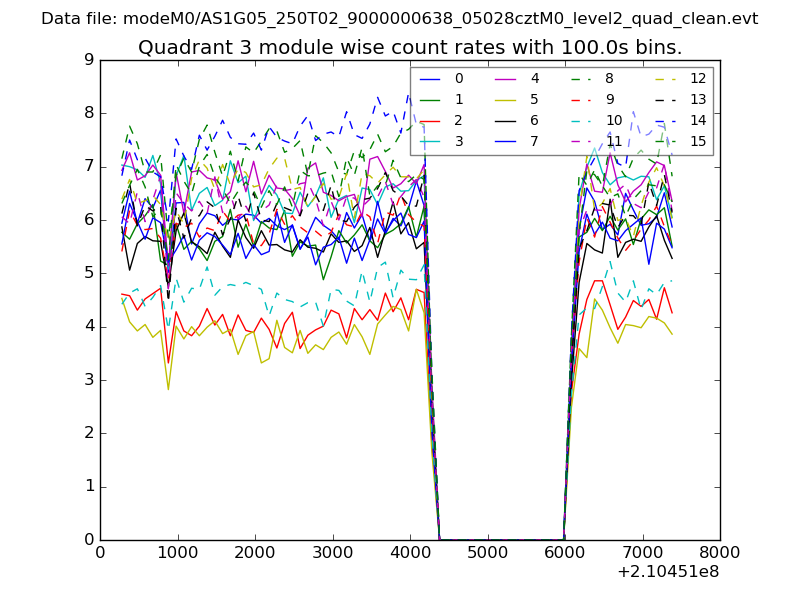
| Module-wise count rates for Quadrant C Data is divided into 100 sec bins |
 |
 |
| Module-wise count rates for Quadrant D Data is divided into 100 sec bins |
 |
 |
| Parameter | Plot |
|---|---|
| CZT HV Monitor | 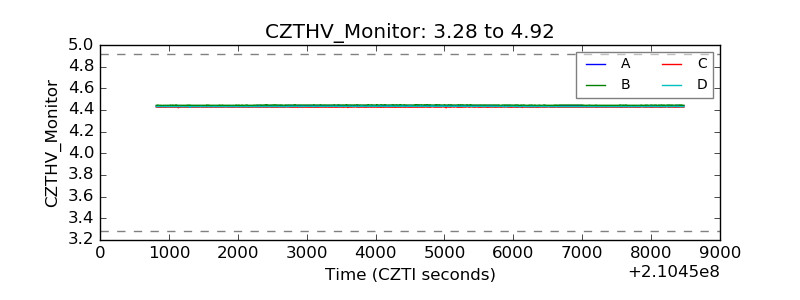 |
| D_VDD | 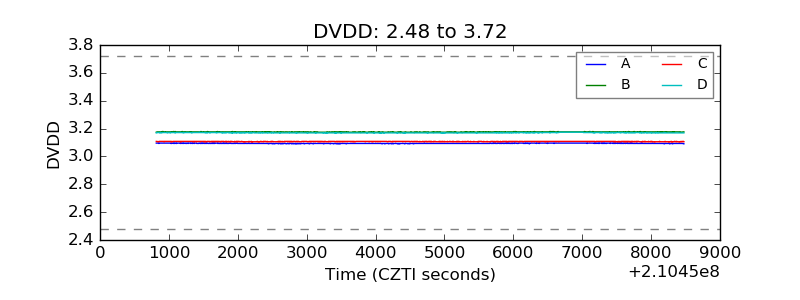 |
| Temperature 1 |  |
| Veto HV Monitor | 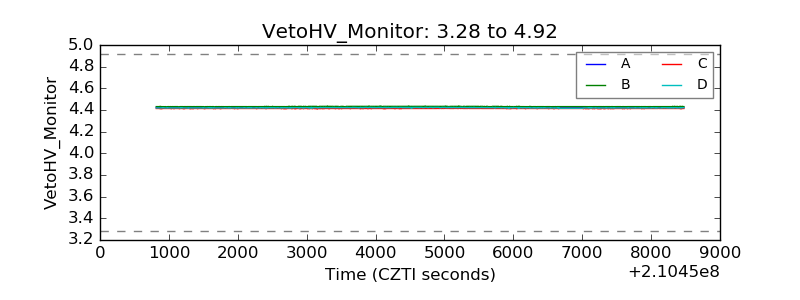 |
| Veto LLD | 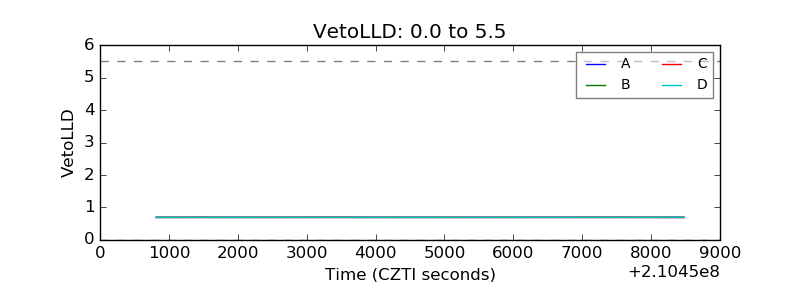 |
| Alpha Counter | 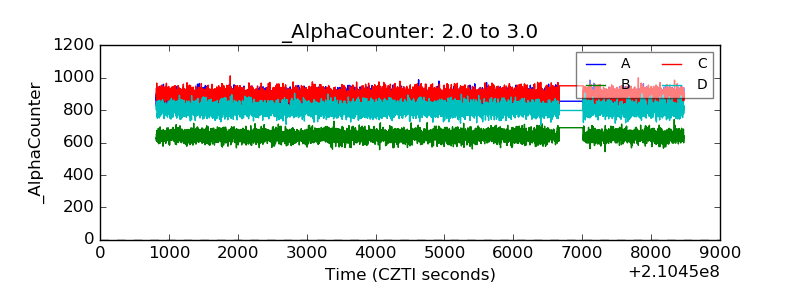 |
| _CPM_Rate | 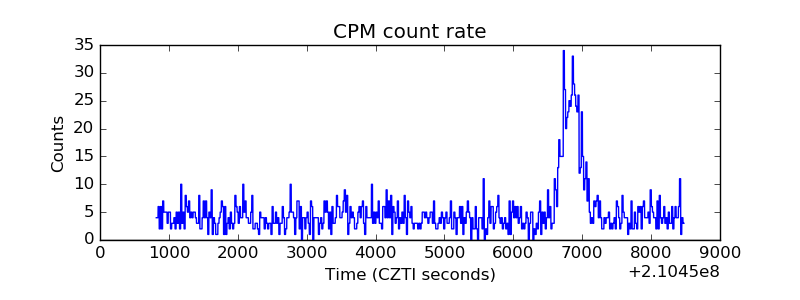 |
| CZT Counter | 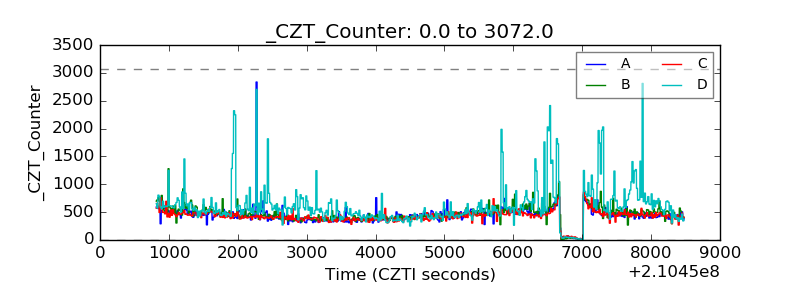 |
| +2.5 Volts monitor |  |
| +5 Volts monitor | 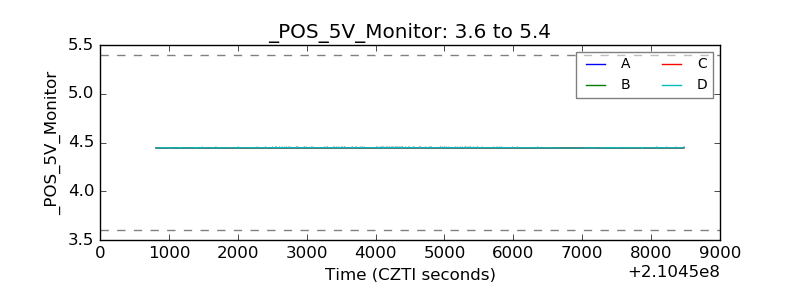 |
| _ROLL_ROT |  |
| _Roll_DEC | 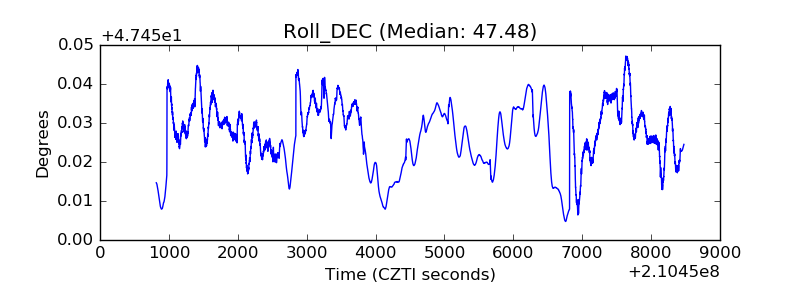 |
| _Roll_RA | 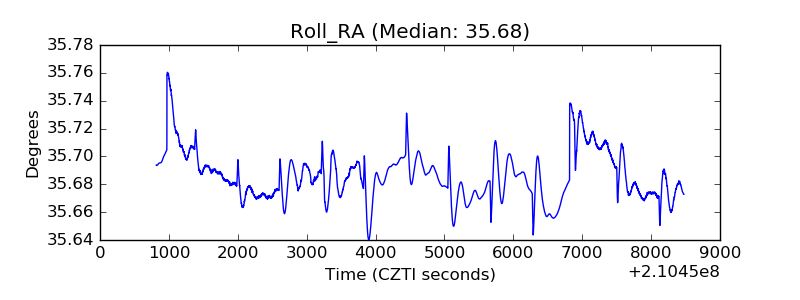 |
| Veto Counter | 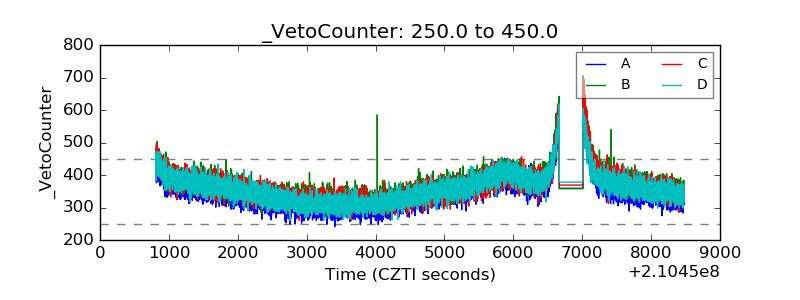 |