| Param | Original file | Final file |
|---|---|---|
| Filename | modeM0/AS1G05_250T02_9000000638_05030cztM0_level2.evt | modeM0/AS1G05_250T02_9000000638_05030cztM0_level2_quad_clean.evt |
| Size (bytes) | 875,093,760 | 152,164,800 |
| Size | 834.6 MB | 145.1 MB |
| Events in quadrant A | 6,050,863 | 930,679 |
| Events in quadrant B | 6,163,813 | 934,797 |
| Events in quadrant C | 5,671,419 | 949,004 |
| Events in quadrant D | 7,739,980 | 899,756 |
| Mode M9 | |||
|---|---|---|---|
| Quadrant | BADHDUFLAG | Total packets | Discarded packets |
| A | 0 | 13 | 0 |
| B | 0 | 13 | 0 |
| C | 0 | 13 | 0 |
| D | 0 | 14 | 0 |
| Mode SS | |||
|---|---|---|---|
| Quadrant | BADHDUFLAG | Total packets | Discarded packets |
| A | 0 | 262 | 0 |
| B | 0 | 262 | 0 |
| C | 0 | 262 | 0 |
| D | 0 | 262 | 0 |
| Mode M0 | |||
|---|---|---|---|
| Quadrant | BADHDUFLAG | Total packets | Discarded packets |
| A | 0 | 27622 | 4 |
| B | 0 | 27442 | 3 |
| C | 0 | 26416 | 3 |
| D | 0 | 32155 | 3 |
| Quadrant | Total seconds | Saturated seconds | Saturation percentage |
|---|---|---|---|
| A | 12940 | 101 | 0.780526% |
| B | 12940 | 101 | 0.780526% |
| C | 12940 | 37 | 0.285935% |
| D | 12940 | 293 | 2.264297% |
Noise dominated data is calculated using 1-second bins in cleaned event files. If a bin has >2000 counts, and if more than 50% of those come from <1% of pixels, then it is considered to be noise-dominated and hence unusable.
| Quadrant | # 1 sec bins | Bins with >0 counts | Bins with >2000 counts | High rate bins dominated by noise | Noise dominated (total time) | Noise dominated (detector-on time) | Marked lightcurve |
|---|---|---|---|---|---|---|---|
| A | 14105 | 12942 | 46 | 46 | 0.33% | 0.36% | 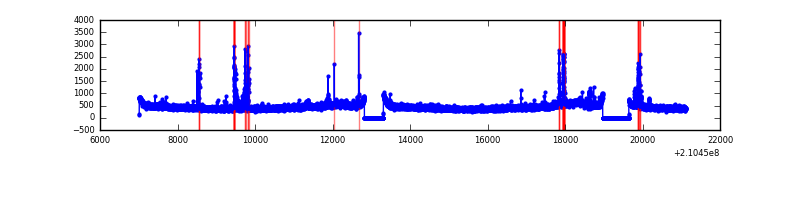 |
| B | 14105 | 12942 | 9 | 9 | 0.06% | 0.07% | 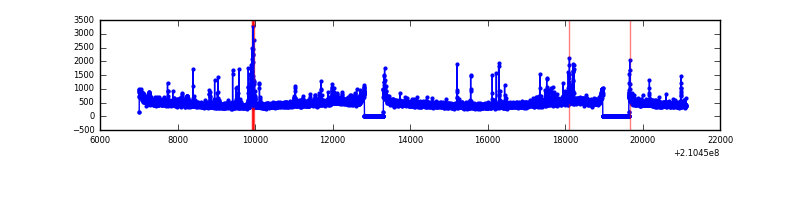 |
| C | 14105 | 12942 | 0 | 0 | 0.00% | 0.00% | 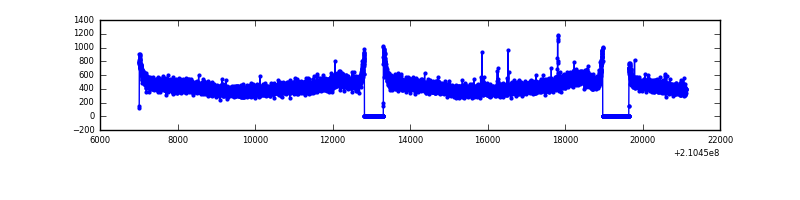 |
| D | 14105 | 12942 | 131 | 131 | 0.93% | 1.01% | 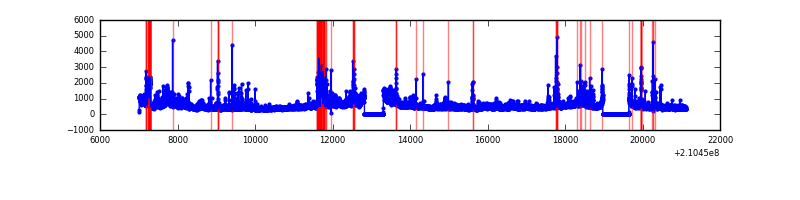 |
Top three noisy pixels from each quadrant. If the there are fewer than three noisy pixels in the level2.evt file, extra rows are filled as -1
| Pixel properties | Quadrant properties | ||||||
|---|---|---|---|---|---|---|---|
| Quadrant | DetID | PixID | Counts | Sigma | Mean | Median | Sigma |
| A | 15 | 234 | 155490 | 514.23 | 1477 | 1447 | 299.6 |
| A | 0 | 50 | 141480 | 467.46 | 1477 | 1447 | 299.6 |
| A | 15 | 174 | 54890 | 178.41 | 1477 | 1447 | 299.6 |
| B | 4 | 48 | 121887 | 420.92 | 1488 | 1455 | 286.1 |
| B | 0 | 219 | 89938 | 309.25 | 1488 | 1455 | 286.1 |
| B | 15 | 204 | 76376 | 261.85 | 1488 | 1455 | 286.1 |
| C | 8 | 128 | 15314 | 41.45 | 1443 | 1451 | 334.5 |
| C | 9 | 54 | 13446 | 35.86 | 1443 | 1451 | 334.5 |
| C | 13 | 61 | 11852 | 31.1 | 1443 | 1451 | 334.5 |
| D | 12 | 227 | 778261 | 2226.75 | 1433 | 1391 | 348.9 |
| D | 13 | 53 | 466230 | 1332.37 | 1433 | 1391 | 348.9 |
| D | 13 | 235 | 372226 | 1062.93 | 1433 | 1391 | 348.9 |
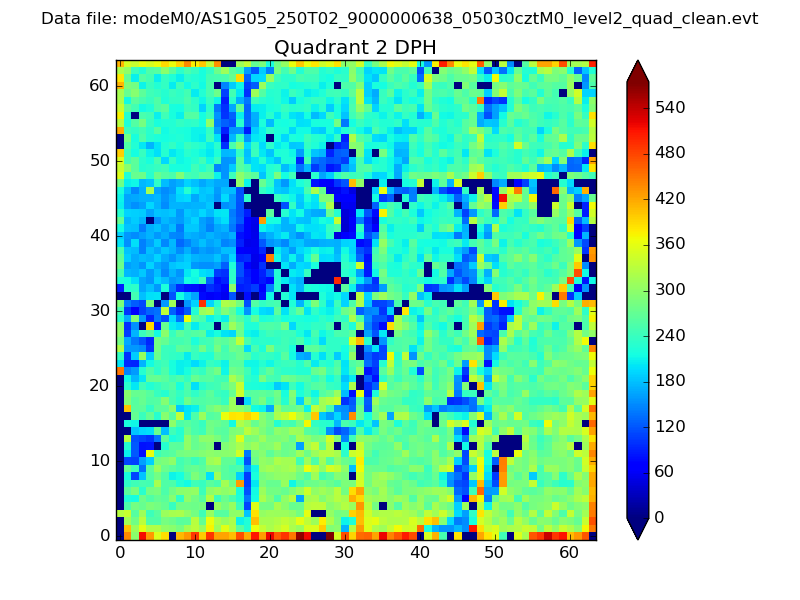
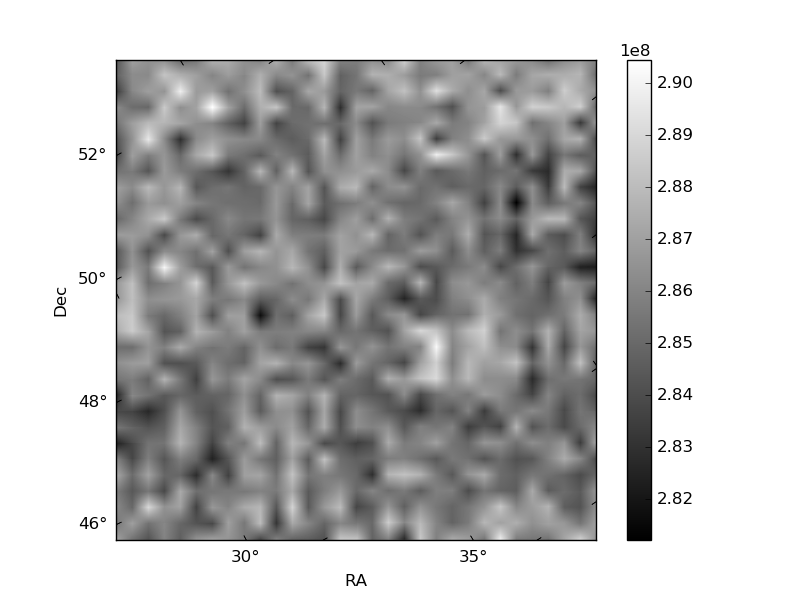
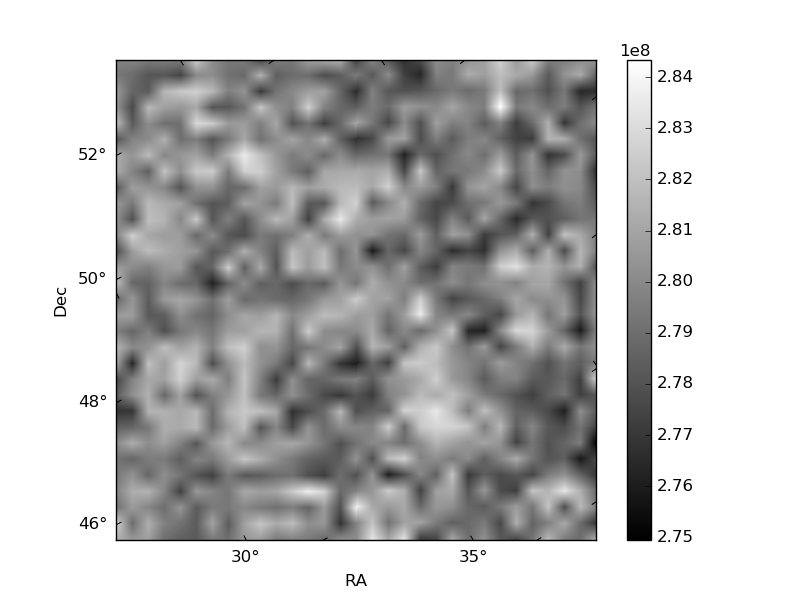
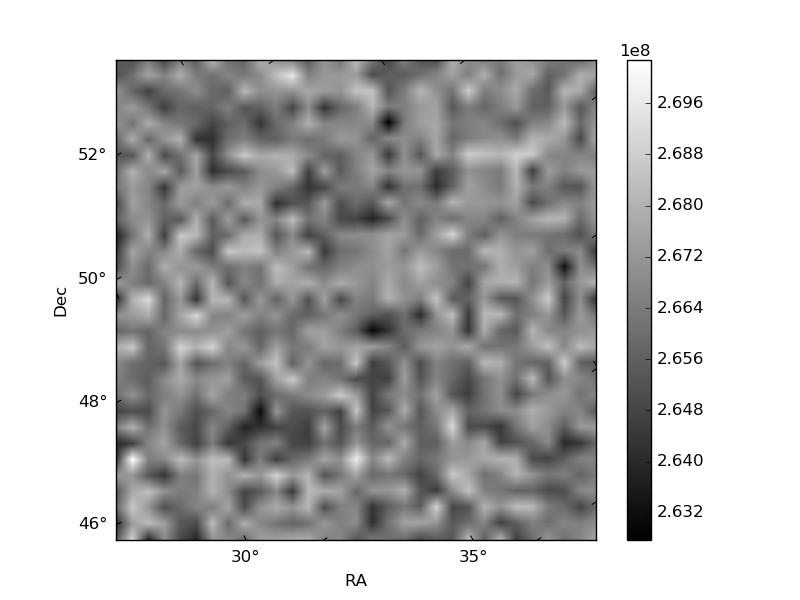
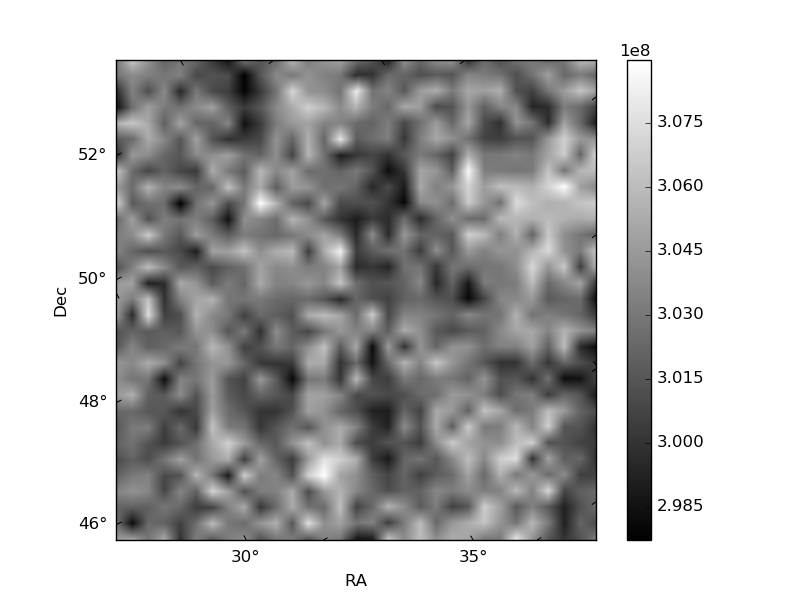
Histogram calculated using DETX and DETY for each event in the final _common_clean file
| Quadrant A | 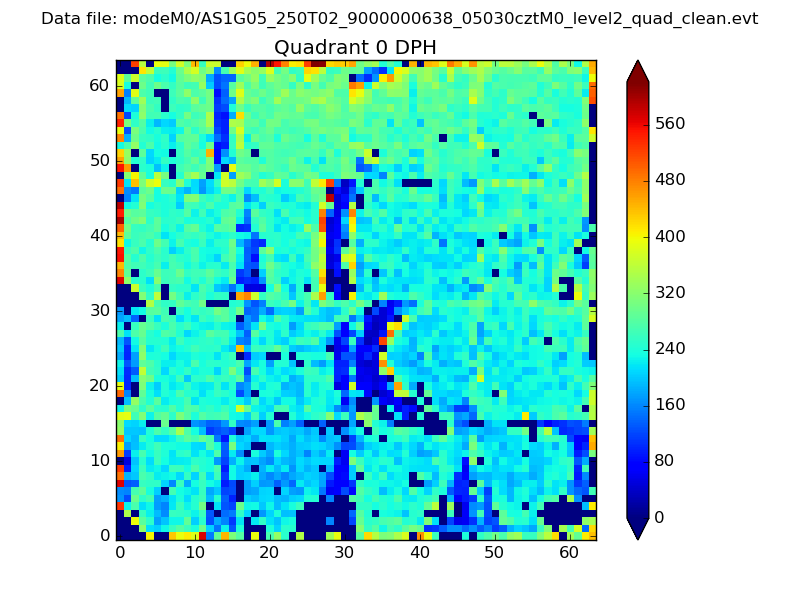 |
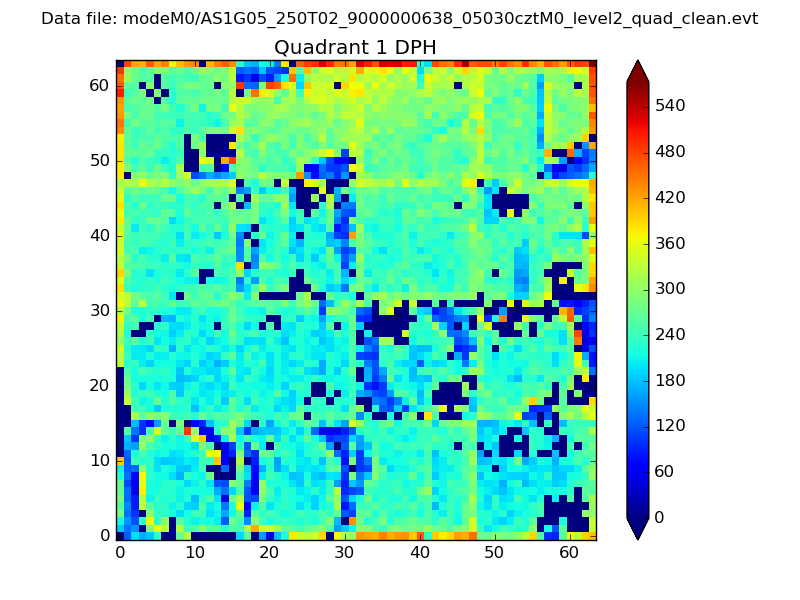 |
Quadrant B |
|---|---|---|---|
| Quadrant D | 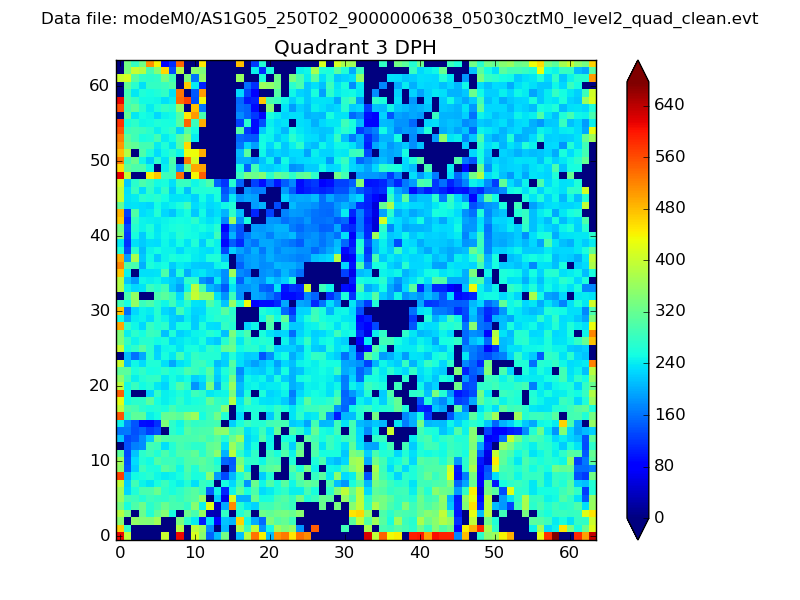 |
 |
Quadrant C |
| Plot type | Count rate plots | Images |
|---|---|---|
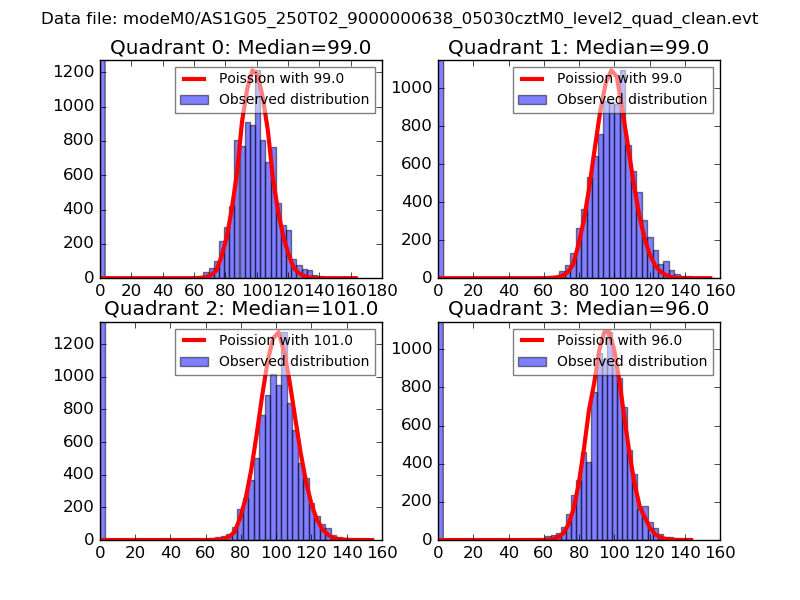
| Comparison with Poisson distribution Blue bars denote a histogram of data divided into 1 sec bins. Red curve is a Poisson curve with rate = median count rate of data. |
 |
 |
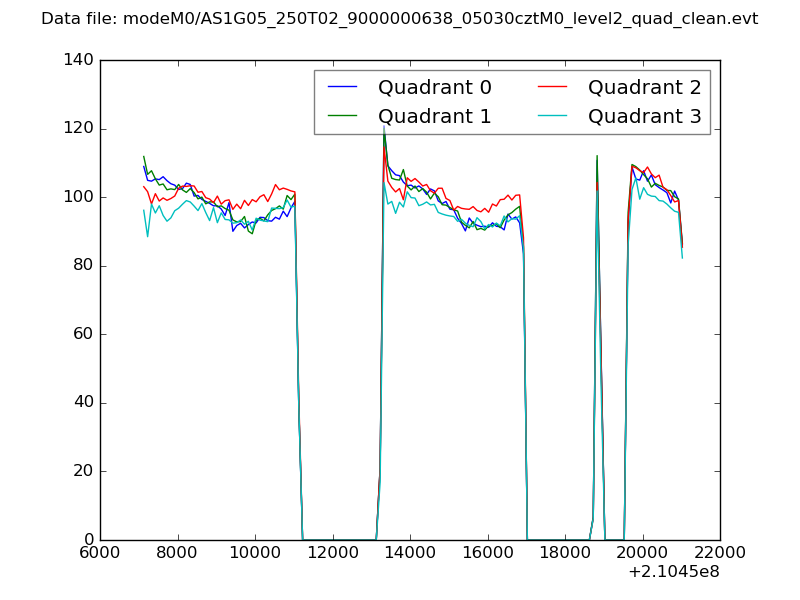
| Quadrant-wise count rates Data is divided into 100 sec bins |
 |
|
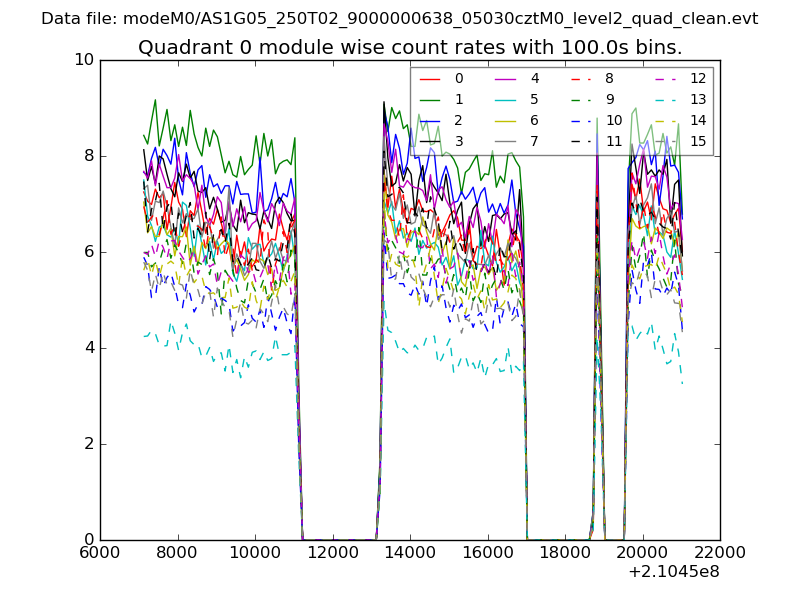
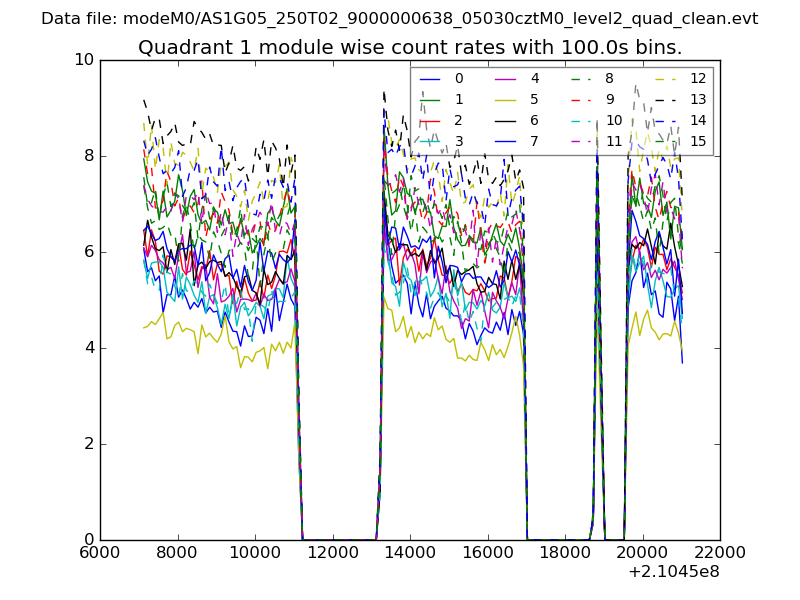
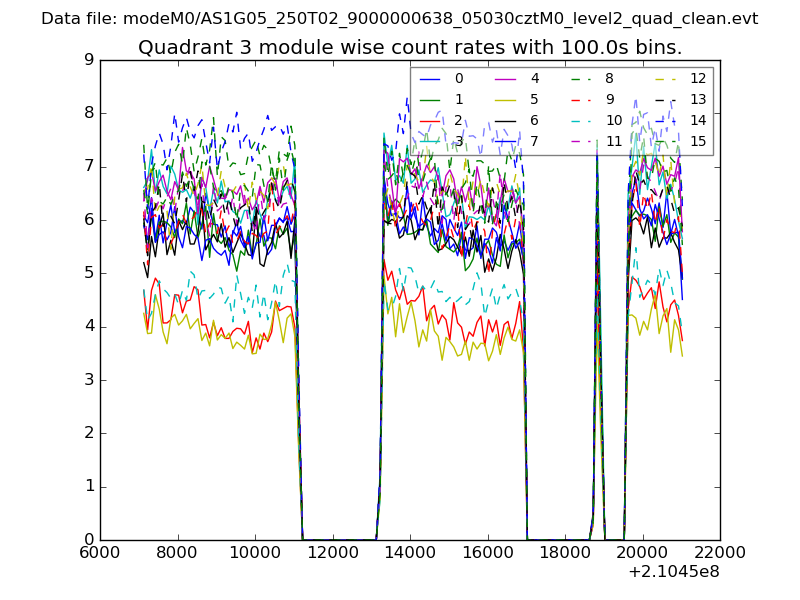
| Module-wise count rates for Quadrant A Data is divided into 100 sec bins |
 |
 |
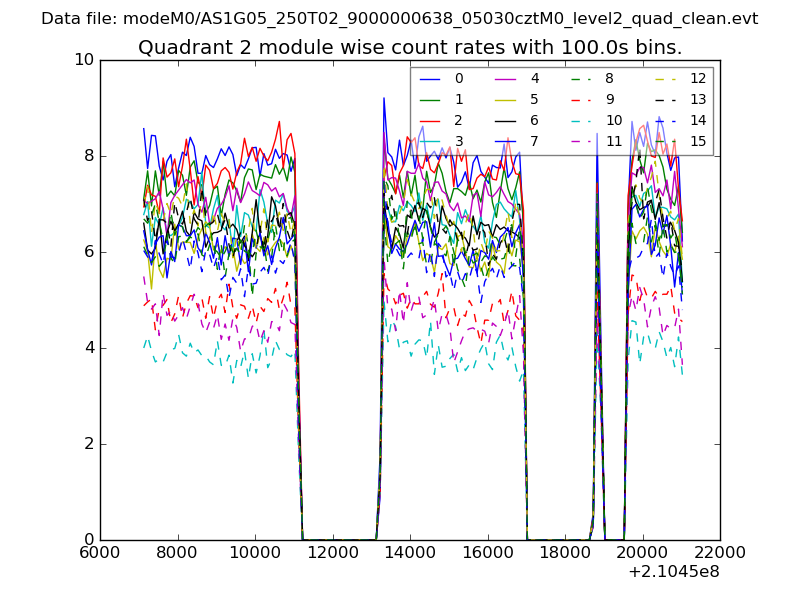
| Module-wise count rates for Quadrant B Data is divided into 100 sec bins |
 |
 |
| Module-wise count rates for Quadrant C Data is divided into 100 sec bins |
 |
 |
| Module-wise count rates for Quadrant D Data is divided into 100 sec bins |
 |
 |
| Parameter | Plot |
|---|---|
| CZT HV Monitor | 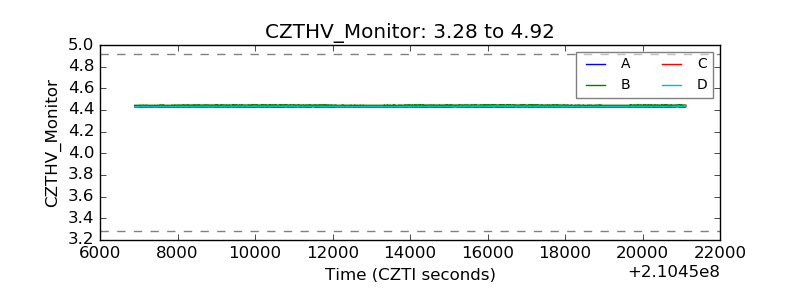 |
| D_VDD | 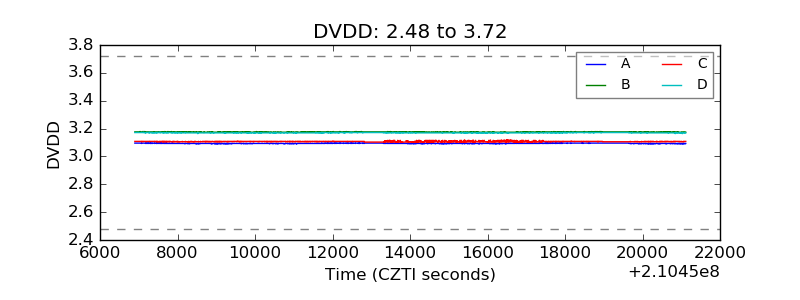 |
| Temperature 1 | 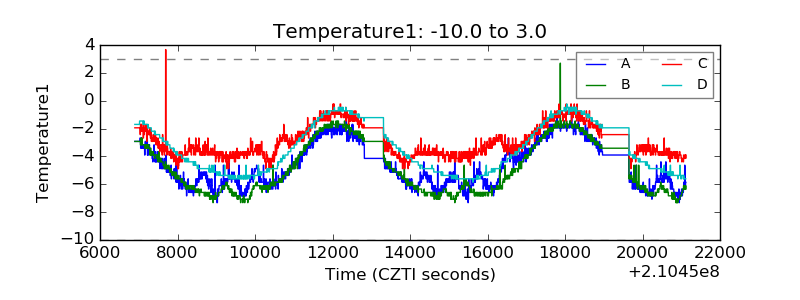 |
| Veto HV Monitor | 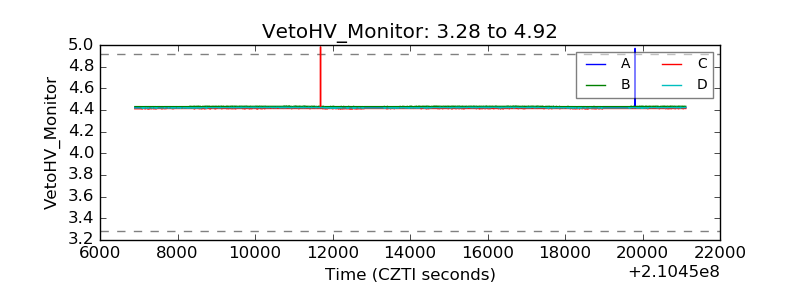 |
| Veto LLD |  |
| Alpha Counter | 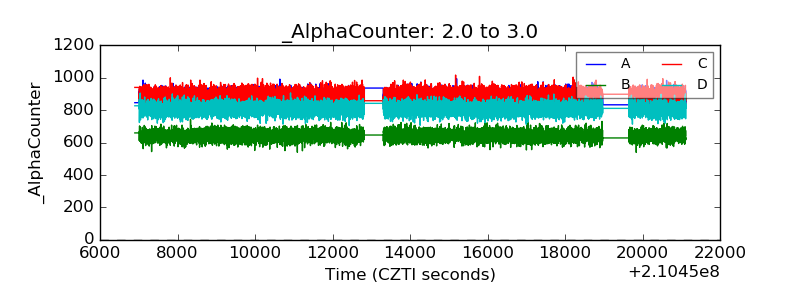 |
| _CPM_Rate | 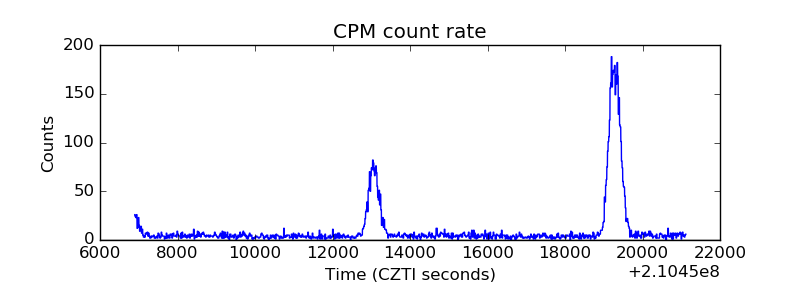 |
| CZT Counter | 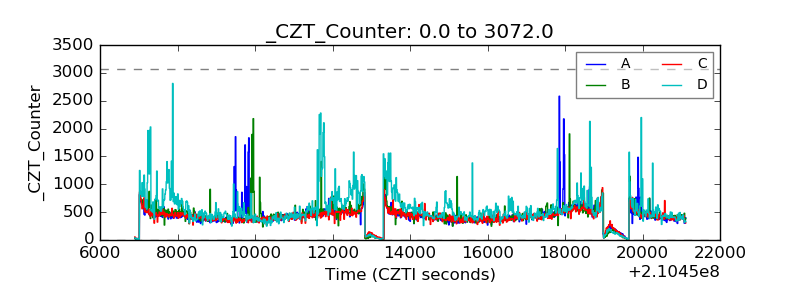 |
| +2.5 Volts monitor |  |
| +5 Volts monitor | 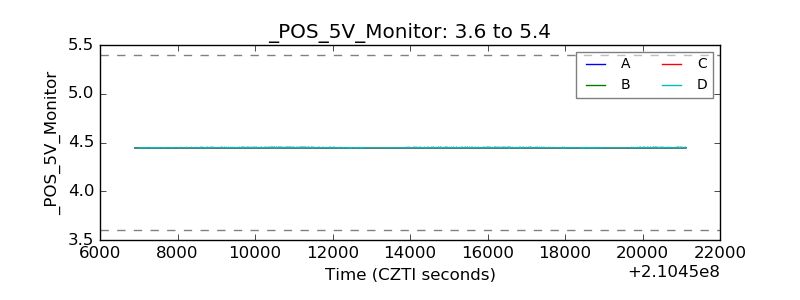 |
| _ROLL_ROT | 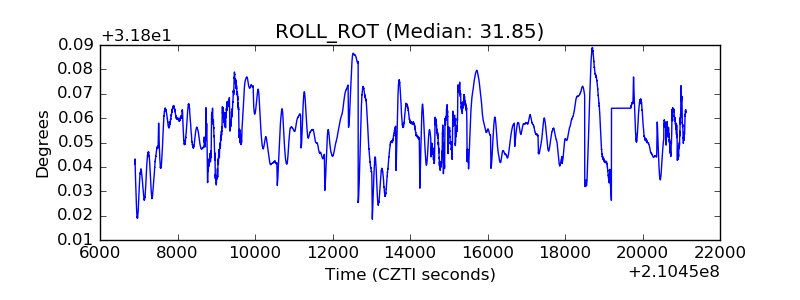 |
| _Roll_DEC | 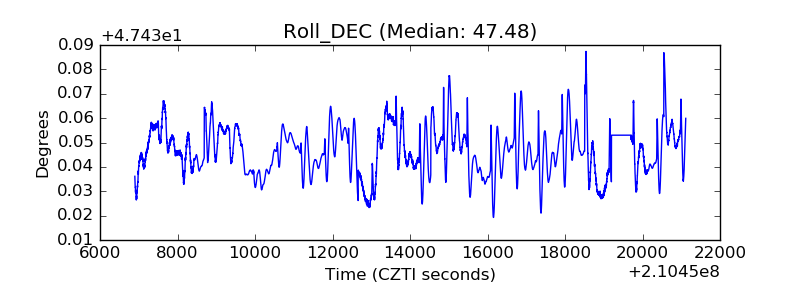 |
| _Roll_RA | 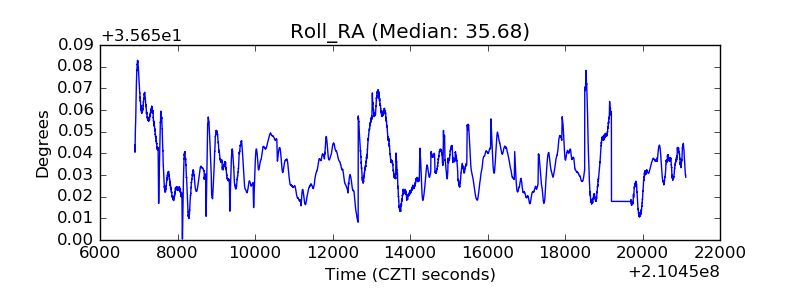 |
| Veto Counter | 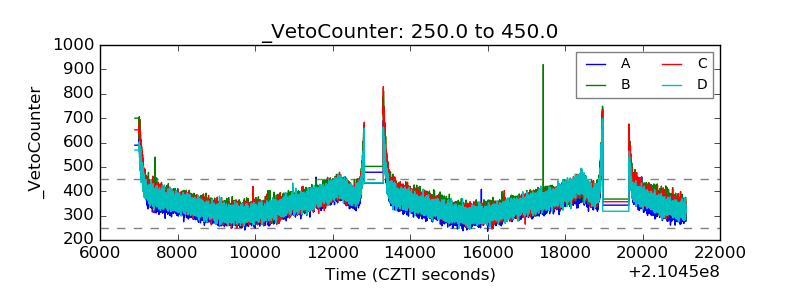 |