| Param | Original file | Final file |
|---|---|---|
| Filename | modeM0/AS1G05_250T02_9000000638_05031cztM0_level2.evt | modeM0/AS1G05_250T02_9000000638_05031cztM0_level2_quad_clean.evt |
| Size (bytes) | 478,183,680 | 87,505,920 |
| Size | 456.0 MB | 83.5 MB |
| Events in quadrant A | 3,344,485 | 536,738 |
| Events in quadrant B | 3,585,306 | 539,571 |
| Events in quadrant C | 3,185,498 | 547,705 |
| Events in quadrant D | 3,871,967 | 519,278 |
| Mode M9 | |||
|---|---|---|---|
| Quadrant | BADHDUFLAG | Total packets | Discarded packets |
| A | 0 | 16 | 0 |
| B | 0 | 16 | 0 |
| C | 0 | 16 | 0 |
| D | 0 | 16 | 0 |
| Mode SS | |||
|---|---|---|---|
| Quadrant | BADHDUFLAG | Total packets | Discarded packets |
| A | 0 | 148 | 0 |
| B | 0 | 148 | 0 |
| C | 0 | 148 | 0 |
| D | 0 | 148 | 0 |
| Mode M0 | |||
|---|---|---|---|
| Quadrant | BADHDUFLAG | Total packets | Discarded packets |
| A | 0 | 15331 | 3 |
| B | 0 | 15708 | 2 |
| C | 0 | 14829 | 2 |
| D | 0 | 16941 | 2 |
| Quadrant | Total seconds | Saturated seconds | Saturation percentage |
|---|---|---|---|
| A | 7281 | 34 | 0.466969% |
| B | 7281 | 51 | 0.700453% |
| C | 7281 | 16 | 0.219750% |
| D | 7281 | 119 | 1.634391% |
Noise dominated data is calculated using 1-second bins in cleaned event files. If a bin has >2000 counts, and if more than 50% of those come from <1% of pixels, then it is considered to be noise-dominated and hence unusable.
| Quadrant | # 1 sec bins | Bins with >0 counts | Bins with >2000 counts | High rate bins dominated by noise | Noise dominated (total time) | Noise dominated (detector-on time) | Marked lightcurve |
|---|---|---|---|---|---|---|---|
| A | 8811 | 7283 | 7 | 7 | 0.08% | 0.10% | 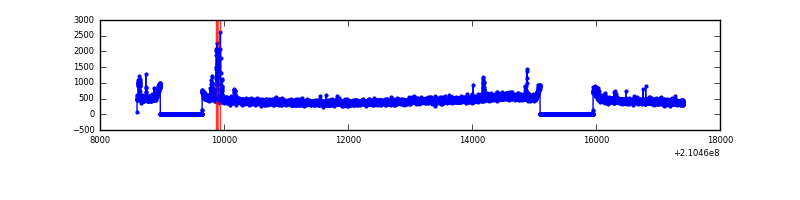 |
| B | 8811 | 7283 | 5 | 5 | 0.06% | 0.07% | 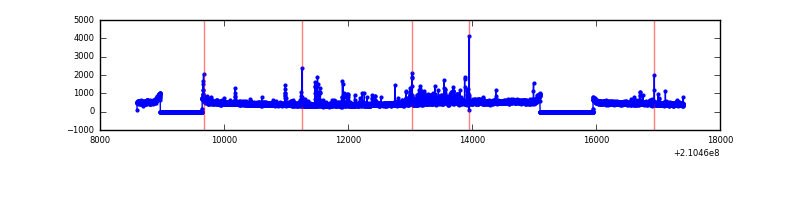 |
| C | 8811 | 7283 | 0 | 0 | 0.00% | 0.00% | 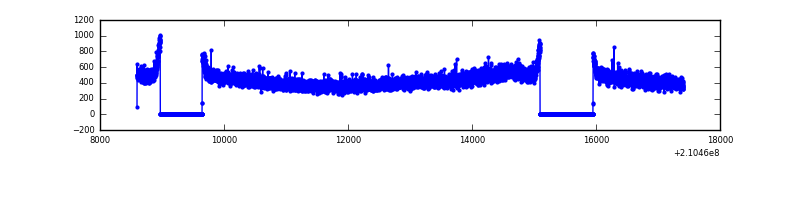 |
| D | 8811 | 7283 | 68 | 68 | 0.77% | 0.93% | 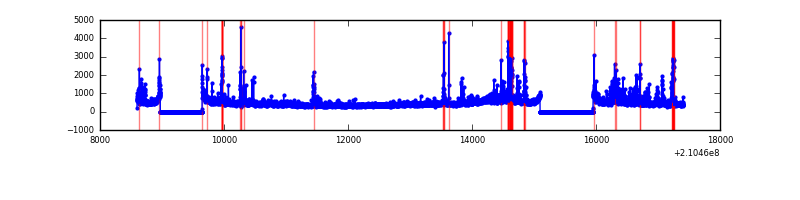 |
Top three noisy pixels from each quadrant. If the there are fewer than three noisy pixels in the level2.evt file, extra rows are filled as -1
| Pixel properties | Quadrant properties | ||||||
|---|---|---|---|---|---|---|---|
| Quadrant | DetID | PixID | Counts | Sigma | Mean | Median | Sigma |
| A | 15 | 234 | 81427 | 471.08 | 829 | 810 | 171.1 |
| A | 13 | 251 | 62538 | 360.71 | 829 | 810 | 171.1 |
| A | 0 | 226 | 8399 | 44.34 | 829 | 810 | 171.1 |
| B | 15 | 204 | 148769 | 916.68 | 837 | 817 | 161.4 |
| B | 4 | 48 | 79751 | 489.06 | 837 | 817 | 161.4 |
| B | 0 | 219 | 79000 | 484.4 | 837 | 817 | 161.4 |
| C | 1 | 16 | 12435 | 61.47 | 811 | 816 | 189.0 |
| C | 13 | 61 | 6803 | 31.67 | 811 | 816 | 189.0 |
| C | 9 | 16 | 4095 | 17.35 | 811 | 816 | 189.0 |
| D | 13 | 235 | 257263 | 1279.0 | 802 | 777 | 200.5 |
| D | 2 | 14 | 125888 | 623.88 | 802 | 777 | 200.5 |
| D | 13 | 53 | 105729 | 523.36 | 802 | 777 | 200.5 |
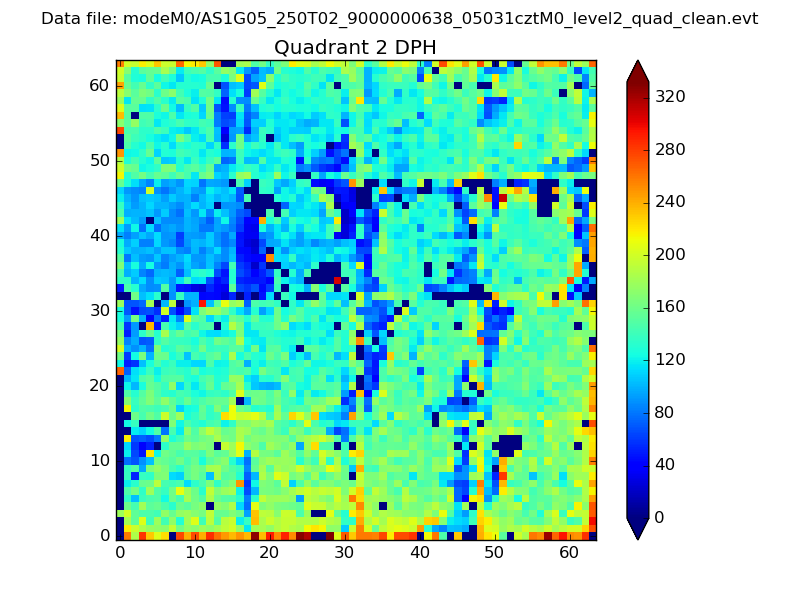
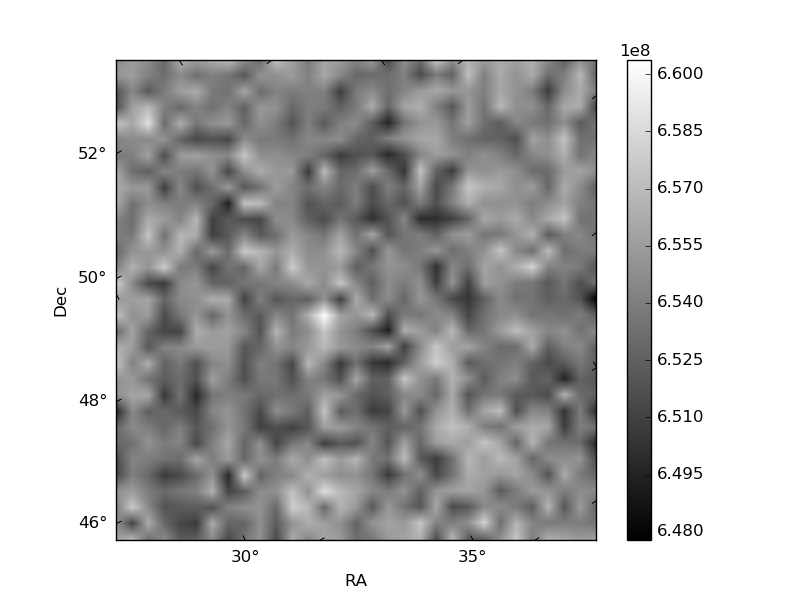
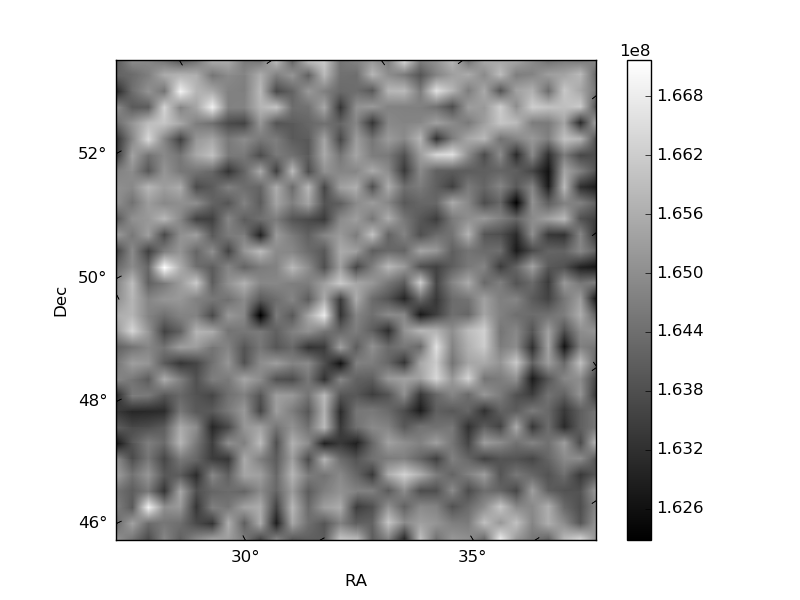
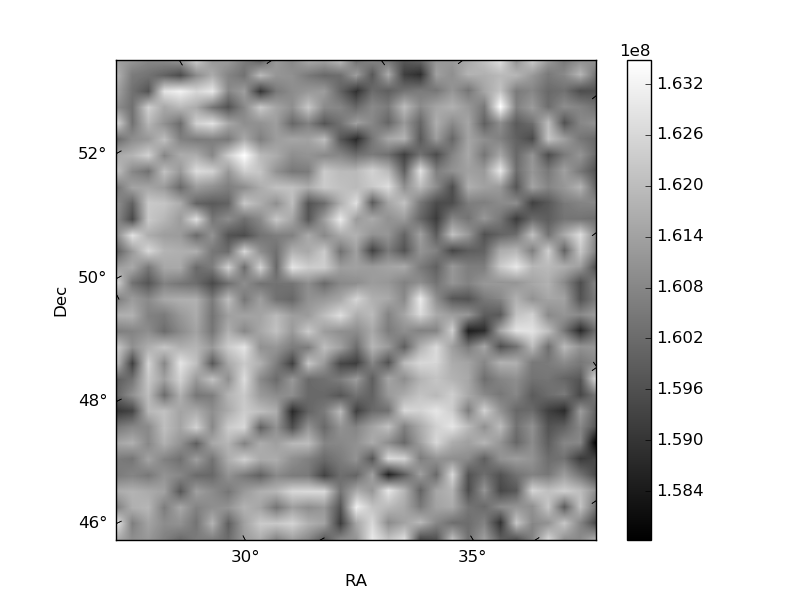
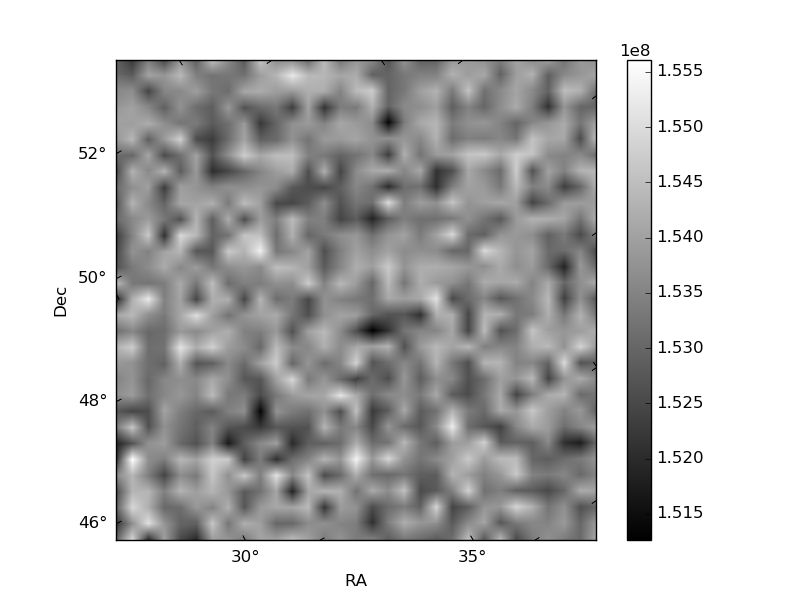
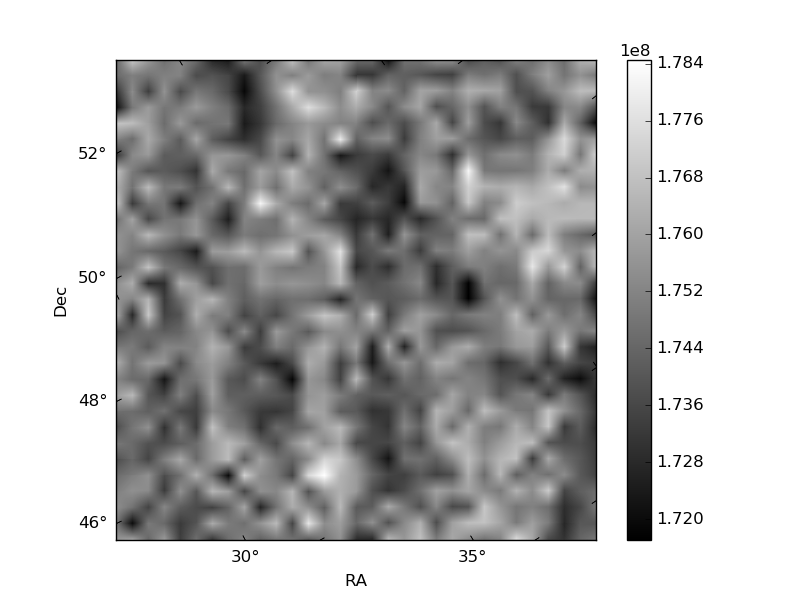
Histogram calculated using DETX and DETY for each event in the final _common_clean file
| Quadrant A | 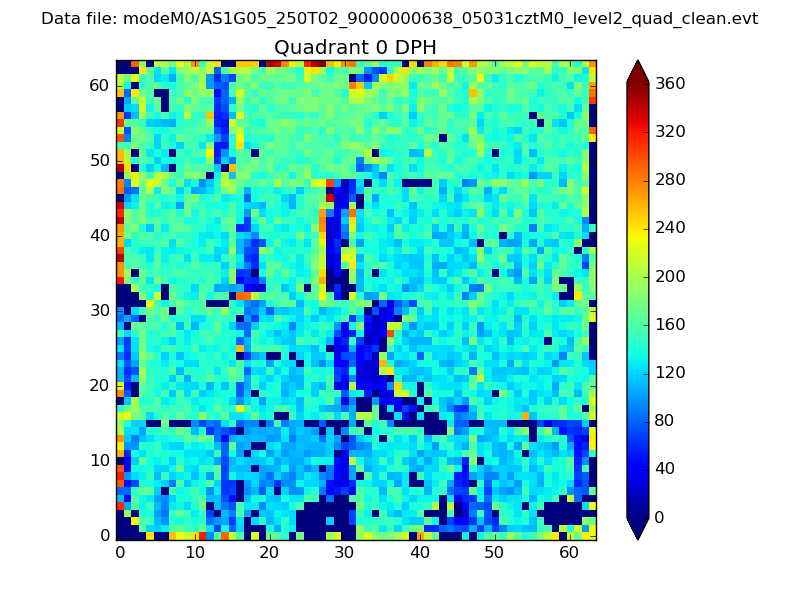 |
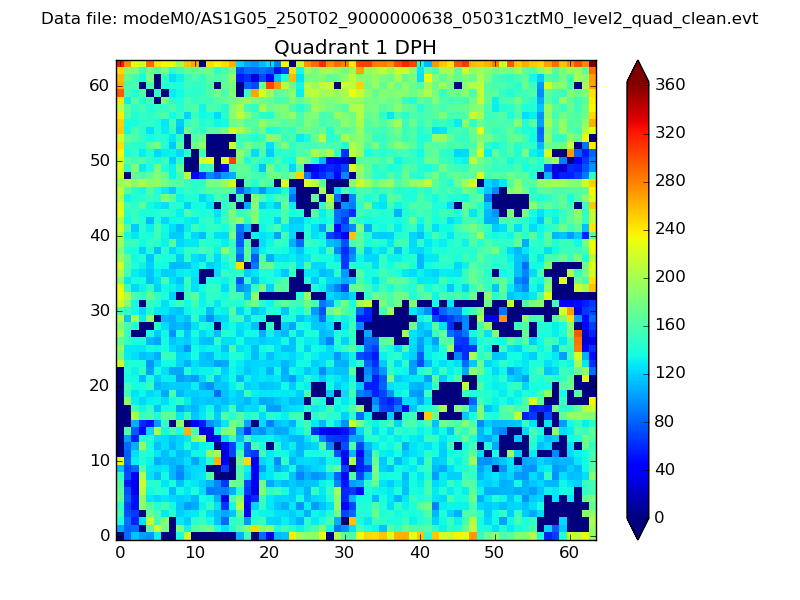 |
Quadrant B |
|---|---|---|---|
| Quadrant D | 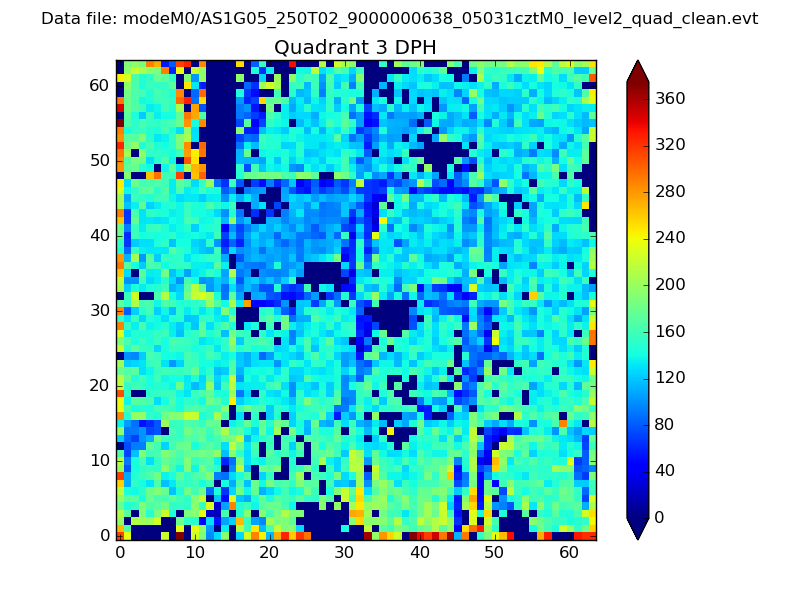 |
 |
Quadrant C |
| Plot type | Count rate plots | Images |
|---|---|---|
| Comparison with Poisson distribution Blue bars denote a histogram of data divided into 1 sec bins. Red curve is a Poisson curve with rate = median count rate of data. |
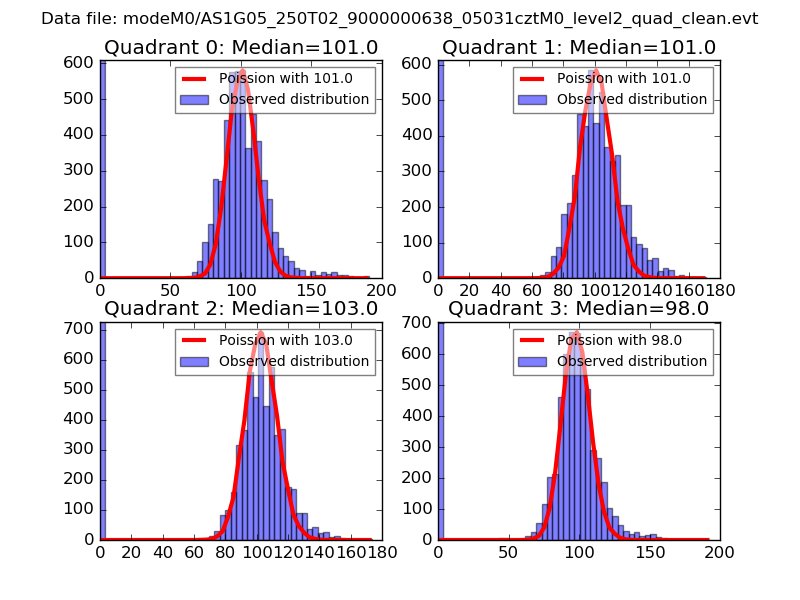 |
 |
| Quadrant-wise count rates Data is divided into 100 sec bins |
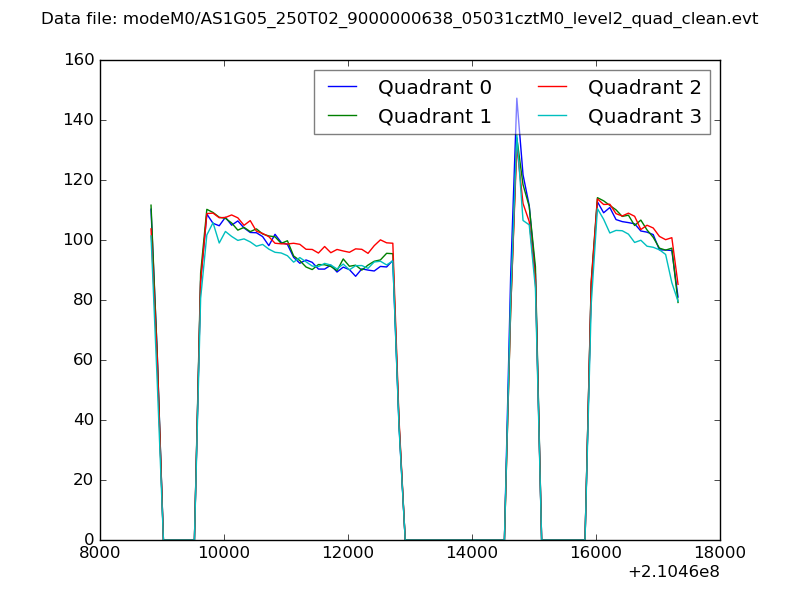 |
|
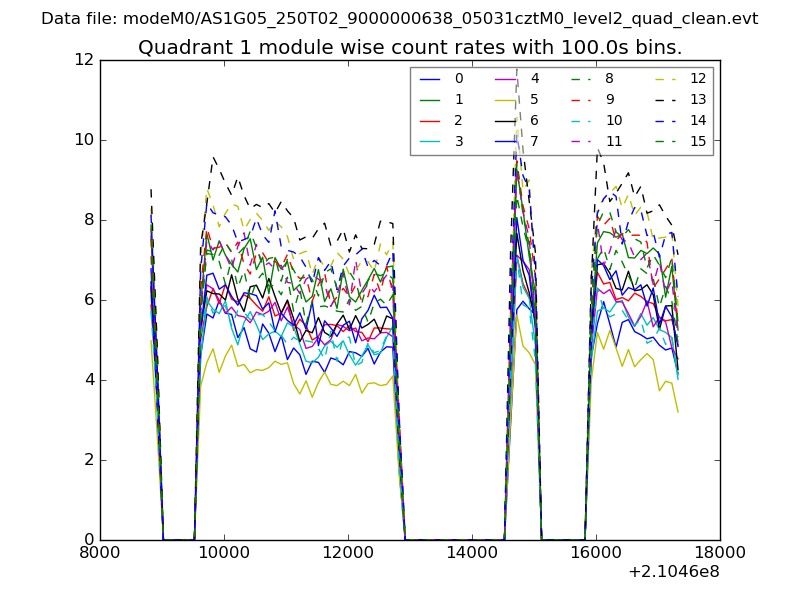
| Module-wise count rates for Quadrant A Data is divided into 100 sec bins |
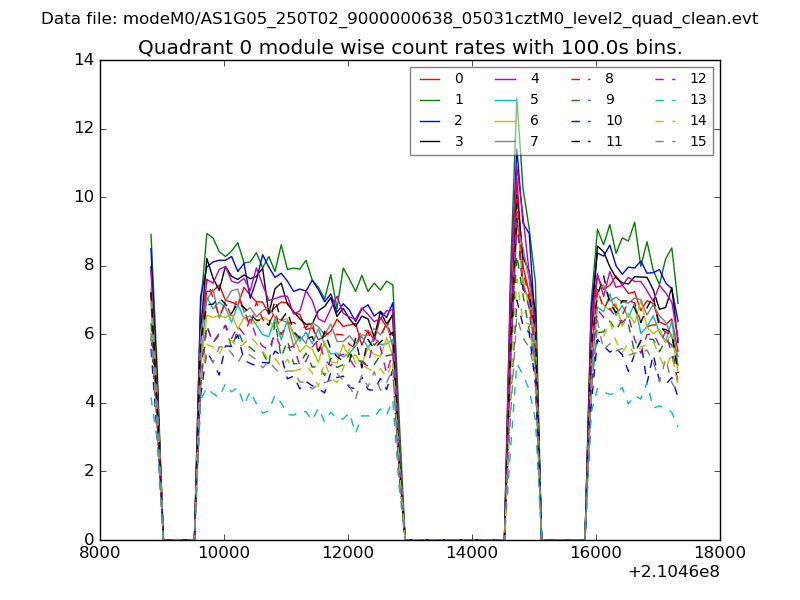 |
 |
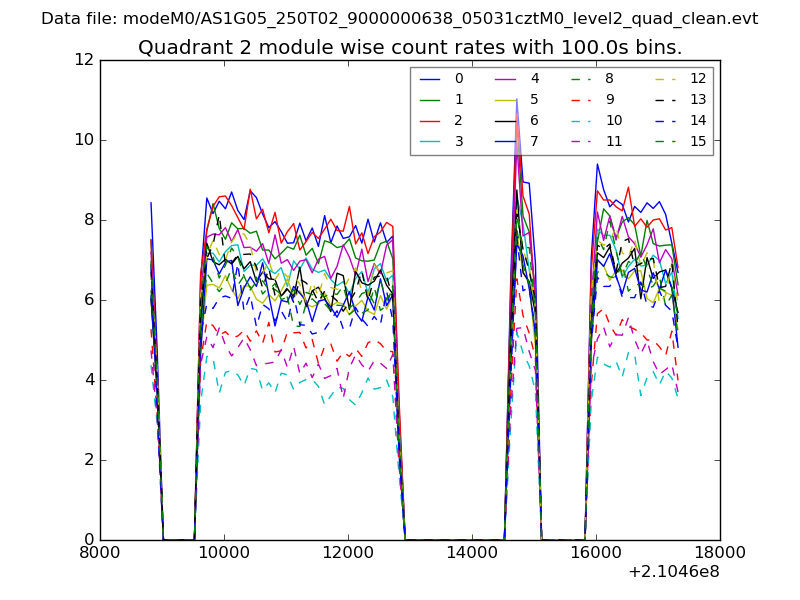
| Module-wise count rates for Quadrant B Data is divided into 100 sec bins |
 |
 |
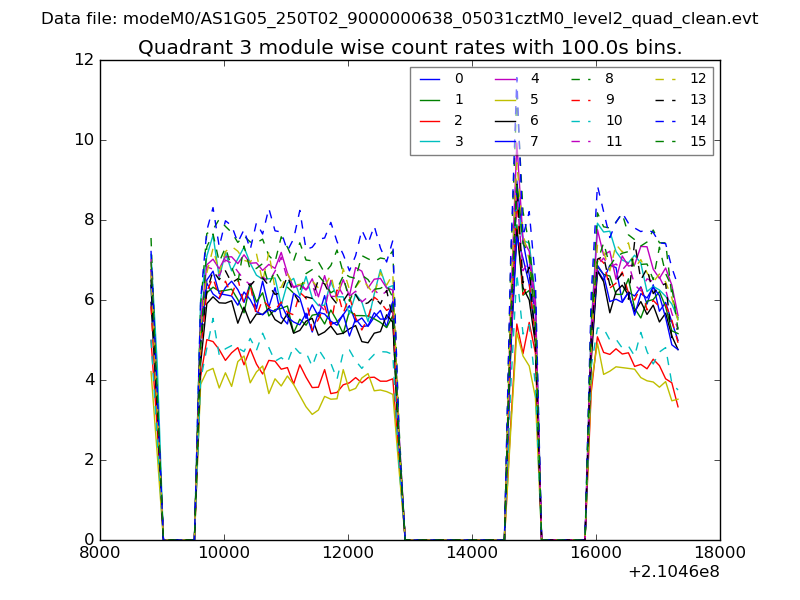
| Module-wise count rates for Quadrant C Data is divided into 100 sec bins |
 |
 |
| Module-wise count rates for Quadrant D Data is divided into 100 sec bins |
 |
 |
| Parameter | Plot |
|---|---|
| CZT HV Monitor | 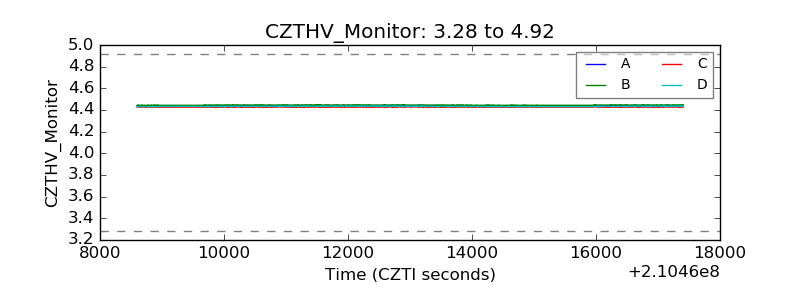 |
| D_VDD | 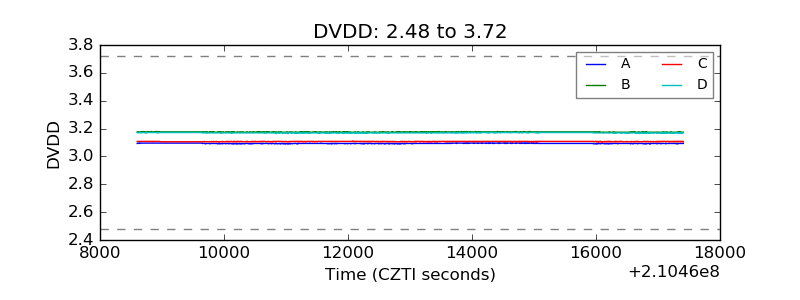 |
| Temperature 1 | 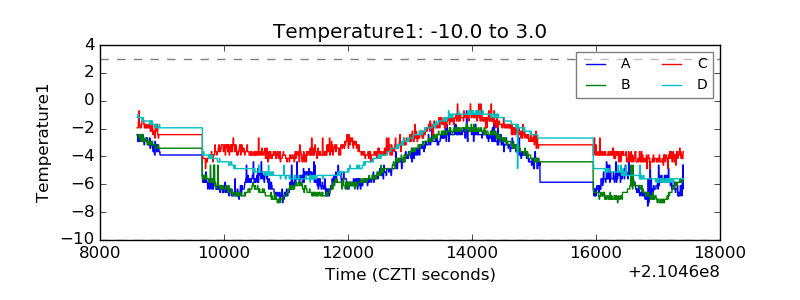 |
| Veto HV Monitor | 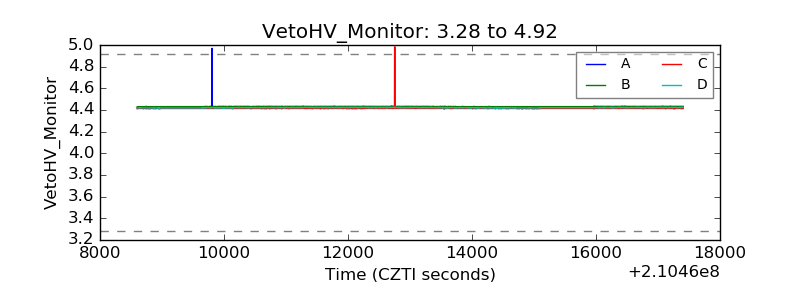 |
| Veto LLD | 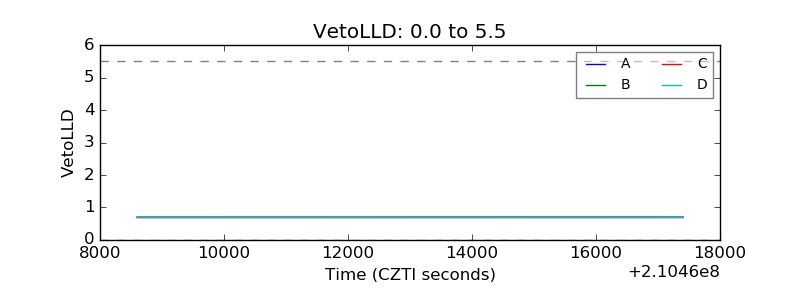 |
| Alpha Counter | 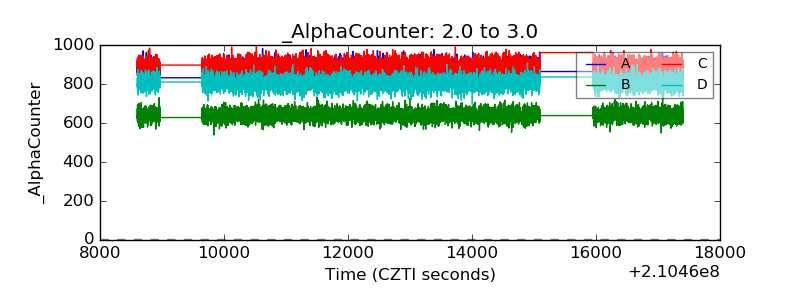 |
| _CPM_Rate | 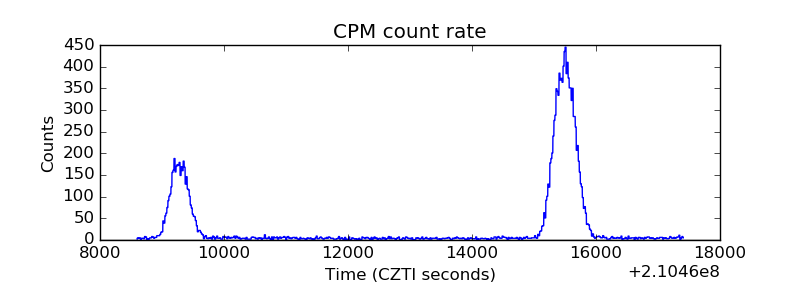 |
| CZT Counter | 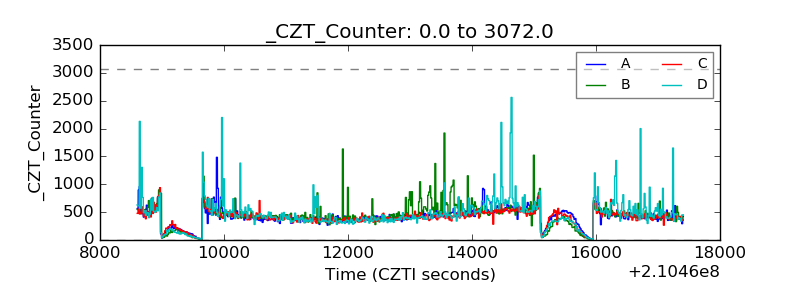 |
| +2.5 Volts monitor | 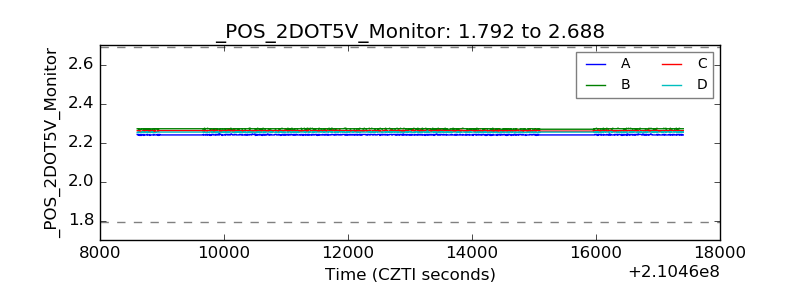 |
| +5 Volts monitor | 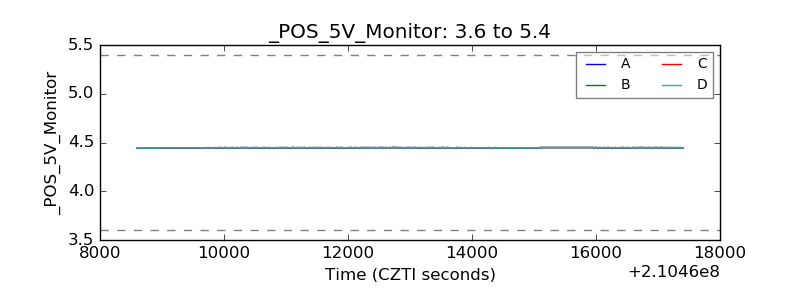 |
| _ROLL_ROT | 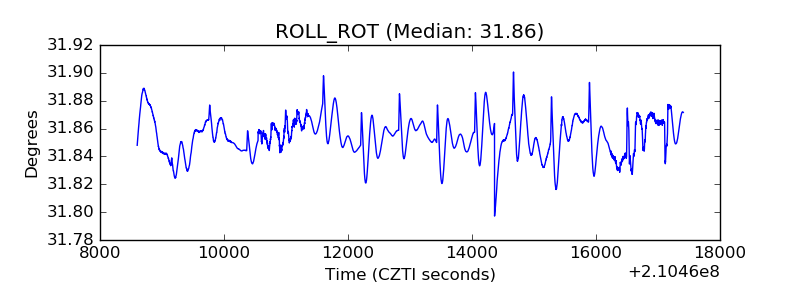 |
| _Roll_DEC | 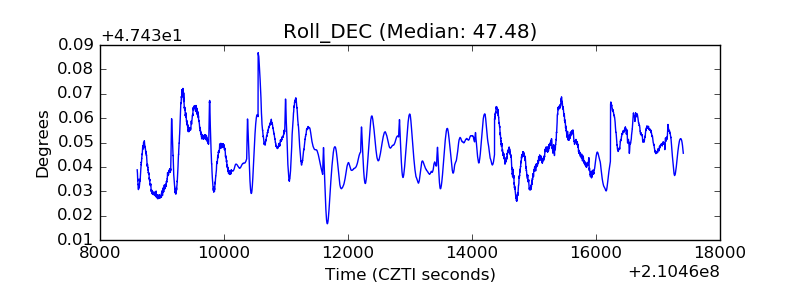 |
| _Roll_RA | 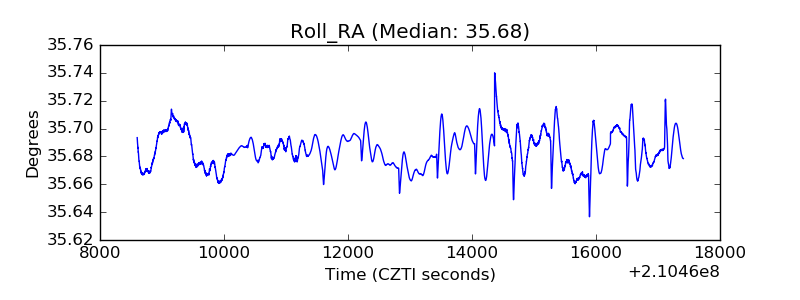 |
| Veto Counter | 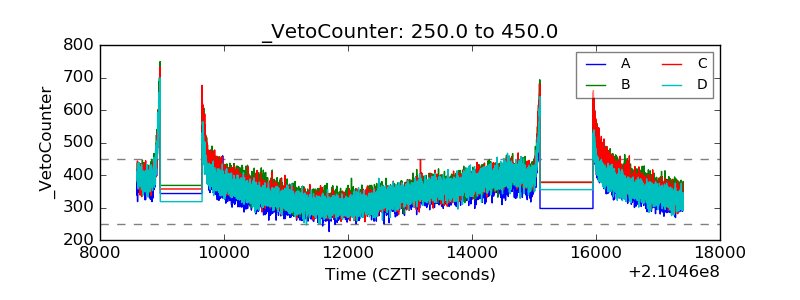 |