| Param | Original file | Final file |
|---|---|---|
| Filename | modeM0/AS1G05_250T02_9000000638_05032cztM0_level2.evt | modeM0/AS1G05_250T02_9000000638_05032cztM0_level2_quad_clean.evt |
| Size (bytes) | 506,018,880 | 94,328,640 |
| Size | 482.6 MB | 90.0 MB |
| Events in quadrant A | 3,279,321 | 590,651 |
| Events in quadrant B | 3,812,519 | 592,080 |
| Events in quadrant C | 3,222,190 | 599,669 |
| Events in quadrant D | 4,511,584 | 562,445 |
| Mode M9 | |||
|---|---|---|---|
| Quadrant | BADHDUFLAG | Total packets | Discarded packets |
| A | 0 | 19 | 0 |
| B | 0 | 19 | 0 |
| C | 0 | 19 | 0 |
| D | 0 | 19 | 0 |
| Mode SS | |||
|---|---|---|---|
| Quadrant | BADHDUFLAG | Total packets | Discarded packets |
| A | 0 | 150 | 0 |
| B | 0 | 150 | 0 |
| C | 0 | 150 | 0 |
| D | 0 | 150 | 0 |
| Mode M0 | |||
|---|---|---|---|
| Quadrant | BADHDUFLAG | Total packets | Discarded packets |
| A | 0 | 15115 | 3 |
| B | 0 | 16490 | 2 |
| C | 0 | 15005 | 2 |
| D | 0 | 18584 | 2 |
| Quadrant | Total seconds | Saturated seconds | Saturation percentage |
|---|---|---|---|
| A | 7354 | 46 | 0.625510% |
| B | 7354 | 81 | 1.101441% |
| C | 7354 | 34 | 0.462333% |
| D | 7354 | 187 | 2.542834% |
Noise dominated data is calculated using 1-second bins in cleaned event files. If a bin has >2000 counts, and if more than 50% of those come from <1% of pixels, then it is considered to be noise-dominated and hence unusable.
| Quadrant | # 1 sec bins | Bins with >0 counts | Bins with >2000 counts | High rate bins dominated by noise | Noise dominated (total time) | Noise dominated (detector-on time) | Marked lightcurve |
|---|---|---|---|---|---|---|---|
| A | 9194 | 7356 | 0 | 0 | 0.00% | 0.00% | 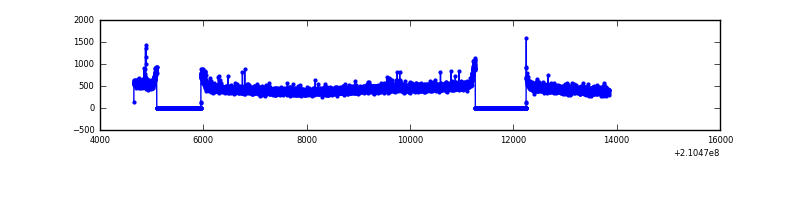 |
| B | 9194 | 7356 | 8 | 8 | 0.09% | 0.11% | 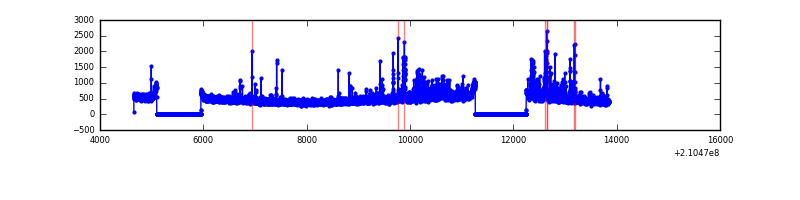 |
| C | 9194 | 7356 | 0 | 0 | 0.00% | 0.00% | 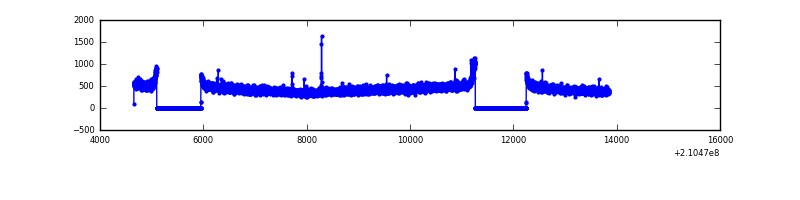 |
| D | 9194 | 7356 | 109 | 109 | 1.19% | 1.48% | 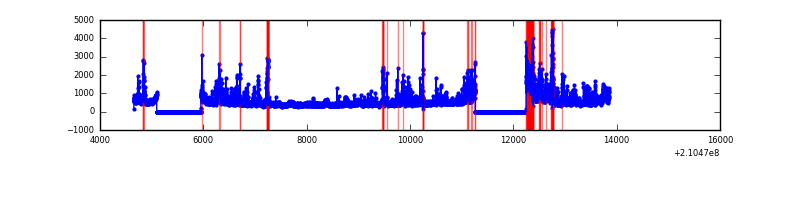 |
Top three noisy pixels from each quadrant. If the there are fewer than three noisy pixels in the level2.evt file, extra rows are filled as -1
| Pixel properties | Quadrant properties | ||||||
|---|---|---|---|---|---|---|---|
| Quadrant | DetID | PixID | Counts | Sigma | Mean | Median | Sigma |
| A | 13 | 251 | 42794 | 245.04 | 837 | 817 | 171.3 |
| A | 0 | 226 | 8278 | 43.55 | 837 | 817 | 171.3 |
| A | 12 | 194 | 8209 | 43.15 | 837 | 817 | 171.3 |
| B | 4 | 48 | 244608 | 1492.39 | 850 | 828 | 163.3 |
| B | 15 | 204 | 152072 | 925.89 | 850 | 828 | 163.3 |
| B | 10 | 247 | 60309 | 364.13 | 850 | 828 | 163.3 |
| C | 1 | 16 | 19194 | 96.99 | 819 | 822 | 189.4 |
| C | 9 | 54 | 9213 | 44.3 | 819 | 822 | 189.4 |
| C | 13 | 61 | 6662 | 30.83 | 819 | 822 | 189.4 |
| D | 13 | 235 | 556823 | 2799.37 | 804 | 781 | 198.6 |
| D | 12 | 227 | 396123 | 1990.33 | 804 | 781 | 198.6 |
| D | 12 | 233 | 352387 | 1770.14 | 804 | 781 | 198.6 |
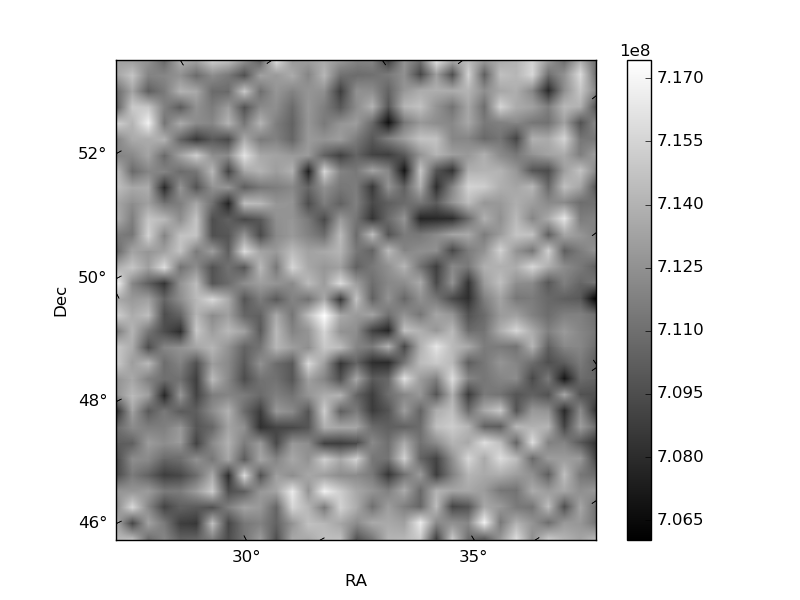
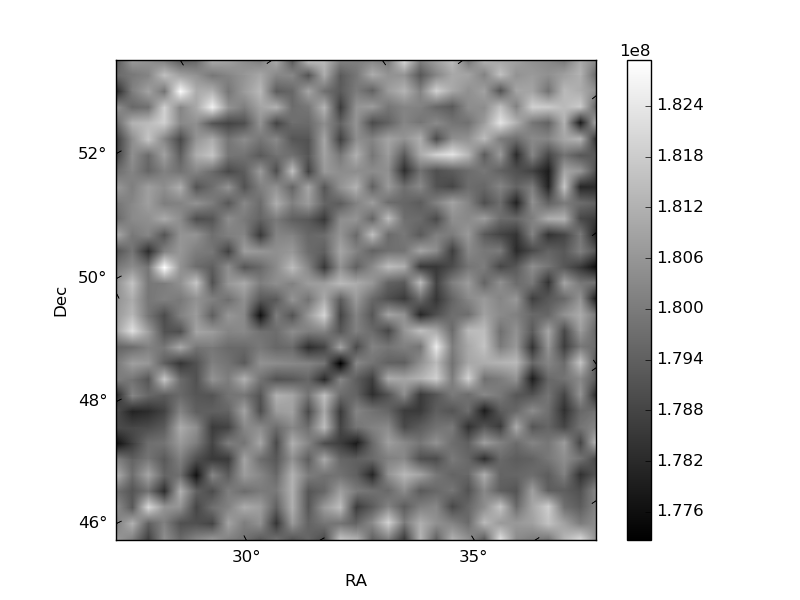
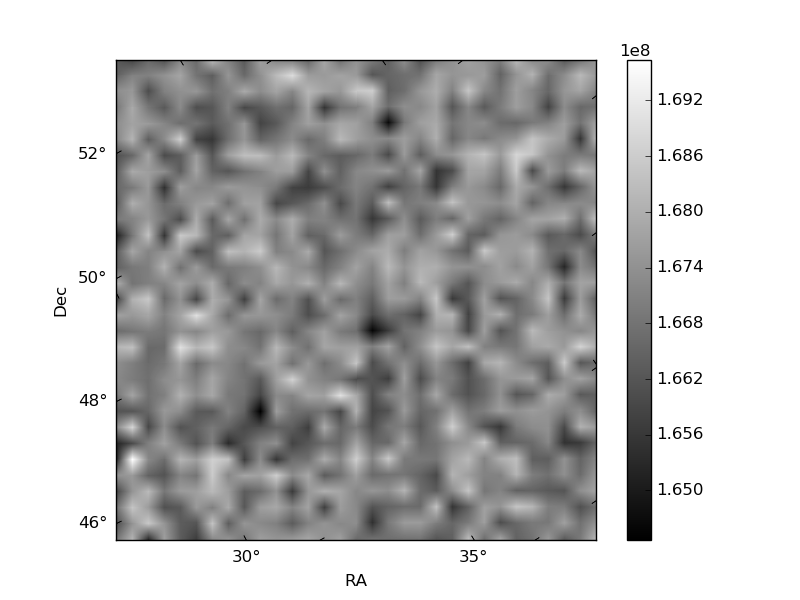
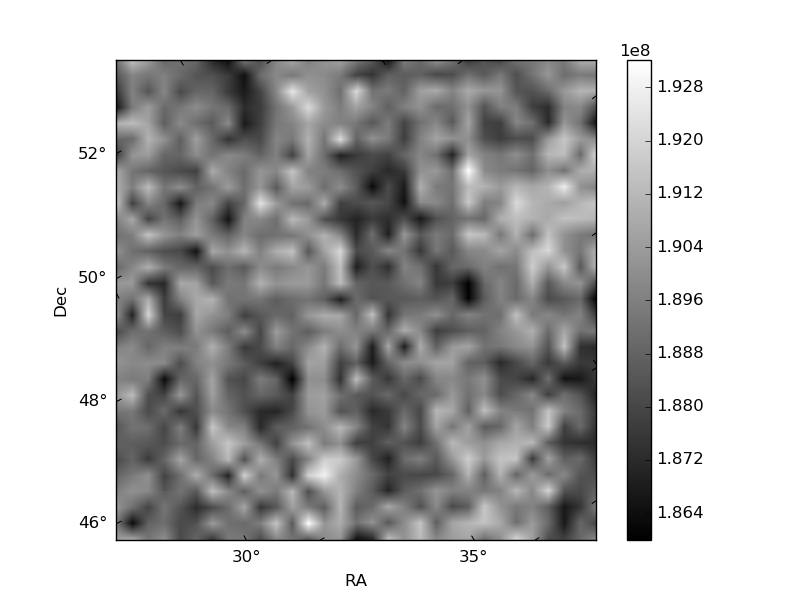
Histogram calculated using DETX and DETY for each event in the final _common_clean file
| Quadrant A | 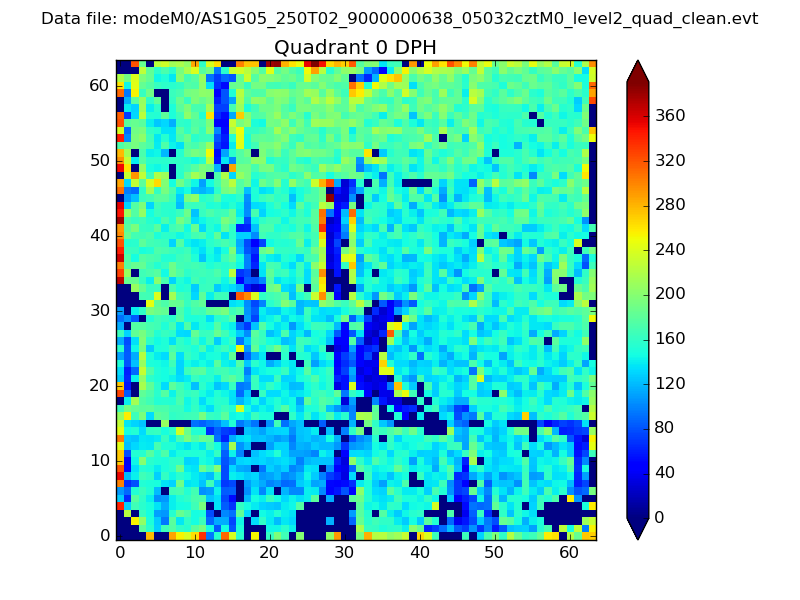 |
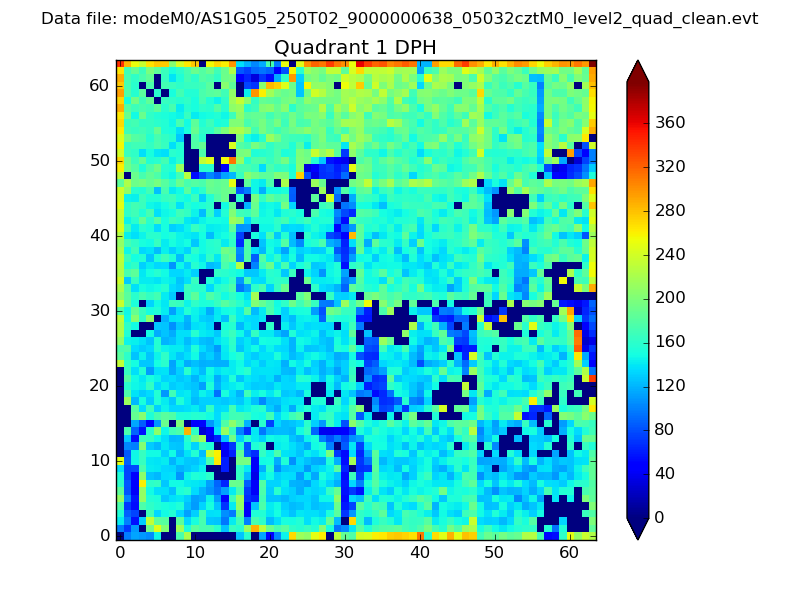 |
Quadrant B |
|---|---|---|---|
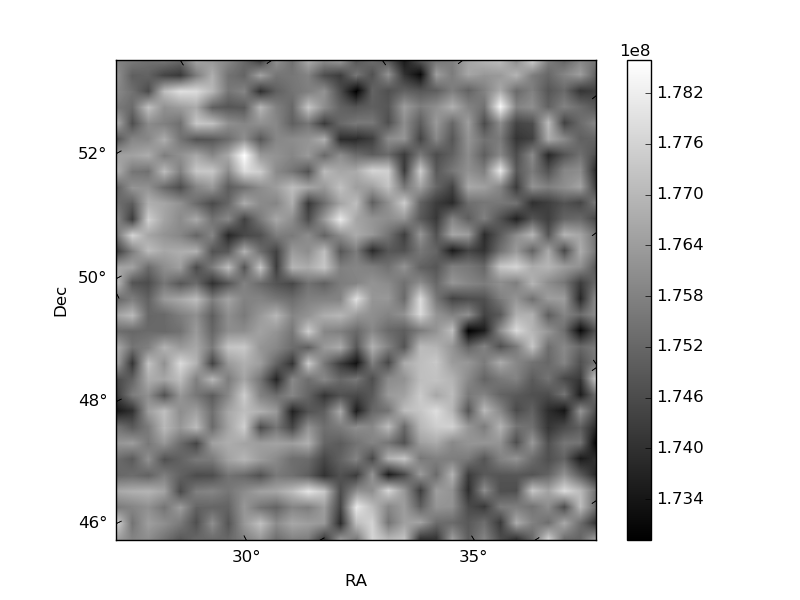
| Quadrant D | 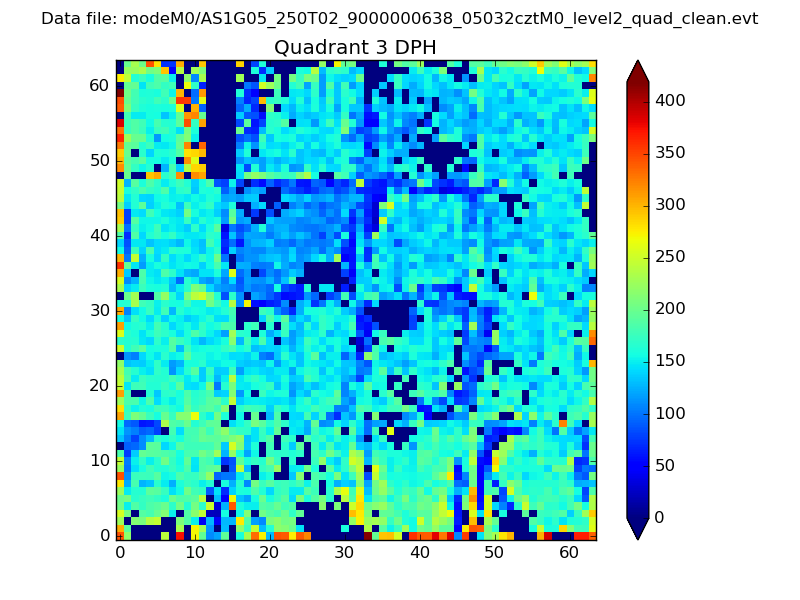 |
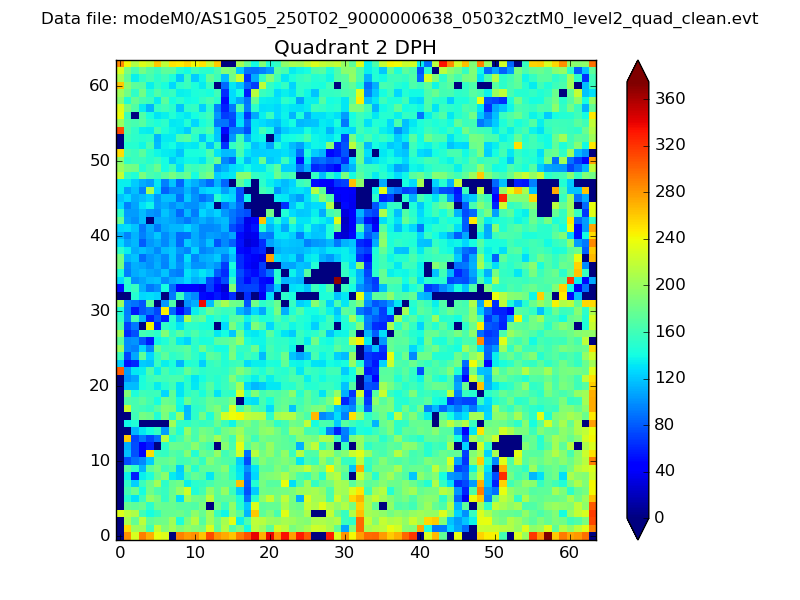 |
Quadrant C |
| Plot type | Count rate plots | Images |
|---|---|---|
| Comparison with Poisson distribution Blue bars denote a histogram of data divided into 1 sec bins. Red curve is a Poisson curve with rate = median count rate of data. |
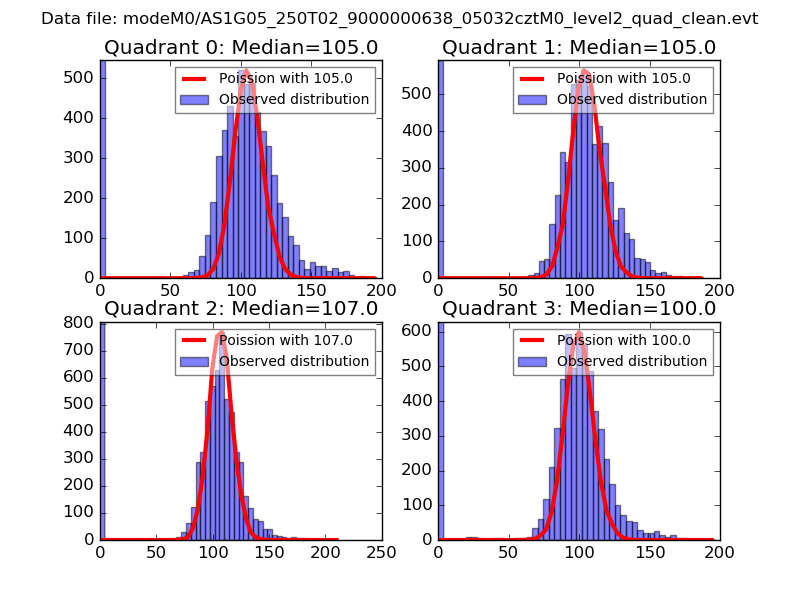 |
 |
| Quadrant-wise count rates Data is divided into 100 sec bins |
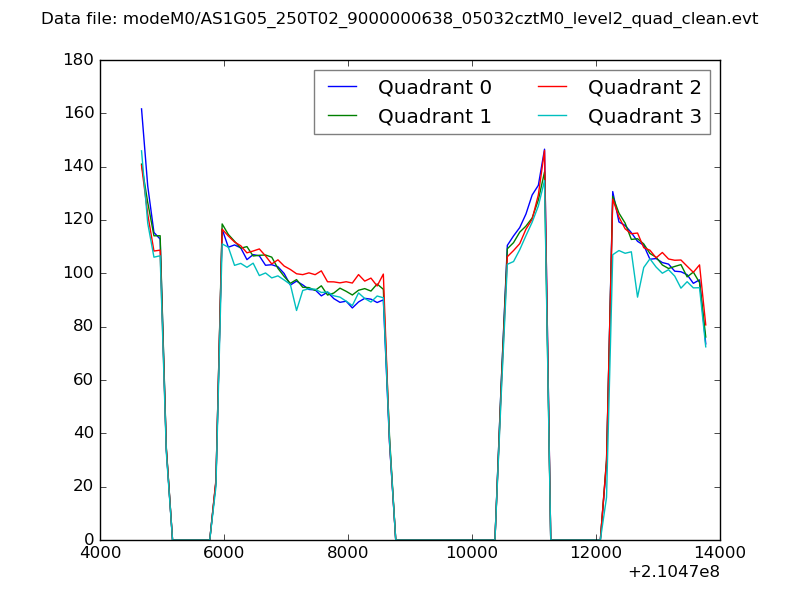 |
|
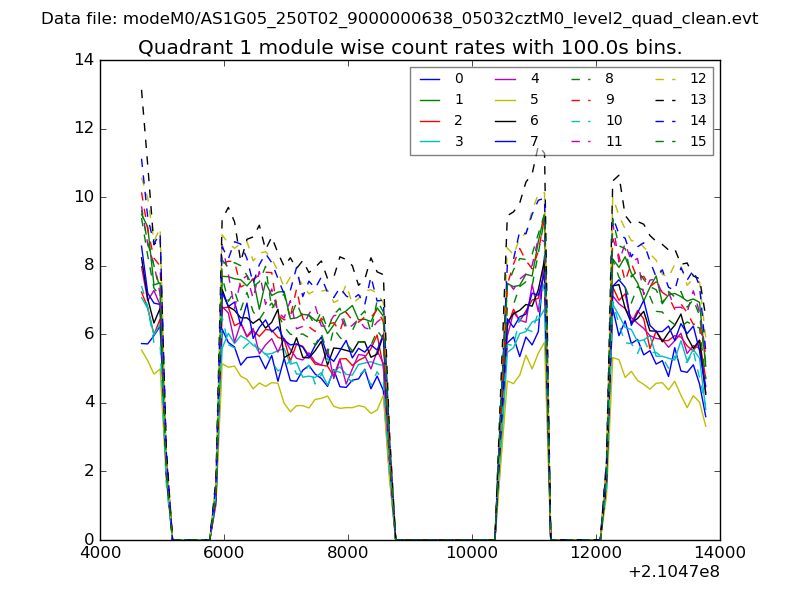
| Module-wise count rates for Quadrant A Data is divided into 100 sec bins |
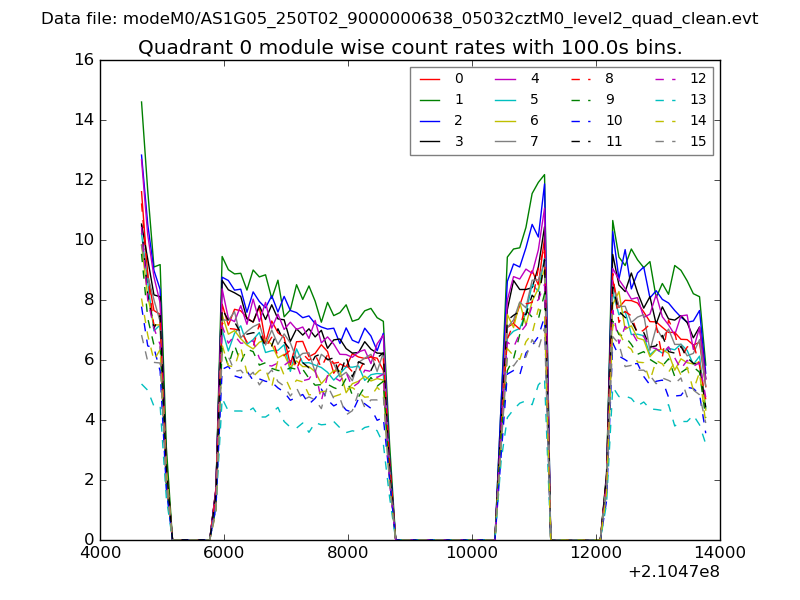 |
 |
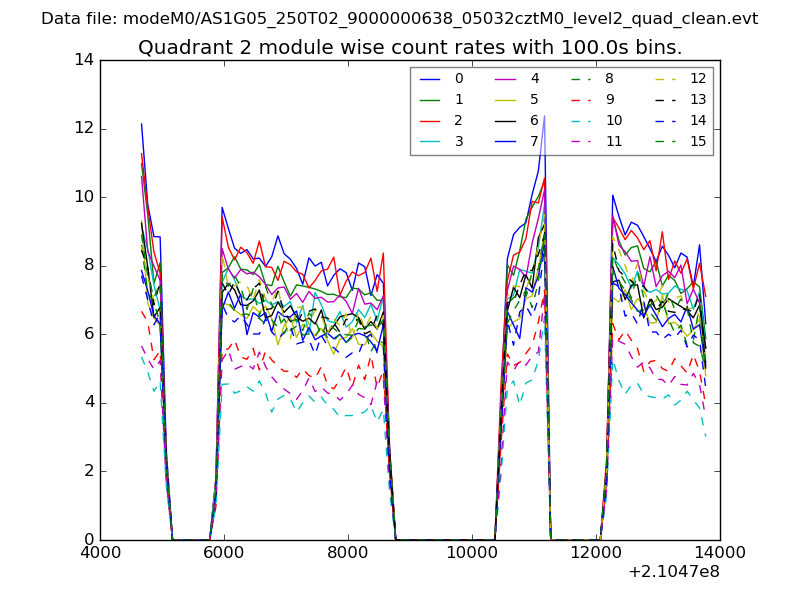
| Module-wise count rates for Quadrant B Data is divided into 100 sec bins |
 |
 |
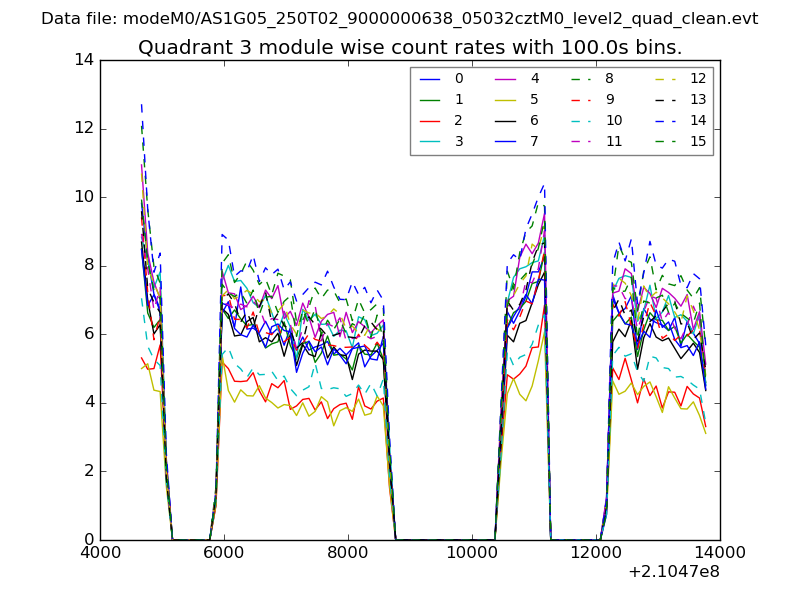
| Module-wise count rates for Quadrant C Data is divided into 100 sec bins |
 |
 |
| Module-wise count rates for Quadrant D Data is divided into 100 sec bins |
 |
 |
| Parameter | Plot |
|---|---|
| CZT HV Monitor | 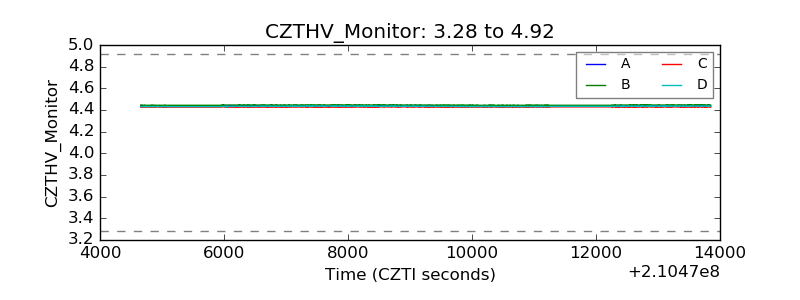 |
| D_VDD | 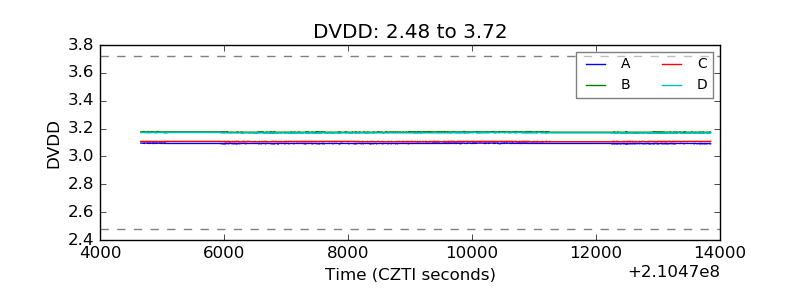 |
| Temperature 1 | 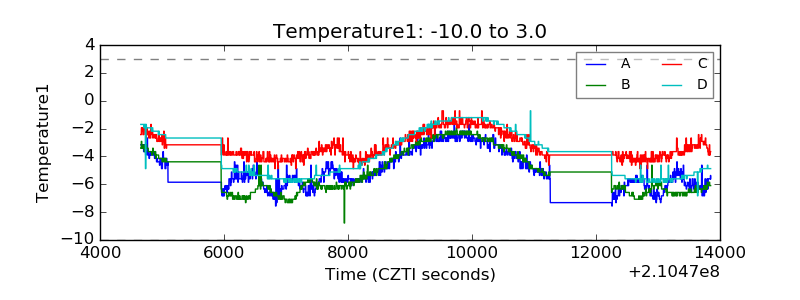 |
| Veto HV Monitor | 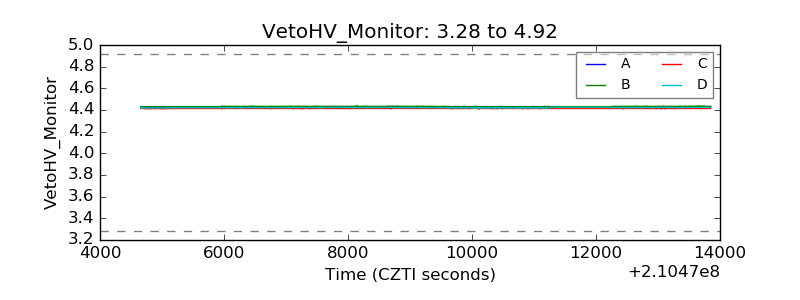 |
| Veto LLD | 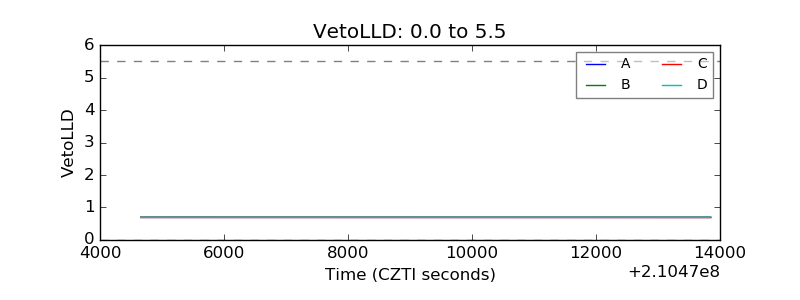 |
| Alpha Counter | 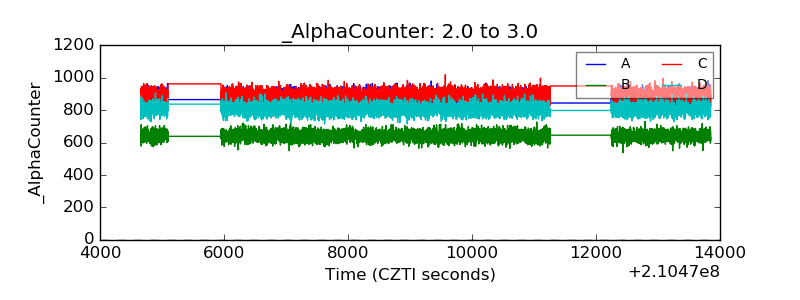 |
| _CPM_Rate | 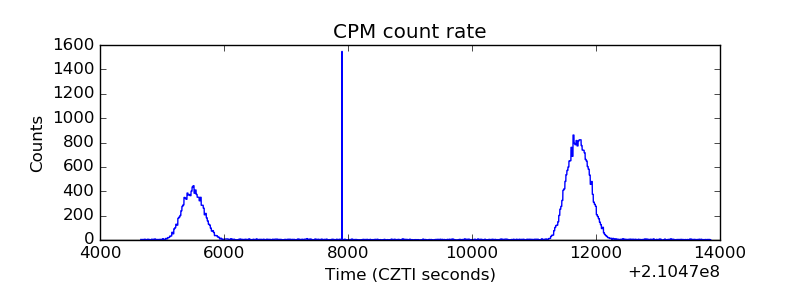 |
| CZT Counter | 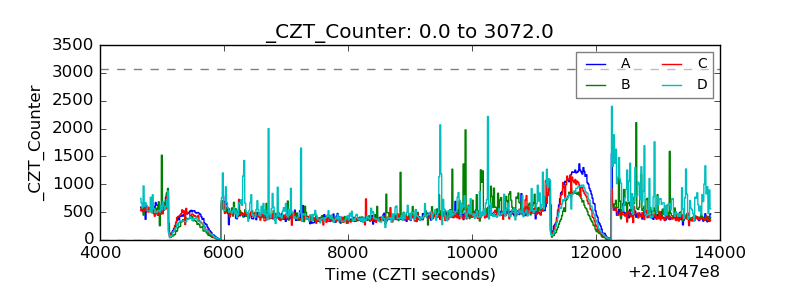 |
| +2.5 Volts monitor |  |
| +5 Volts monitor |  |
| _ROLL_ROT | 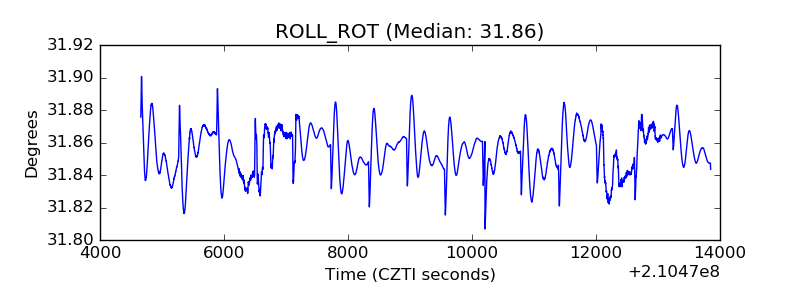 |
| _Roll_DEC | 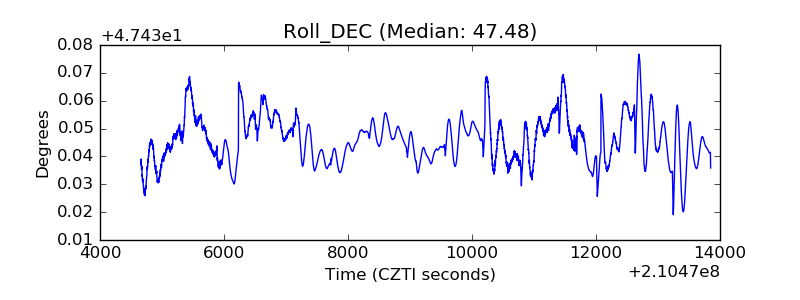 |
| _Roll_RA | 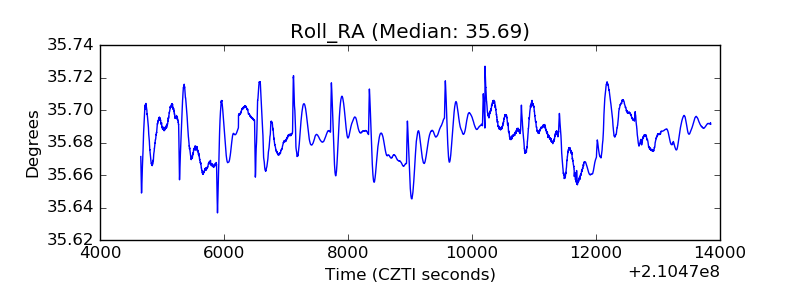 |
| Veto Counter | 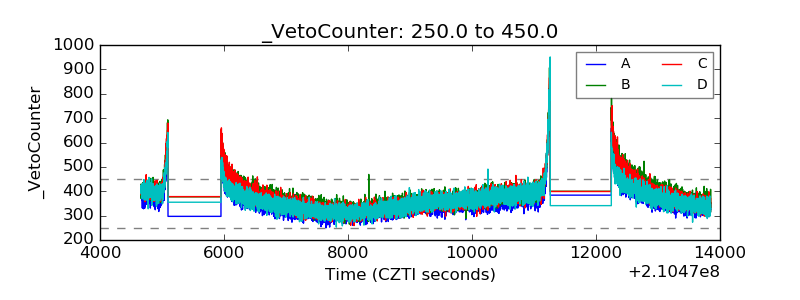 |