| Param | Original file | Final file |
|---|---|---|
| Filename | modeM0/AS1G05_250T02_9000000638_05036cztM0_level2.evt | modeM0/AS1G05_250T02_9000000638_05036cztM0_level2_quad_clean.evt |
| Size (bytes) | 733,625,280 | 124,588,800 |
| Size | 699.6 MB | 118.8 MB |
| Events in quadrant A | 4,974,508 | 770,145 |
| Events in quadrant B | 5,508,421 | 774,290 |
| Events in quadrant C | 4,729,591 | 773,131 |
| Events in quadrant D | 6,293,293 | 727,574 |
| Mode M9 | |||
|---|---|---|---|
| Quadrant | BADHDUFLAG | Total packets | Discarded packets |
| A | 0 | 25 | 0 |
| B | 0 | 25 | 0 |
| C | 0 | 25 | 0 |
| D | 0 | 25 | 0 |
| Mode SS | |||
|---|---|---|---|
| Quadrant | BADHDUFLAG | Total packets | Discarded packets |
| A | 0 | 214 | 0 |
| B | 0 | 214 | 0 |
| C | 0 | 214 | 0 |
| D | 0 | 214 | 0 |
| Mode M0 | |||
|---|---|---|---|
| Quadrant | BADHDUFLAG | Total packets | Discarded packets |
| A | 0 | 21710 | 3 |
| B | 0 | 23040 | 2 |
| C | 0 | 21395 | 2 |
| D | 0 | 25950 | 2 |
| Quadrant | Total seconds | Saturated seconds | Saturation percentage |
|---|---|---|---|
| A | 10509 | 117 | 1.113331% |
| B | 10509 | 137 | 1.303644% |
| C | 10509 | 66 | 0.628033% |
| D | 10509 | 358 | 3.406604% |
Noise dominated data is calculated using 1-second bins in cleaned event files. If a bin has >2000 counts, and if more than 50% of those come from <1% of pixels, then it is considered to be noise-dominated and hence unusable.
| Quadrant | # 1 sec bins | Bins with >0 counts | Bins with >2000 counts | High rate bins dominated by noise | Noise dominated (total time) | Noise dominated (detector-on time) | Marked lightcurve |
|---|---|---|---|---|---|---|---|
| A | 13009 | 10511 | 3 | 3 | 0.02% | 0.03% | 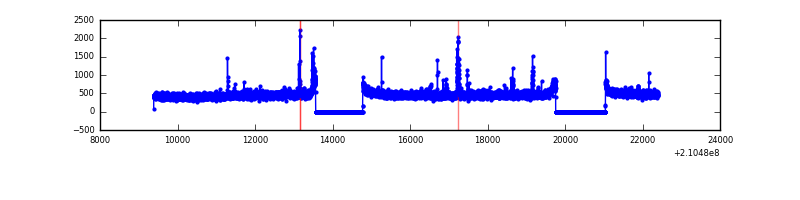 |
| B | 13009 | 10511 | 4 | 4 | 0.03% | 0.04% | 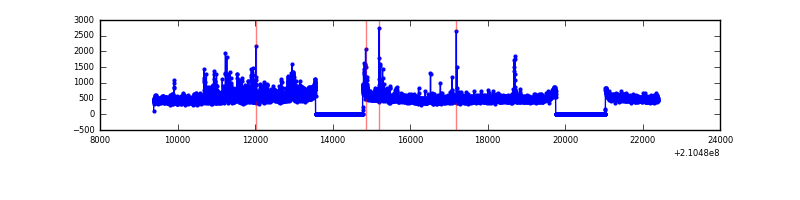 |
| C | 13009 | 10511 | 0 | 0 | 0.00% | 0.00% | 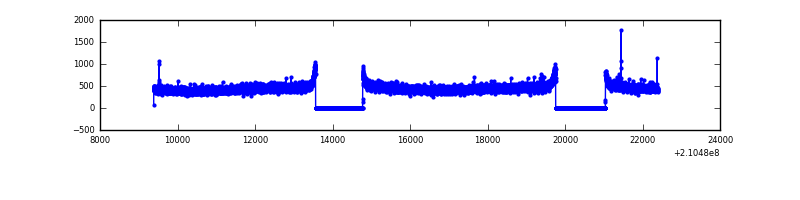 |
| D | 13009 | 10511 | 203 | 203 | 1.56% | 1.93% |  |
Top three noisy pixels from each quadrant. If the there are fewer than three noisy pixels in the level2.evt file, extra rows are filled as -1
| Pixel properties | Quadrant properties | ||||||
|---|---|---|---|---|---|---|---|
| Quadrant | DetID | PixID | Counts | Sigma | Mean | Median | Sigma |
| A | 15 | 174 | 45073 | 172.02 | 1259 | 1232 | 254.9 |
| A | 0 | 50 | 33168 | 125.31 | 1259 | 1232 | 254.9 |
| A | 0 | 247 | 29203 | 109.75 | 1259 | 1232 | 254.9 |
| B | 15 | 204 | 327418 | 1365.38 | 1261 | 1231 | 238.9 |
| B | 4 | 48 | 173642 | 721.69 | 1261 | 1231 | 238.9 |
| B | 0 | 219 | 81241 | 334.91 | 1261 | 1231 | 238.9 |
| C | 9 | 54 | 14735 | 49.27 | 1206 | 1213 | 274.5 |
| C | 1 | 16 | 10535 | 33.96 | 1206 | 1213 | 274.5 |
| C | 13 | 61 | 9831 | 31.4 | 1206 | 1213 | 274.5 |
| D | 13 | 235 | 679512 | 2331.49 | 1202 | 1163 | 291.0 |
| D | 12 | 227 | 532951 | 1827.76 | 1202 | 1163 | 291.0 |
| D | 12 | 233 | 295212 | 1010.65 | 1202 | 1163 | 291.0 |
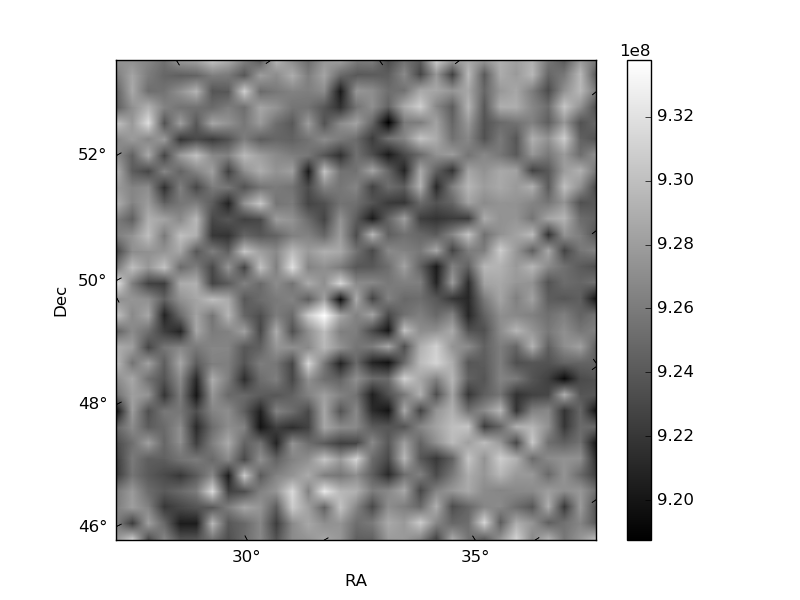
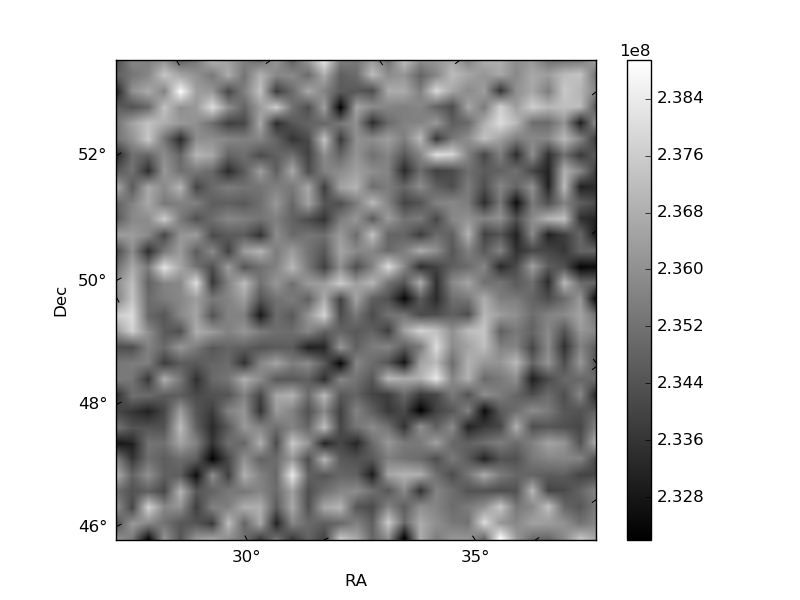
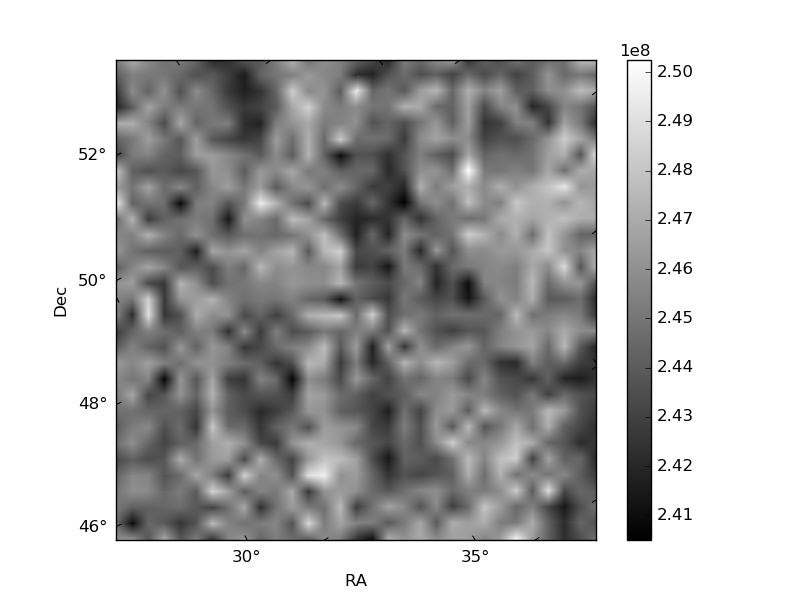
Histogram calculated using DETX and DETY for each event in the final _common_clean file
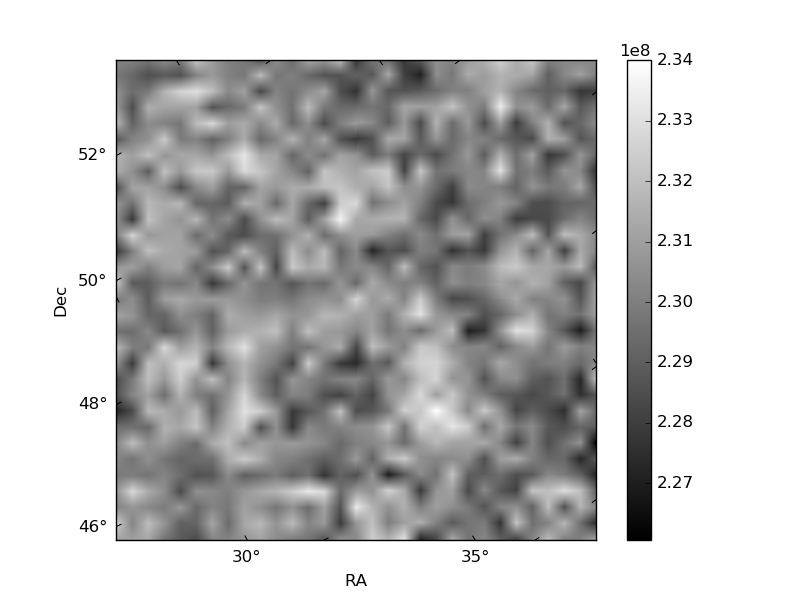
| Quadrant A | 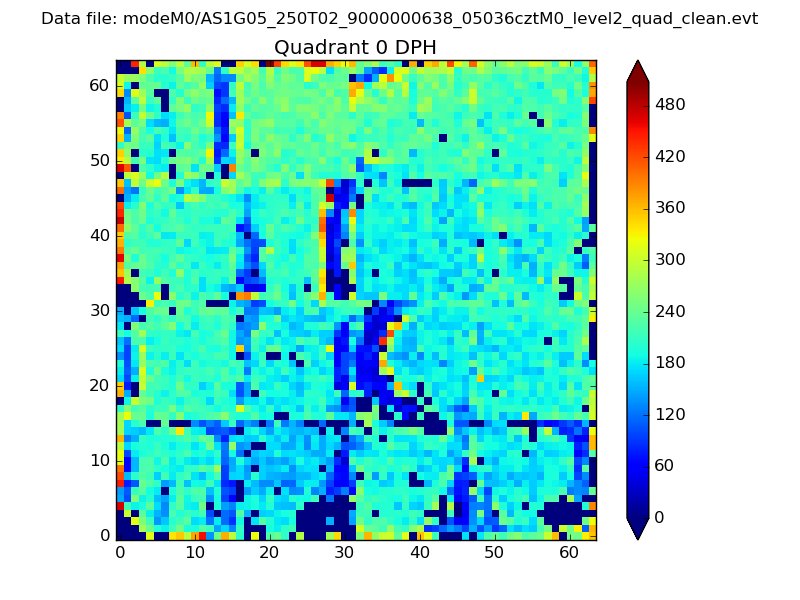 |
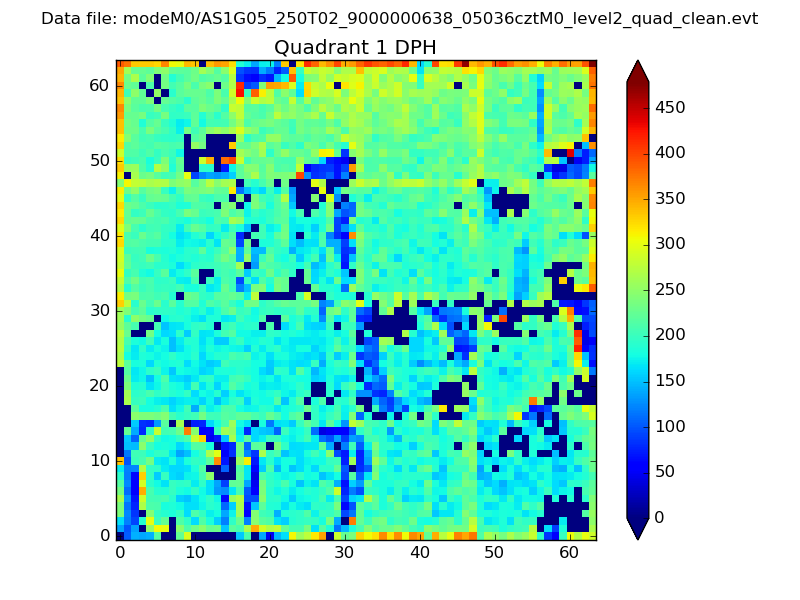 |
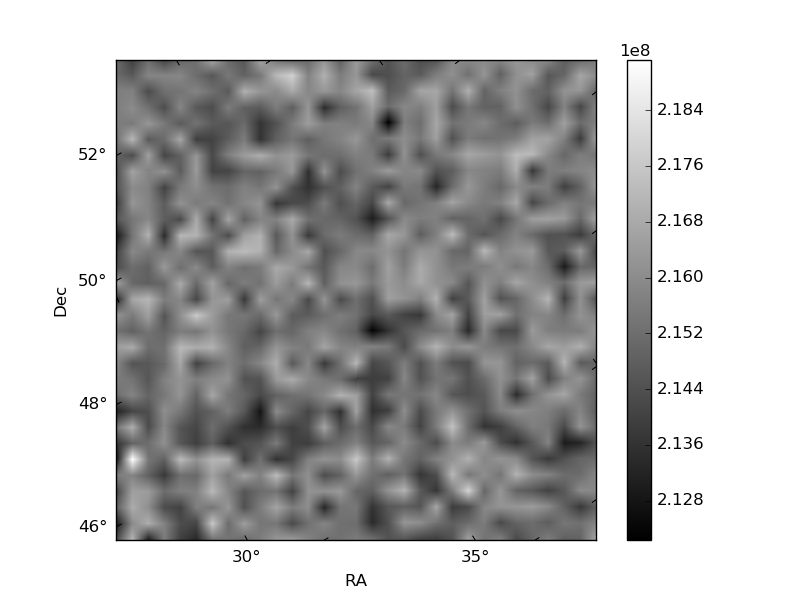
Quadrant B |
|---|---|---|---|
| Quadrant D | 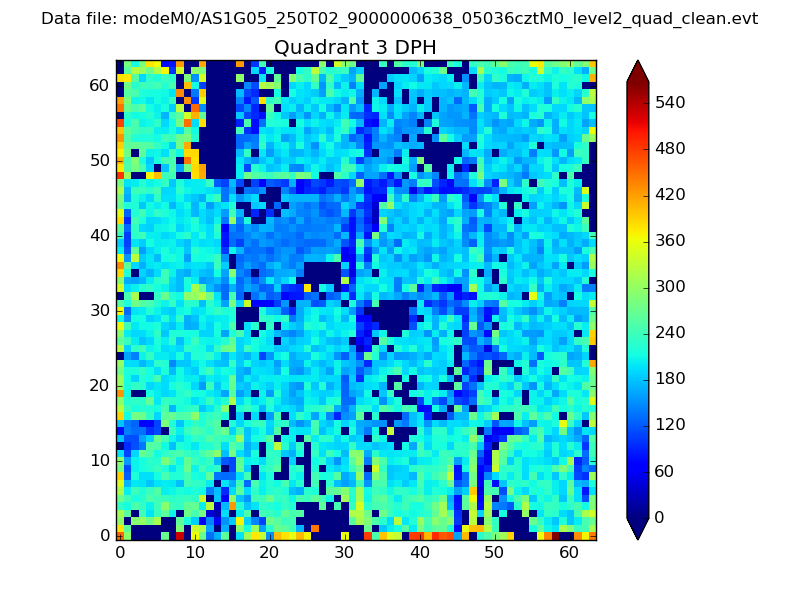 |
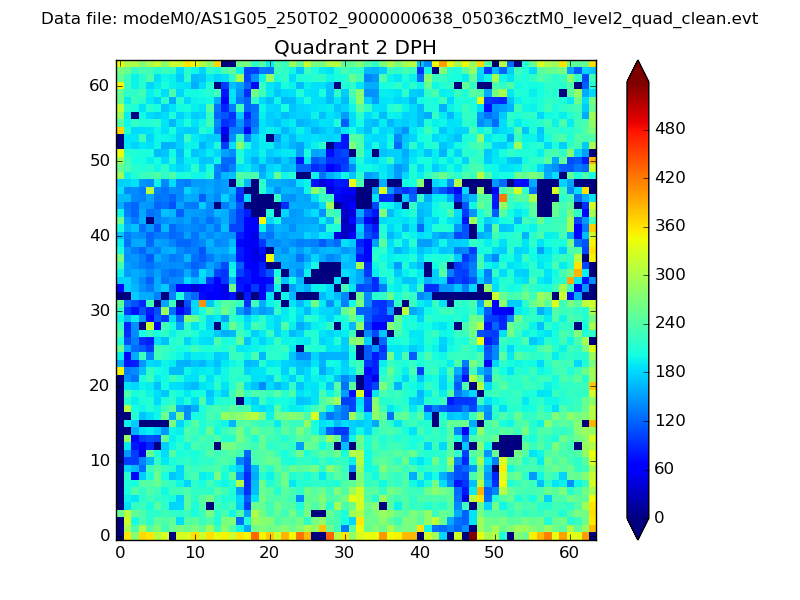 |
Quadrant C |
| Plot type | Count rate plots | Images |
|---|---|---|
| Comparison with Poisson distribution Blue bars denote a histogram of data divided into 1 sec bins. Red curve is a Poisson curve with rate = median count rate of data. |
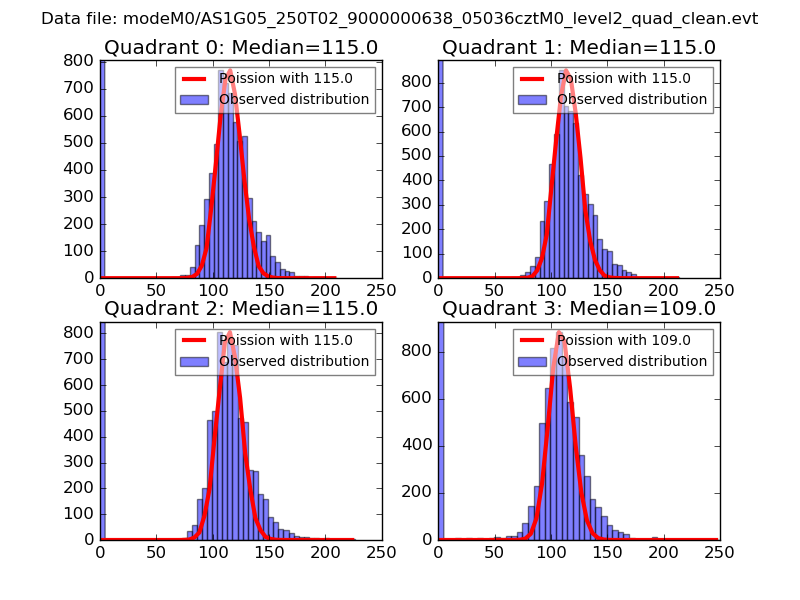 |
 |
| Quadrant-wise count rates Data is divided into 100 sec bins |
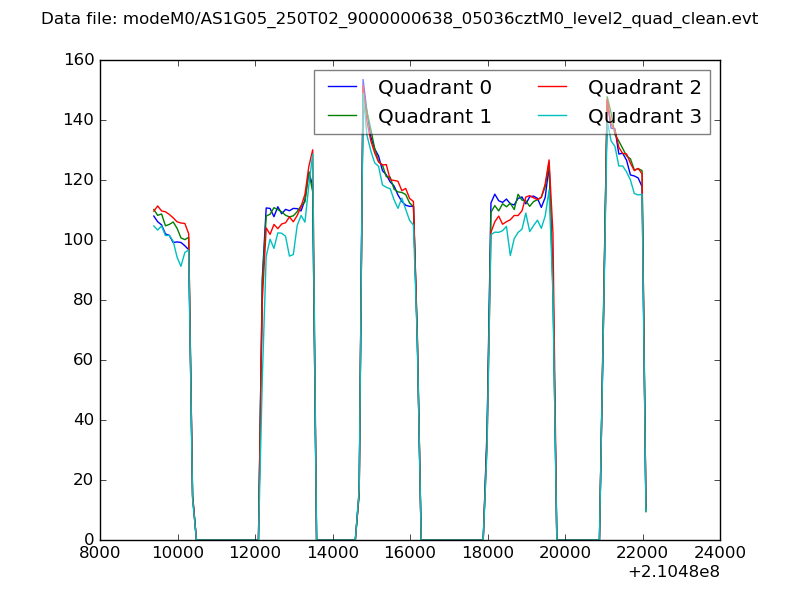 |
|
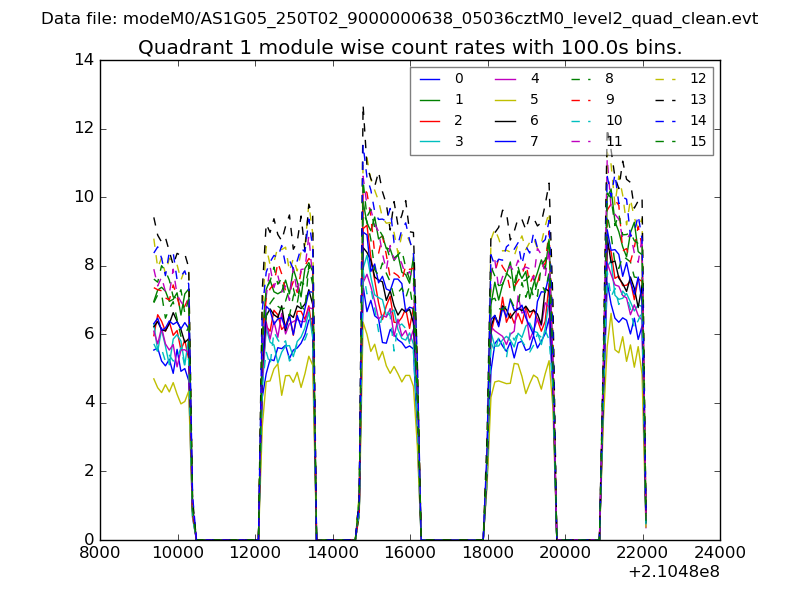
| Module-wise count rates for Quadrant A Data is divided into 100 sec bins |
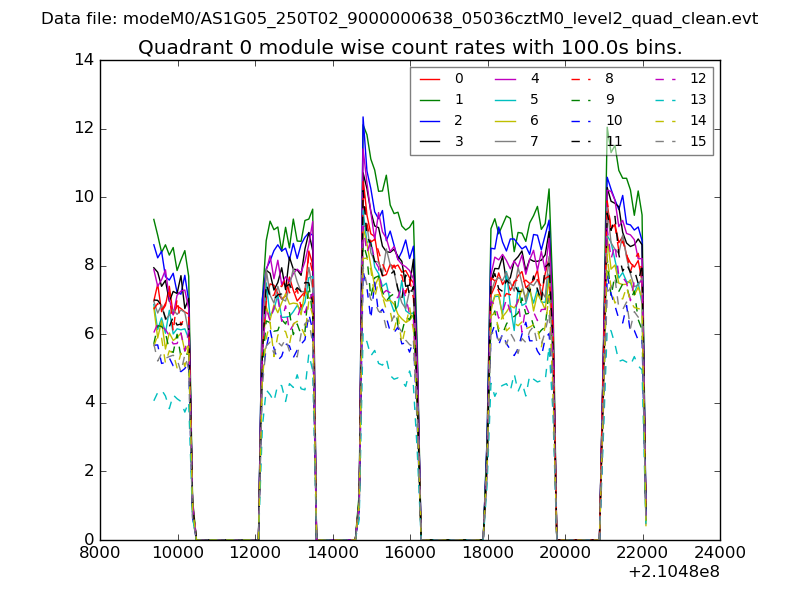 |
 |
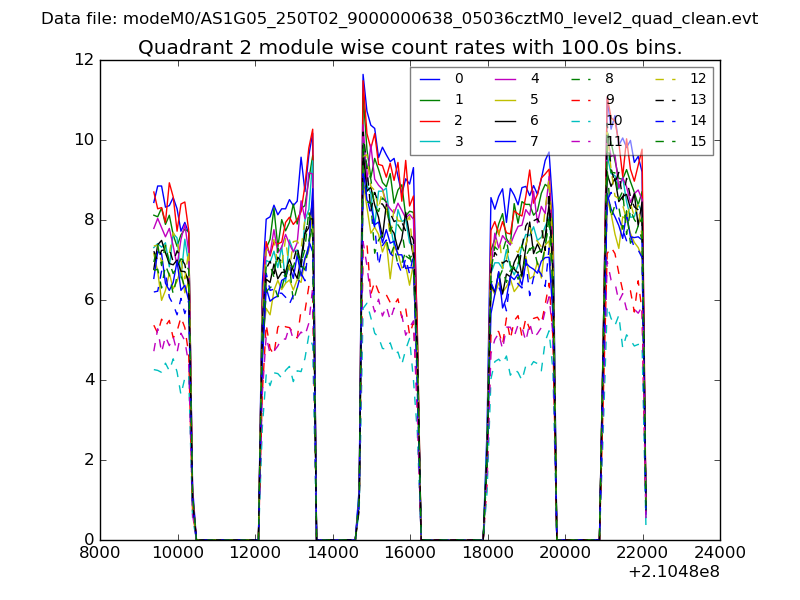
| Module-wise count rates for Quadrant B Data is divided into 100 sec bins |
 |
 |
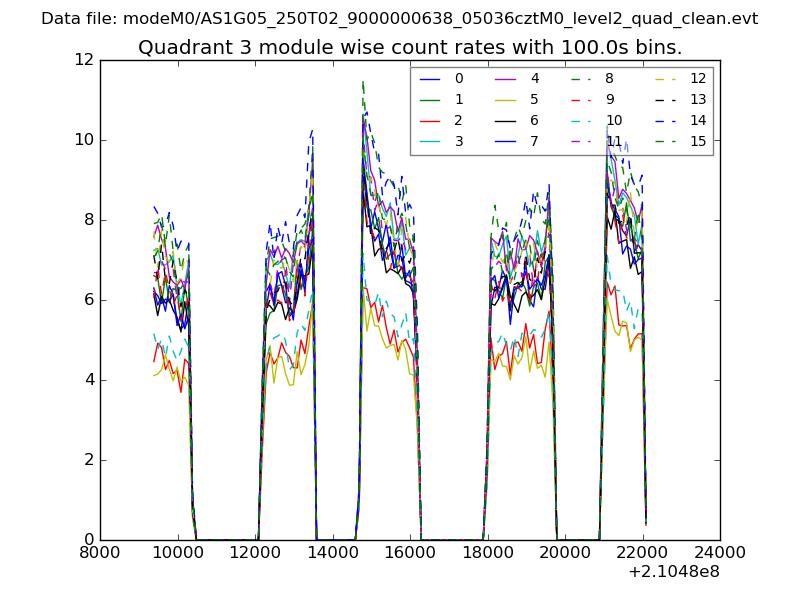
| Module-wise count rates for Quadrant C Data is divided into 100 sec bins |
 |
 |
| Module-wise count rates for Quadrant D Data is divided into 100 sec bins |
 |
 |
| Parameter | Plot |
|---|---|
| CZT HV Monitor | 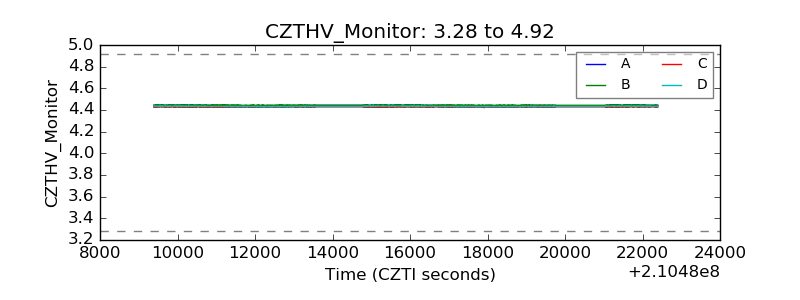 |
| D_VDD | 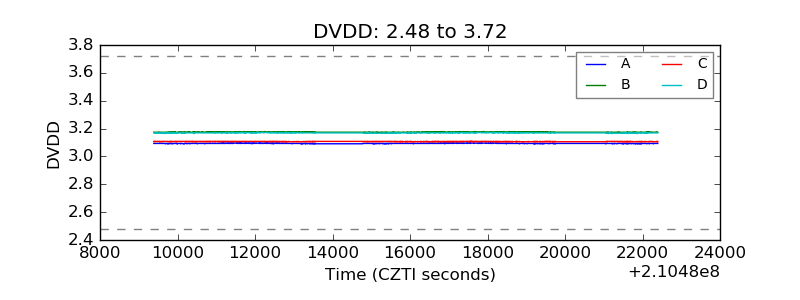 |
| Temperature 1 | 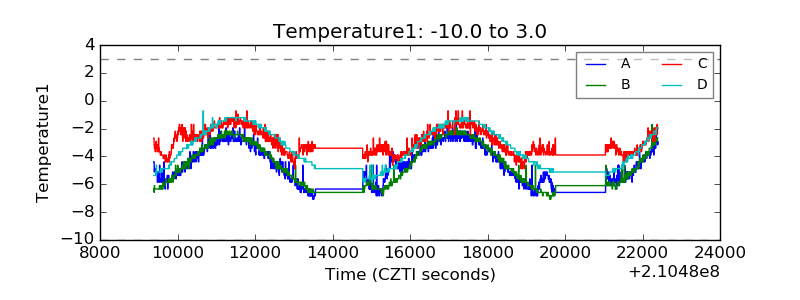 |
| Veto HV Monitor | 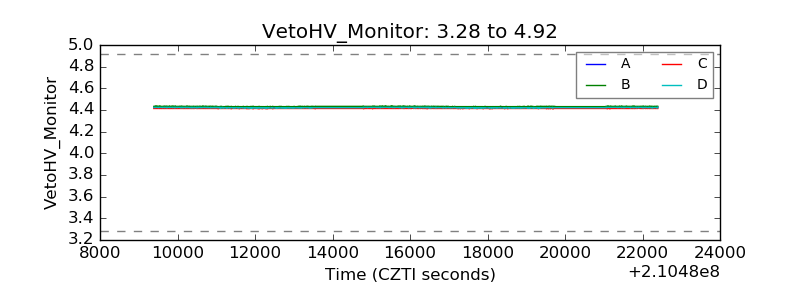 |
| Veto LLD | 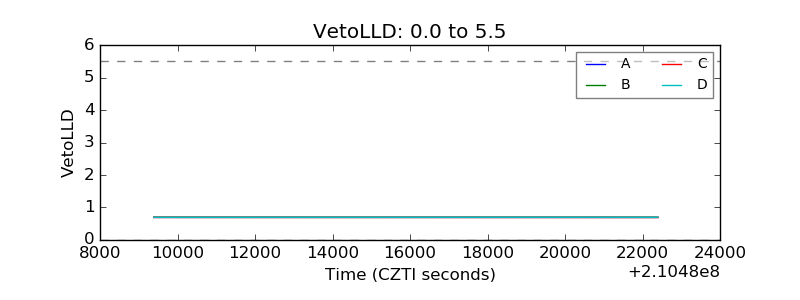 |
| Alpha Counter | 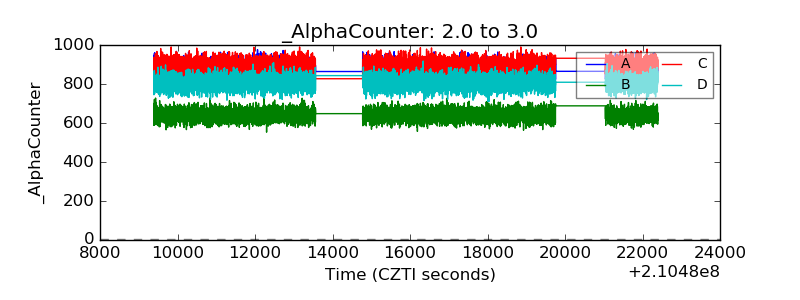 |
| _CPM_Rate | 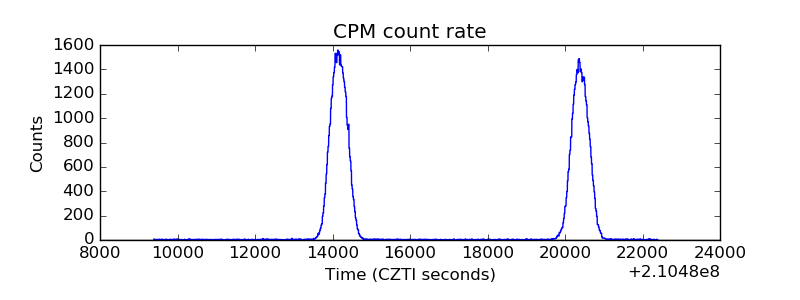 |
| CZT Counter | 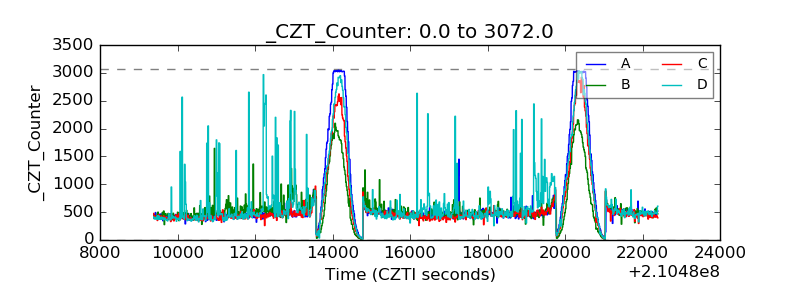 |
| +2.5 Volts monitor |  |
| +5 Volts monitor |  |
| _ROLL_ROT | 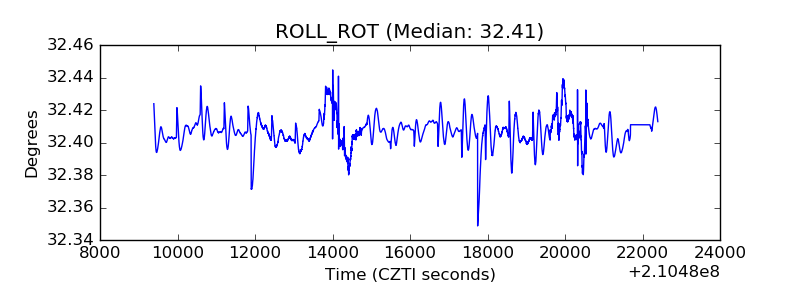 |
| _Roll_DEC | 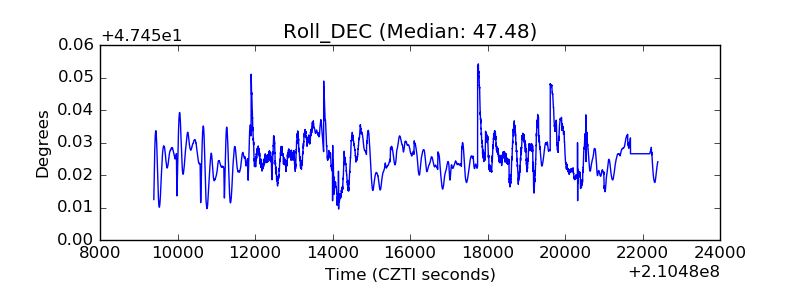 |
| _Roll_RA | 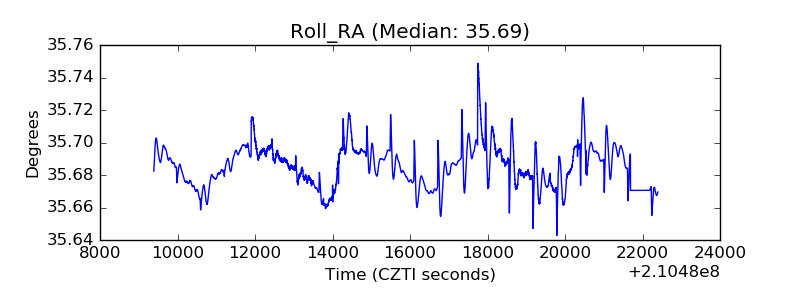 |
| Veto Counter | 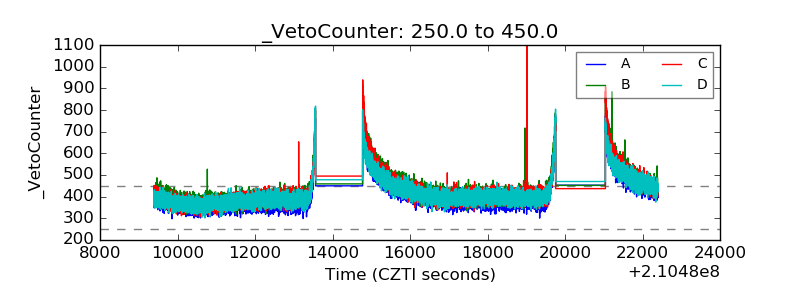 |