| Param | Original file | Final file |
|---|---|---|
| Filename | modeM0/AS1G05_250T02_9000000638_05038cztM0_level2.evt | modeM0/AS1G05_250T02_9000000638_05038cztM0_level2_quad_clean.evt |
| Size (bytes) | 481,726,080 | 63,645,120 |
| Size | 459.4 MB | 60.7 MB |
| Events in quadrant A | 3,052,620 | 374,963 |
| Events in quadrant B | 3,227,672 | 376,716 |
| Events in quadrant C | 2,939,686 | 374,816 |
| Events in quadrant D | 4,933,137 | 352,347 |
| Mode M9 | |||
|---|---|---|---|
| Quadrant | BADHDUFLAG | Total packets | Discarded packets |
| A | 0 | 11 | 0 |
| B | 0 | 11 | 0 |
| C | 0 | 11 | 0 |
| D | 0 | 11 | 0 |
| Mode SS | |||
|---|---|---|---|
| Quadrant | BADHDUFLAG | Total packets | Discarded packets |
| A | 0 | 132 | 0 |
| B | 0 | 132 | 0 |
| C | 0 | 132 | 0 |
| D | 0 | 132 | 0 |
| Mode M0 | |||
|---|---|---|---|
| Quadrant | BADHDUFLAG | Total packets | Discarded packets |
| A | 0 | 13263 | 3 |
| B | 0 | 13510 | 2 |
| C | 0 | 13105 | 2 |
| D | 0 | 19092 | 2 |
| Quadrant | Total seconds | Saturated seconds | Saturation percentage |
|---|---|---|---|
| A | 6415 | 120 | 1.870616% |
| B | 6415 | 128 | 1.995323% |
| C | 6415 | 85 | 1.325019% |
| D | 6415 | 287 | 4.473889% |
Noise dominated data is calculated using 1-second bins in cleaned event files. If a bin has >2000 counts, and if more than 50% of those come from <1% of pixels, then it is considered to be noise-dominated and hence unusable.
| Quadrant | # 1 sec bins | Bins with >0 counts | Bins with >2000 counts | High rate bins dominated by noise | Noise dominated (total time) | Noise dominated (detector-on time) | Marked lightcurve |
|---|---|---|---|---|---|---|---|
| A | 7585 | 6417 | 1 | 1 | 0.01% | 0.02% |  |
| B | 7585 | 6417 | 8 | 8 | 0.11% | 0.12% |  |
| C | 7585 | 6417 | 0 | 0 | 0.00% | 0.00% | 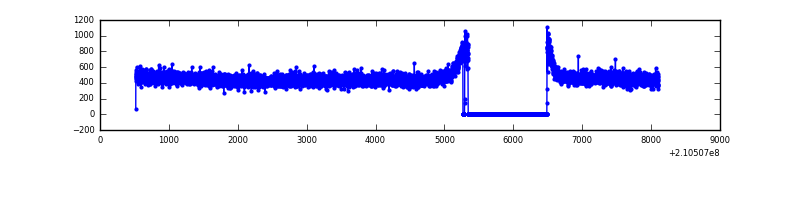 |
| D | 7585 | 6417 | 201 | 201 | 2.65% | 3.13% | 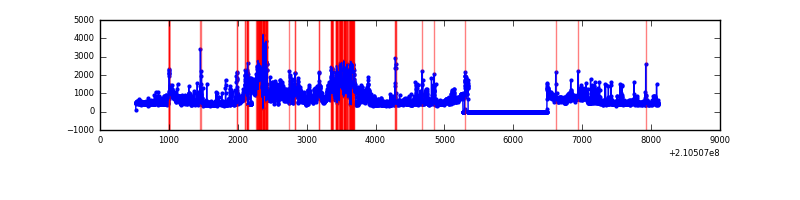 |
Top three noisy pixels from each quadrant. If the there are fewer than three noisy pixels in the level2.evt file, extra rows are filled as -1
| Pixel properties | Quadrant properties | ||||||
|---|---|---|---|---|---|---|---|
| Quadrant | DetID | PixID | Counts | Sigma | Mean | Median | Sigma |
| A | 0 | 247 | 23294 | 143.99 | 780 | 766 | 156.5 |
| A | 15 | 234 | 10823 | 64.28 | 780 | 766 | 156.5 |
| A | 0 | 226 | 9818 | 57.86 | 780 | 766 | 156.5 |
| B | 15 | 204 | 114086 | 764.97 | 781 | 765 | 148.1 |
| B | 0 | 219 | 45930 | 304.88 | 781 | 765 | 148.1 |
| B | 15 | 54 | 38161 | 252.44 | 781 | 765 | 148.1 |
| C | 14 | 67 | 8081 | 42.59 | 750 | 754 | 172.0 |
| C | 13 | 61 | 6178 | 31.53 | 750 | 754 | 172.0 |
| C | 9 | 54 | 2567 | 10.54 | 750 | 754 | 172.0 |
| D | 12 | 227 | 1369071 | 7598.6 | 745 | 722 | 180.1 |
| D | 13 | 235 | 247590 | 1370.89 | 745 | 722 | 180.1 |
| D | 1 | 7 | 197170 | 1090.9 | 745 | 722 | 180.1 |
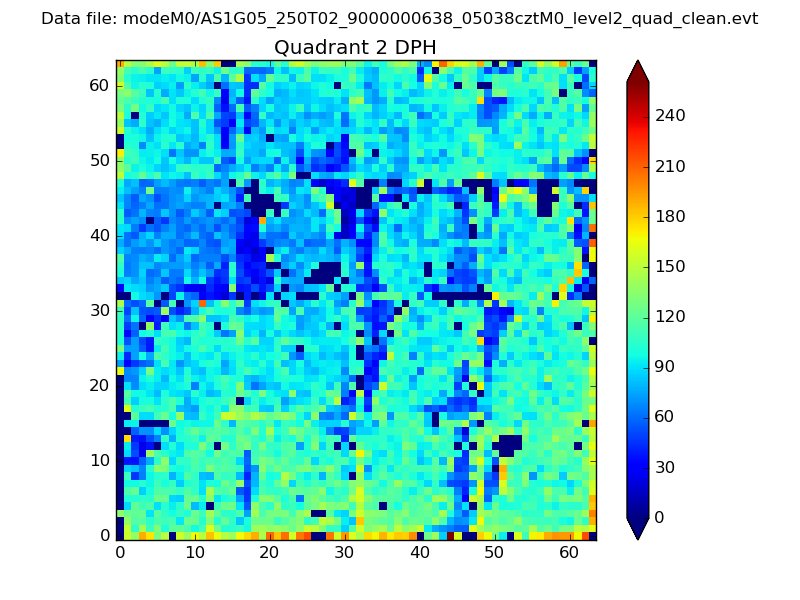
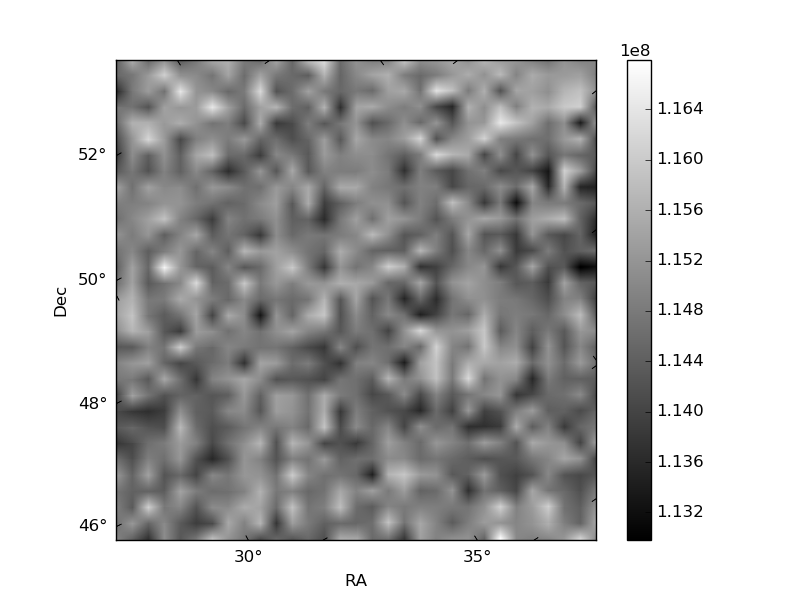
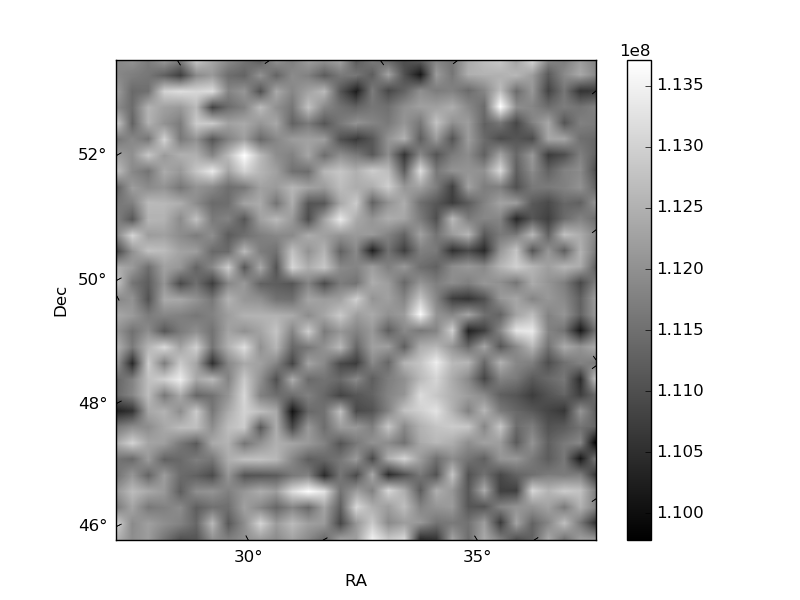
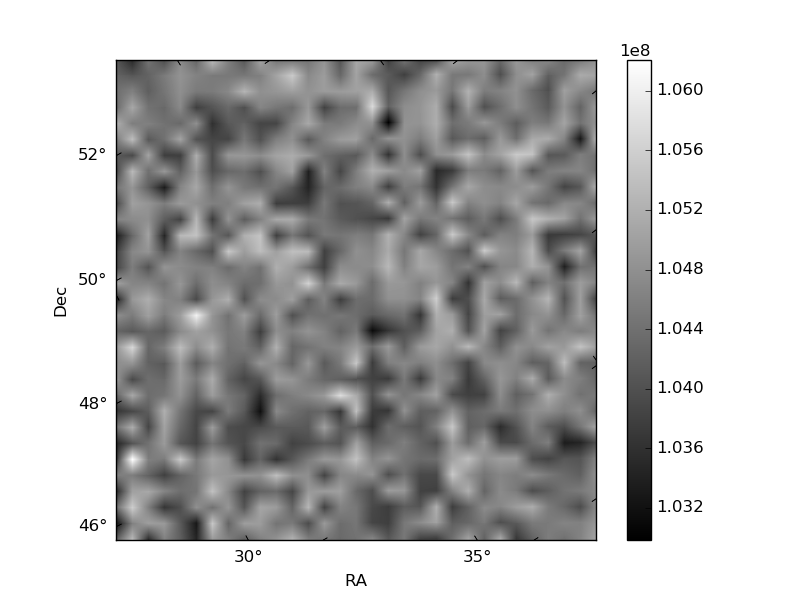
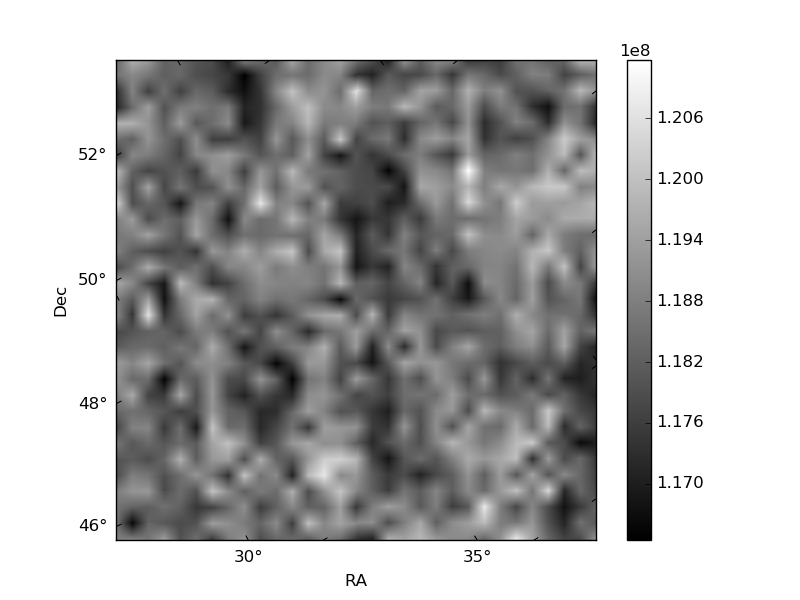
Histogram calculated using DETX and DETY for each event in the final _common_clean file
| Quadrant A | 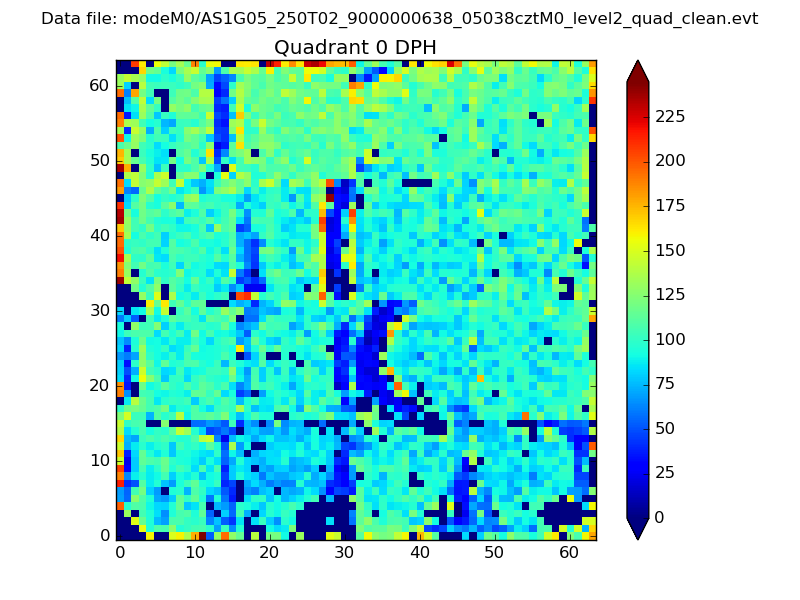 |
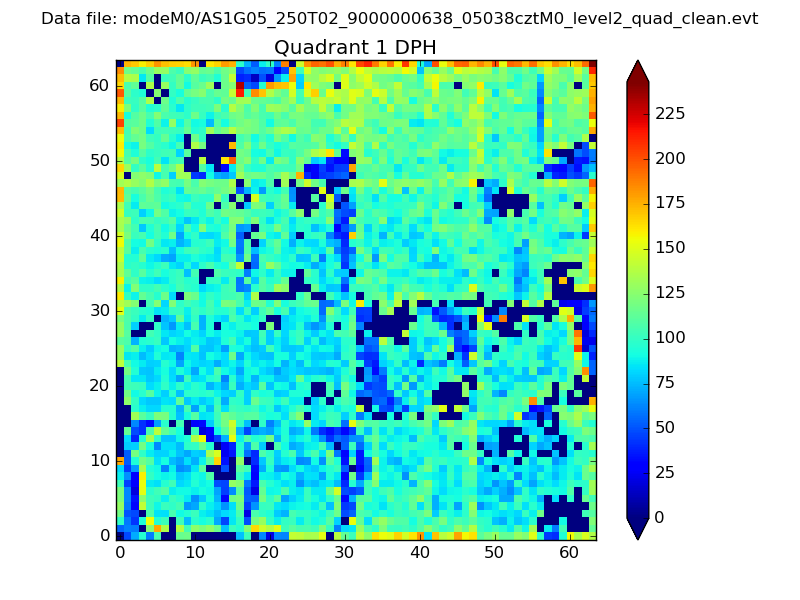 |
Quadrant B |
|---|---|---|---|
| Quadrant D | 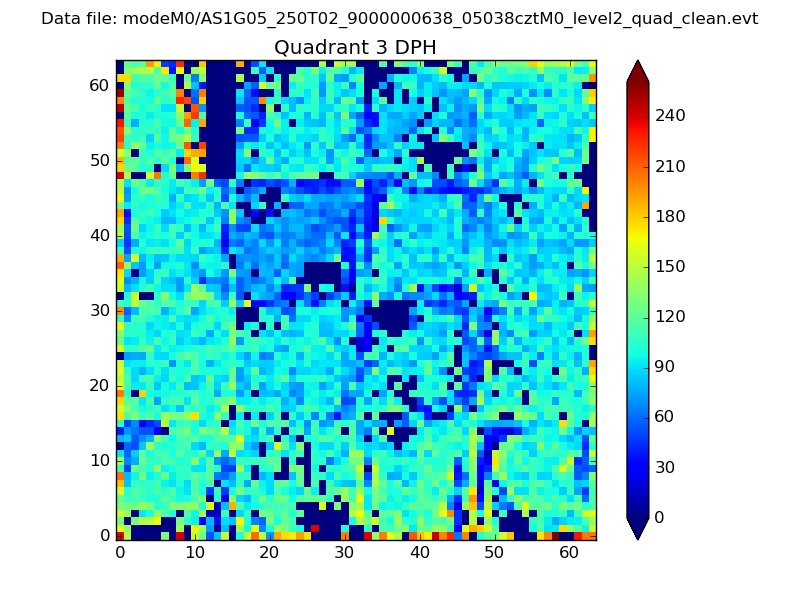 |
 |
Quadrant C |
| Plot type | Count rate plots | Images |
|---|---|---|
| Comparison with Poisson distribution Blue bars denote a histogram of data divided into 1 sec bins. Red curve is a Poisson curve with rate = median count rate of data. |
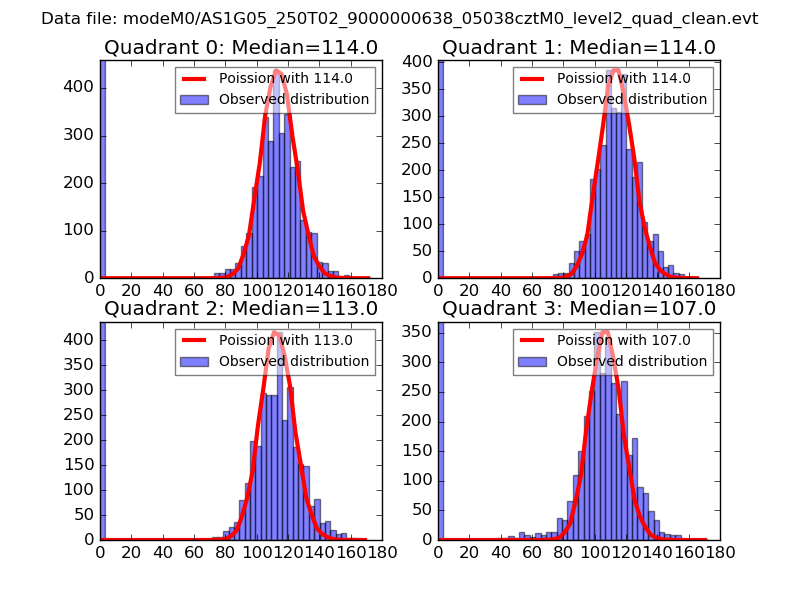 |
 |
| Quadrant-wise count rates Data is divided into 100 sec bins |
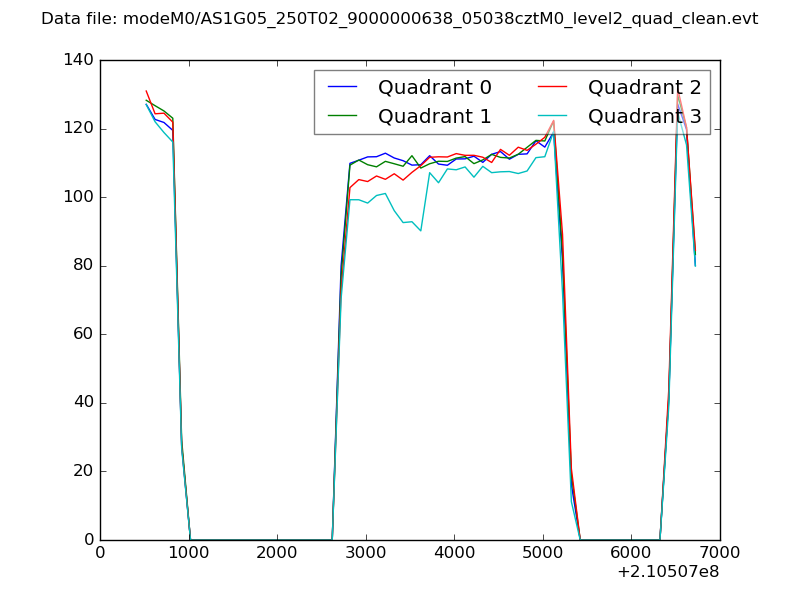 |
|
| Module-wise count rates for Quadrant A Data is divided into 100 sec bins |
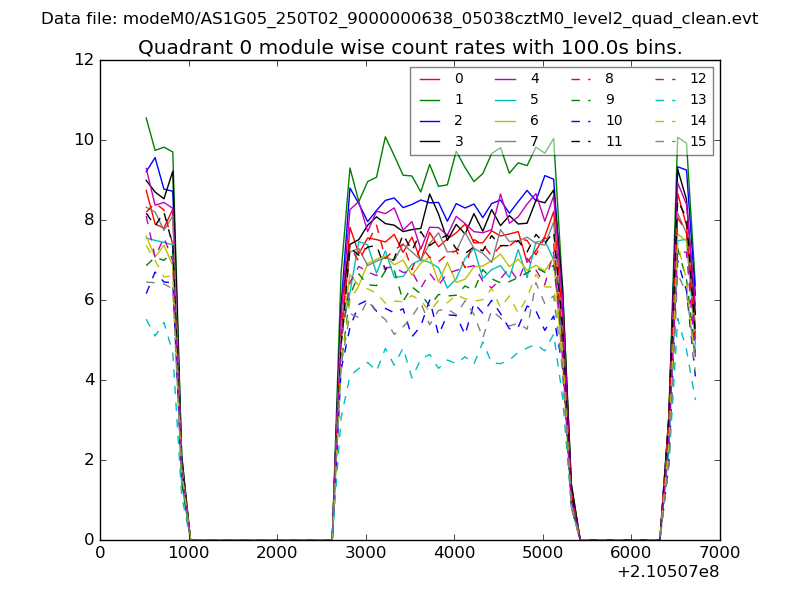 |
 |
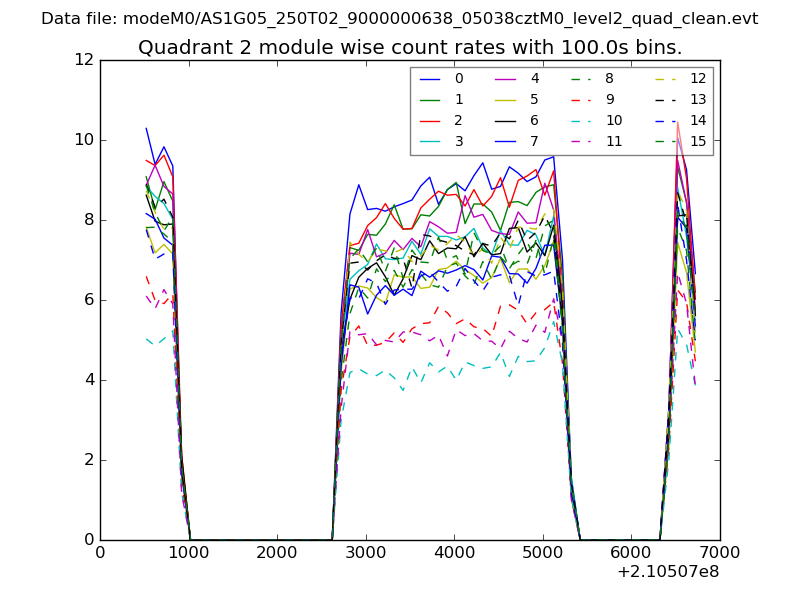
| Module-wise count rates for Quadrant B Data is divided into 100 sec bins |
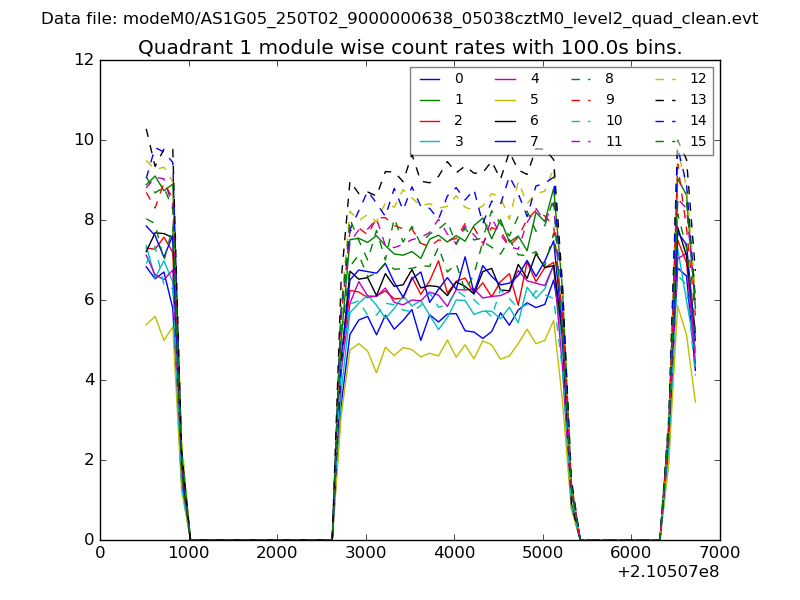 |
 |
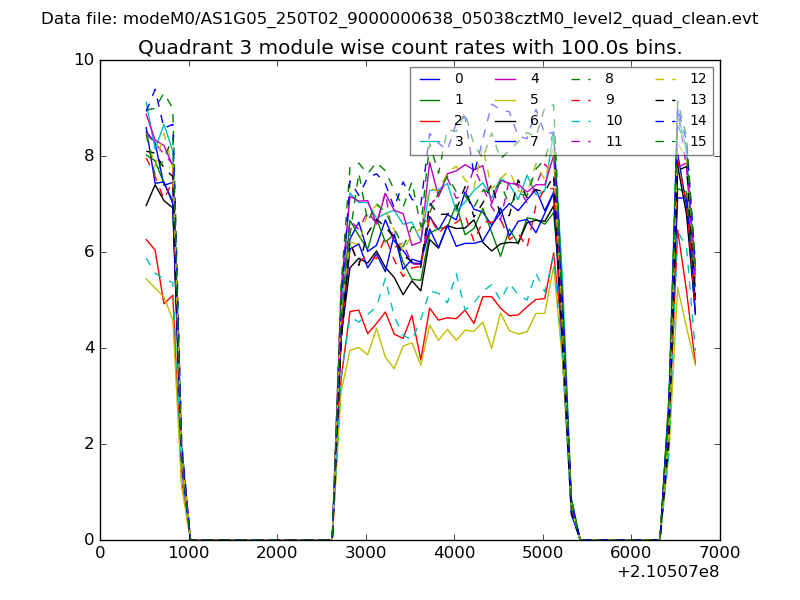
| Module-wise count rates for Quadrant C Data is divided into 100 sec bins |
 |
 |
| Module-wise count rates for Quadrant D Data is divided into 100 sec bins |
 |
 |
| Parameter | Plot |
|---|---|
| CZT HV Monitor | 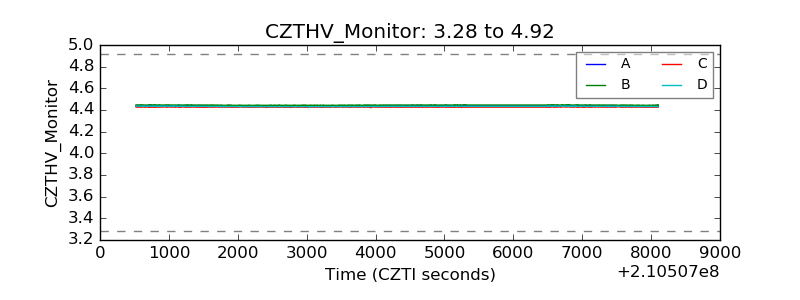 |
| D_VDD | 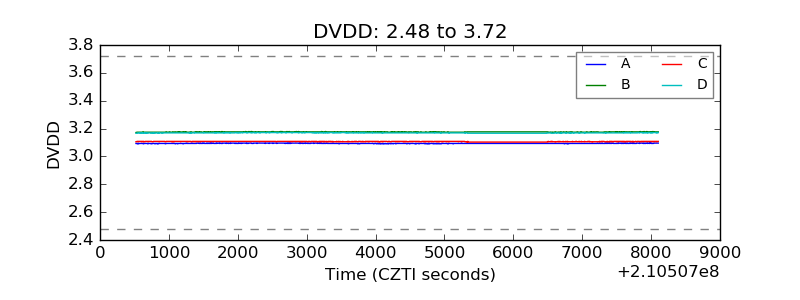 |
| Temperature 1 | 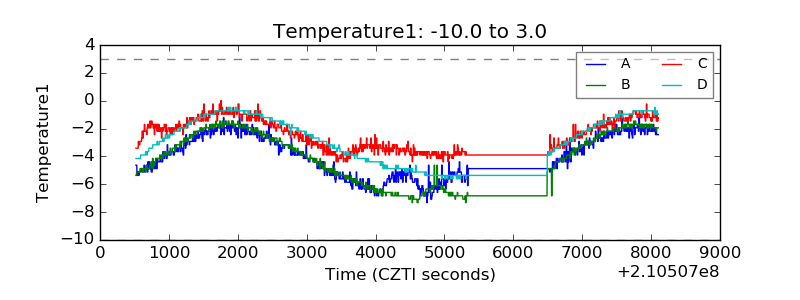 |
| Veto HV Monitor | 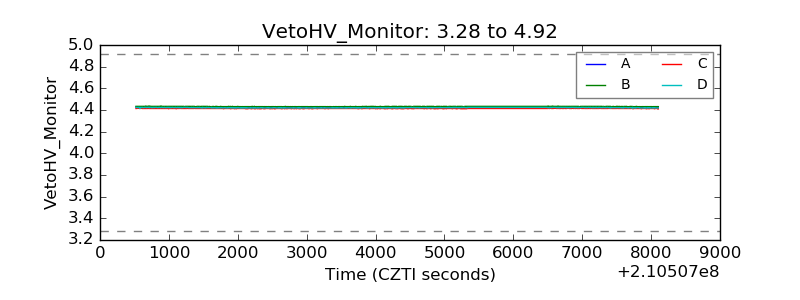 |
| Veto LLD | 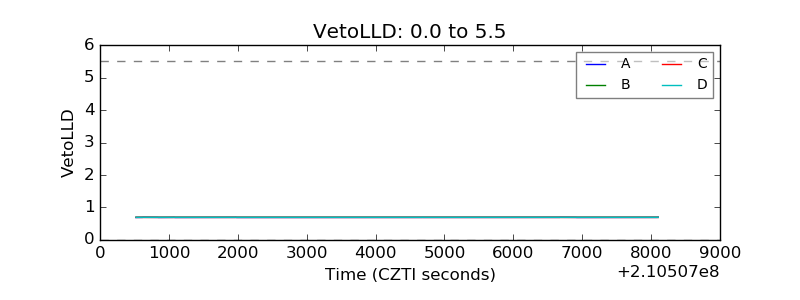 |
| Alpha Counter | 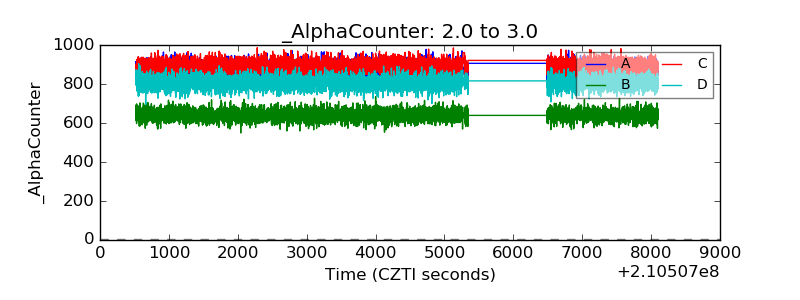 |
| _CPM_Rate | 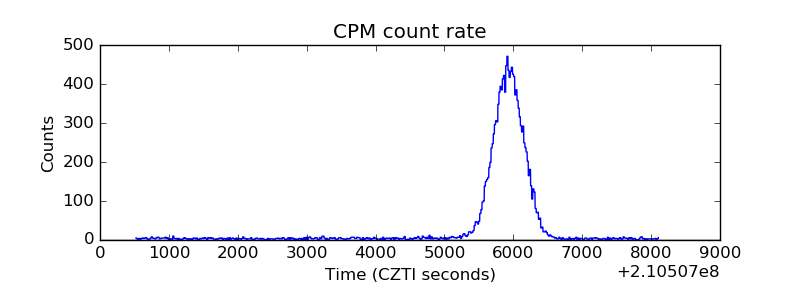 |
| CZT Counter | 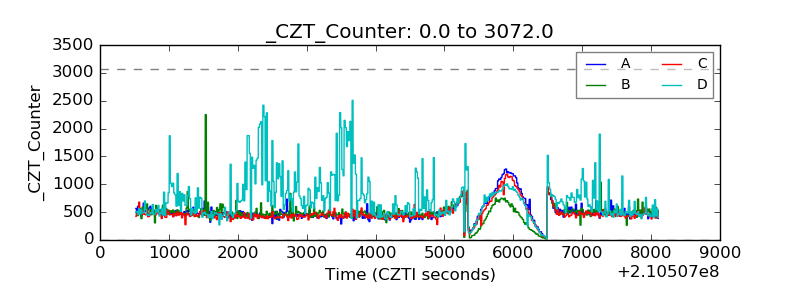 |
| +2.5 Volts monitor |  |
| +5 Volts monitor |  |
| _ROLL_ROT | 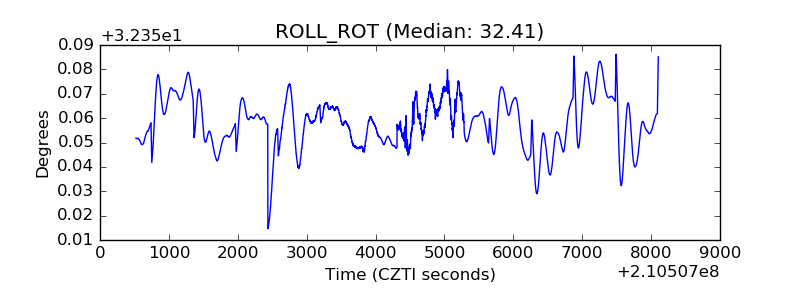 |
| _Roll_DEC | 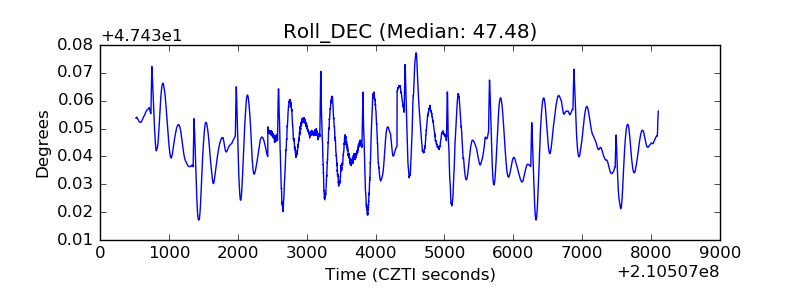 |
| _Roll_RA | 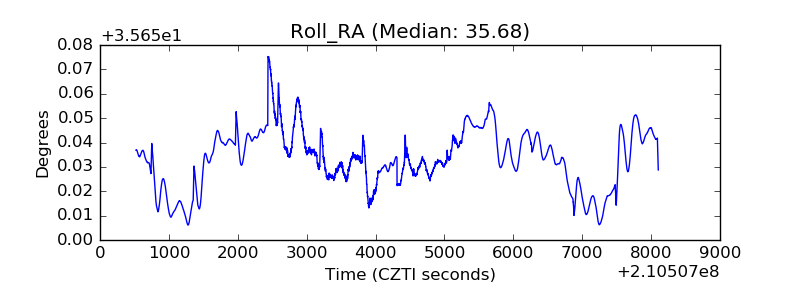 |
| Veto Counter | 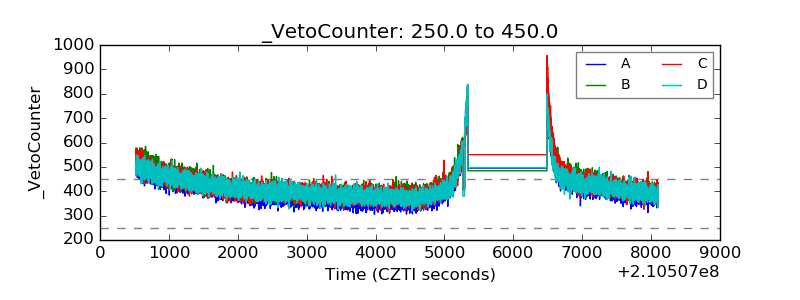 |