| Param | Original file | Final file |
|---|---|---|
| Filename | modeM0/AS1G05_250T02_9000000638_05039cztM0_level2.evt | modeM0/AS1G05_250T02_9000000638_05039cztM0_level2_quad_clean.evt |
| Size (bytes) | 505,330,560 | 66,614,400 |
| Size | 481.9 MB | 63.5 MB |
| Events in quadrant A | 3,317,822 | 389,961 |
| Events in quadrant B | 3,467,600 | 386,618 |
| Events in quadrant C | 3,143,994 | 388,403 |
| Events in quadrant D | 4,903,717 | 368,653 |
| Mode M9 | |||
|---|---|---|---|
| Quadrant | BADHDUFLAG | Total packets | Discarded packets |
| A | 0 | 15 | 0 |
| B | 0 | 15 | 0 |
| C | 0 | 15 | 0 |
| D | 0 | 16 | 0 |
| Mode SS | |||
|---|---|---|---|
| Quadrant | BADHDUFLAG | Total packets | Discarded packets |
| A | 0 | 142 | 0 |
| B | 0 | 142 | 0 |
| C | 0 | 142 | 0 |
| D | 0 | 142 | 0 |
| Mode M0 | |||
|---|---|---|---|
| Quadrant | BADHDUFLAG | Total packets | Discarded packets |
| A | 0 | 14591 | 3 |
| B | 0 | 14796 | 2 |
| C | 0 | 14227 | 2 |
| D | 0 | 19273 | 2 |
| Quadrant | Total seconds | Saturated seconds | Saturation percentage |
|---|---|---|---|
| A | 6930 | 148 | 2.135642% |
| B | 6930 | 119 | 1.717172% |
| C | 6930 | 96 | 1.385281% |
| D | 6930 | 316 | 4.559885% |
Noise dominated data is calculated using 1-second bins in cleaned event files. If a bin has >2000 counts, and if more than 50% of those come from <1% of pixels, then it is considered to be noise-dominated and hence unusable.
| Quadrant | # 1 sec bins | Bins with >0 counts | Bins with >2000 counts | High rate bins dominated by noise | Noise dominated (total time) | Noise dominated (detector-on time) | Marked lightcurve |
|---|---|---|---|---|---|---|---|
| A | 7855 | 6931 | 15 | 15 | 0.19% | 0.22% |  |
| B | 7855 | 6931 | 1 | 1 | 0.01% | 0.01% | 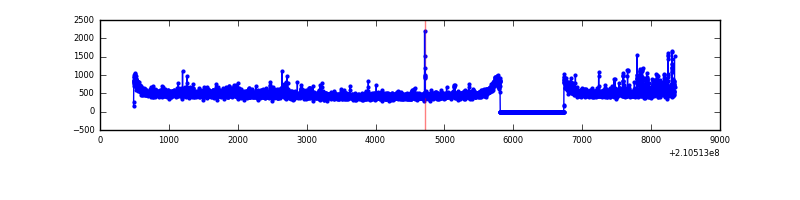 |
| C | 7855 | 6931 | 0 | 0 | 0.00% | 0.00% | 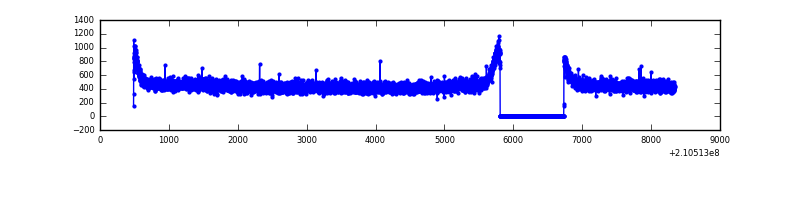 |
| D | 7855 | 6931 | 154 | 154 | 1.96% | 2.22% | 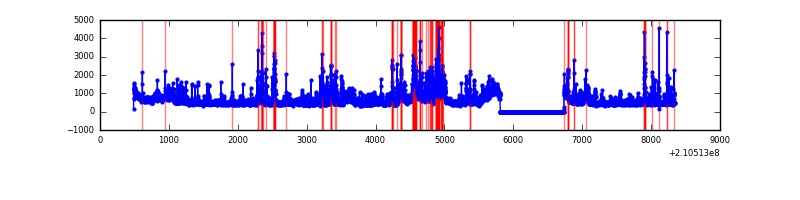 |
Top three noisy pixels from each quadrant. If the there are fewer than three noisy pixels in the level2.evt file, extra rows are filled as -1
| Pixel properties | Quadrant properties | ||||||
|---|---|---|---|---|---|---|---|
| Quadrant | DetID | PixID | Counts | Sigma | Mean | Median | Sigma |
| A | 0 | 247 | 72570 | 426.32 | 830 | 810 | 168.3 |
| A | 0 | 50 | 35984 | 208.97 | 830 | 810 | 168.3 |
| A | 0 | 226 | 15113 | 84.97 | 830 | 810 | 168.3 |
| B | 15 | 204 | 181241 | 1140.08 | 831 | 811 | 158.3 |
| B | 0 | 219 | 35270 | 217.74 | 831 | 811 | 158.3 |
| B | 4 | 80 | 15460 | 92.56 | 831 | 811 | 158.3 |
| C | 14 | 67 | 17782 | 91.75 | 800 | 801 | 185.1 |
| C | 13 | 61 | 6602 | 31.34 | 800 | 801 | 185.1 |
| C | 9 | 54 | 3456 | 14.35 | 800 | 801 | 185.1 |
| D | 13 | 235 | 566818 | 2893.06 | 796 | 772 | 195.7 |
| D | 1 | 7 | 486272 | 2481.39 | 796 | 772 | 195.7 |
| D | 12 | 227 | 220517 | 1123.12 | 796 | 772 | 195.7 |
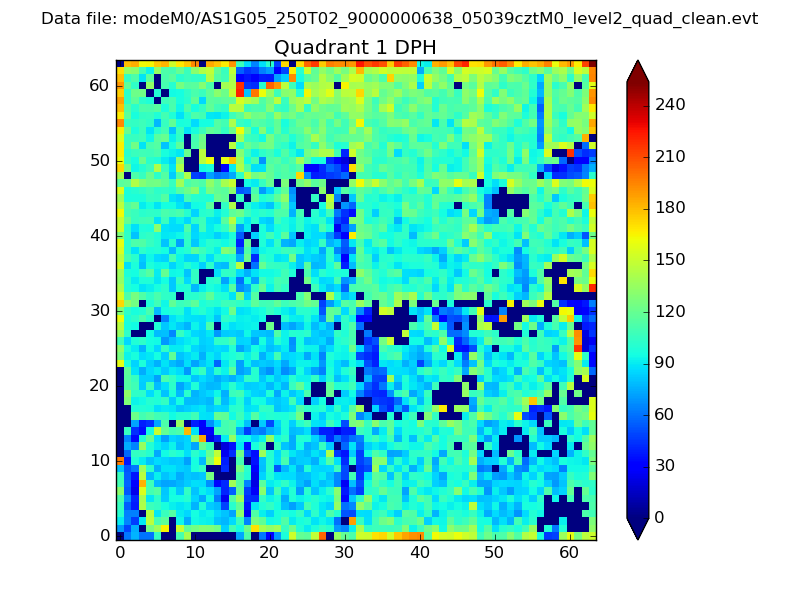
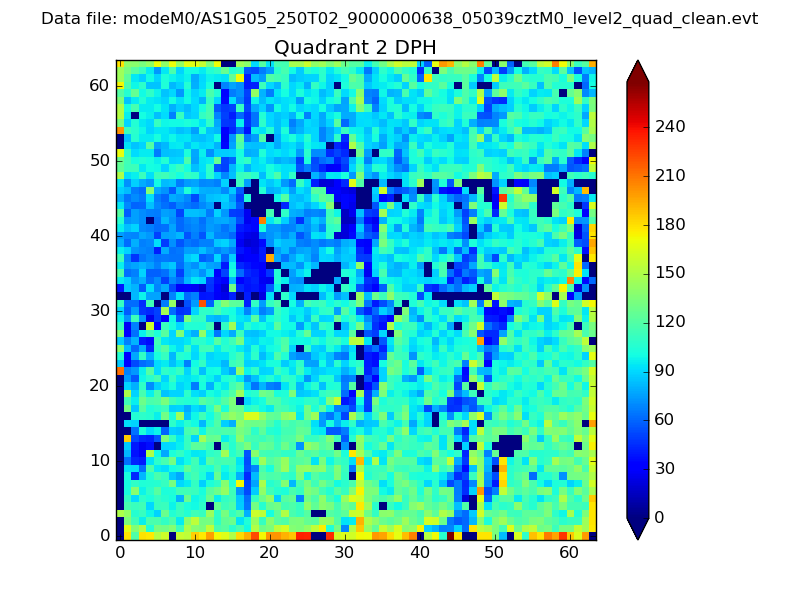
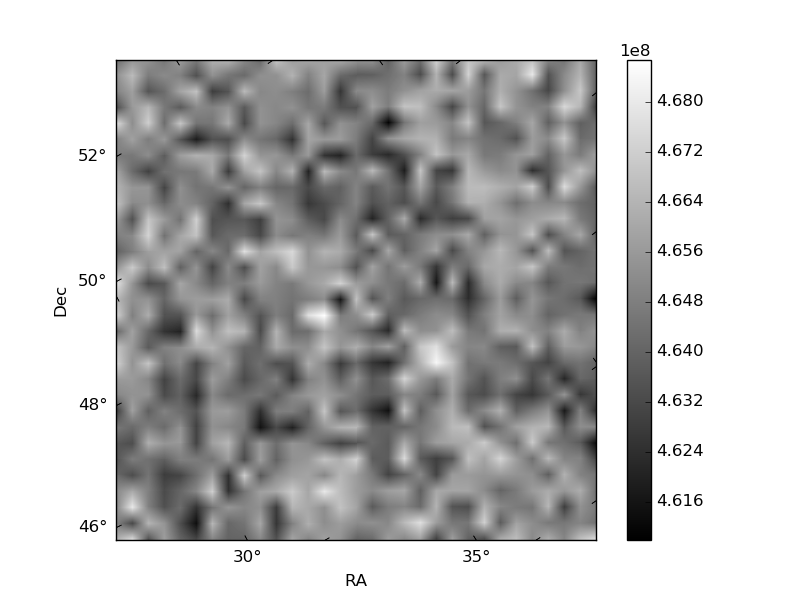
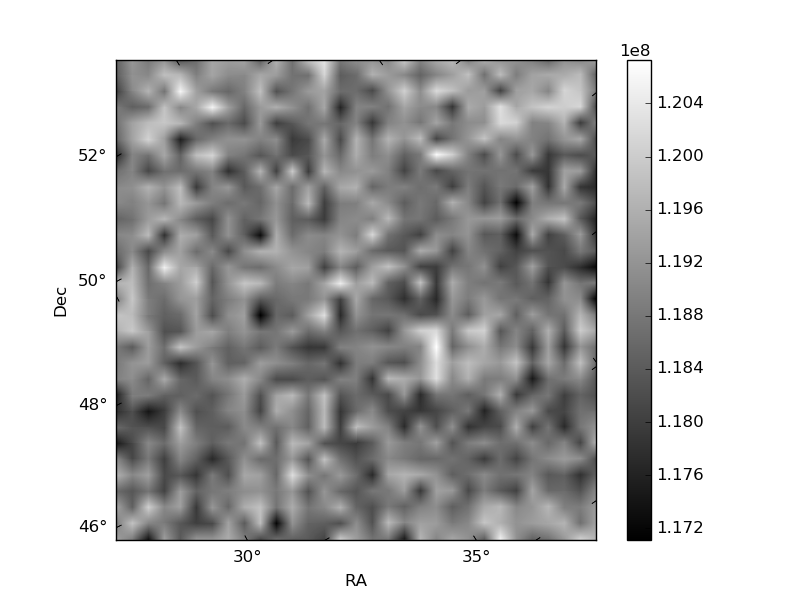
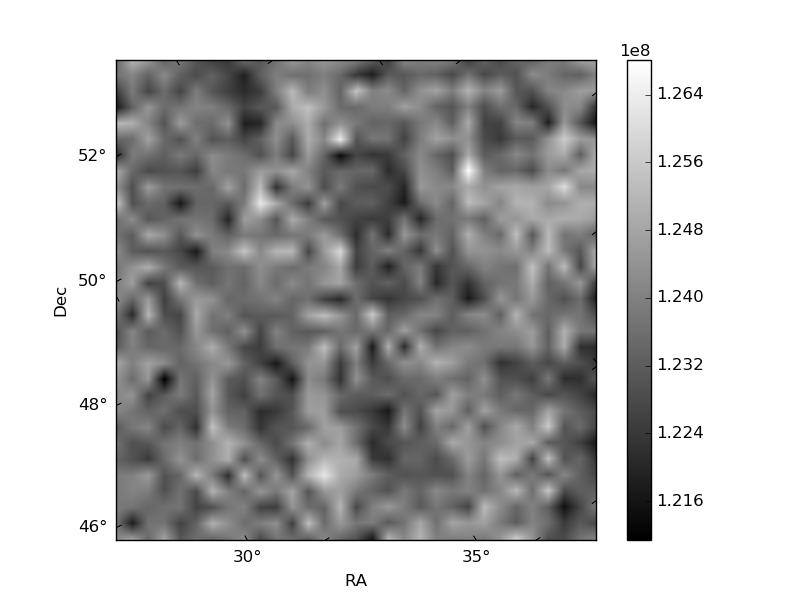
Histogram calculated using DETX and DETY for each event in the final _common_clean file
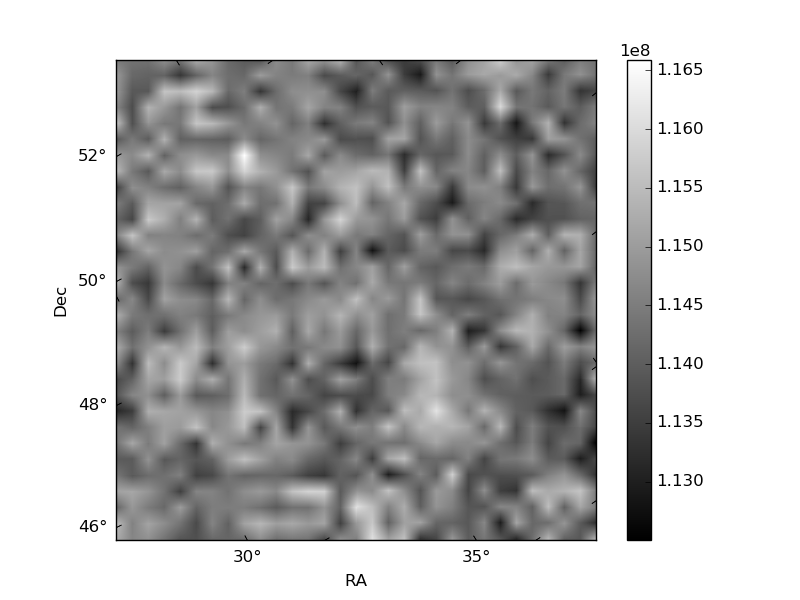
| Quadrant A | 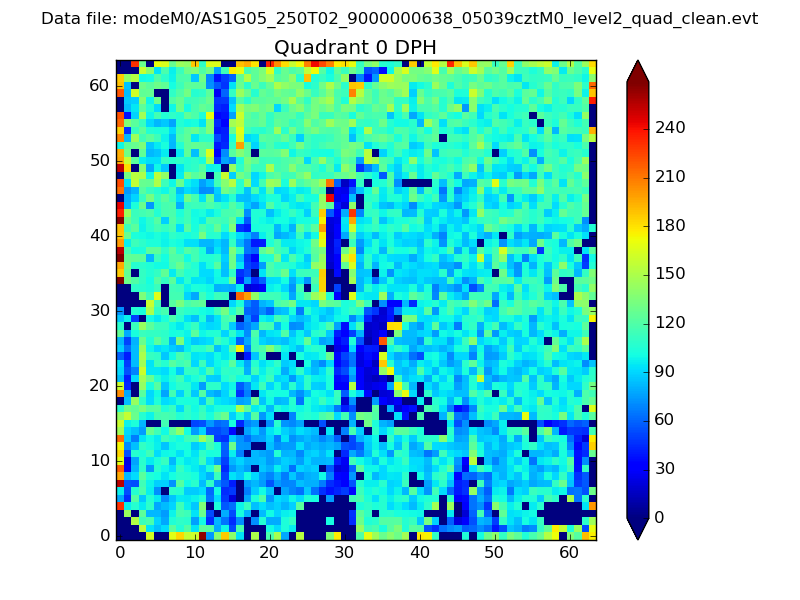 |
 |
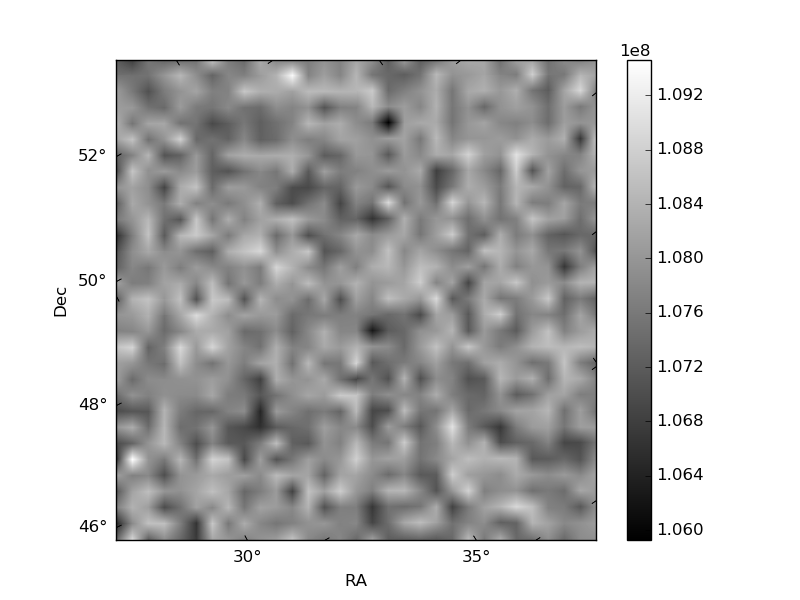
Quadrant B |
|---|---|---|---|
| Quadrant D | 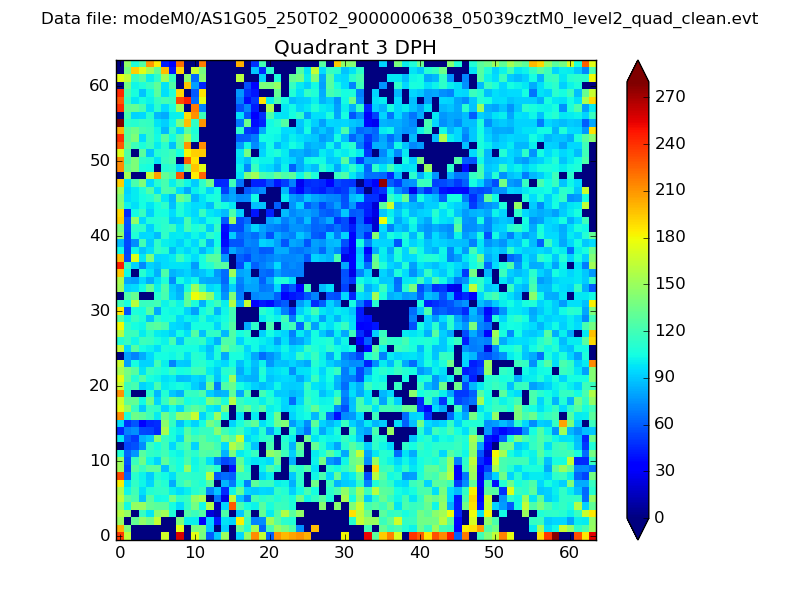 |
 |
Quadrant C |
| Plot type | Count rate plots | Images |
|---|---|---|
| Comparison with Poisson distribution Blue bars denote a histogram of data divided into 1 sec bins. Red curve is a Poisson curve with rate = median count rate of data. |
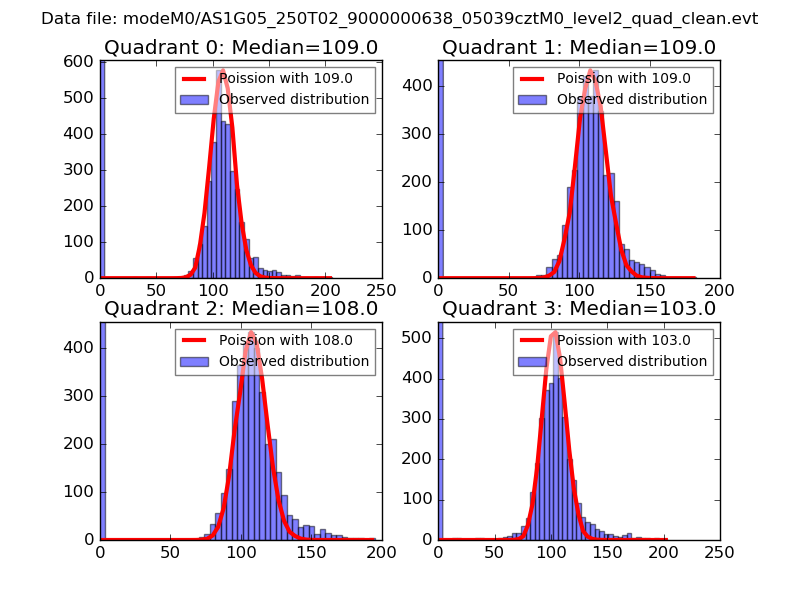 |
 |
| Quadrant-wise count rates Data is divided into 100 sec bins |
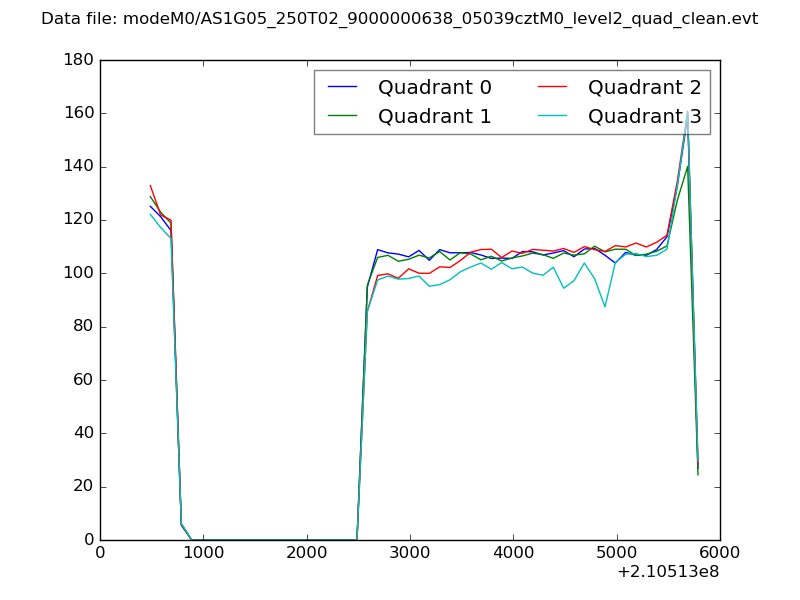 |
|
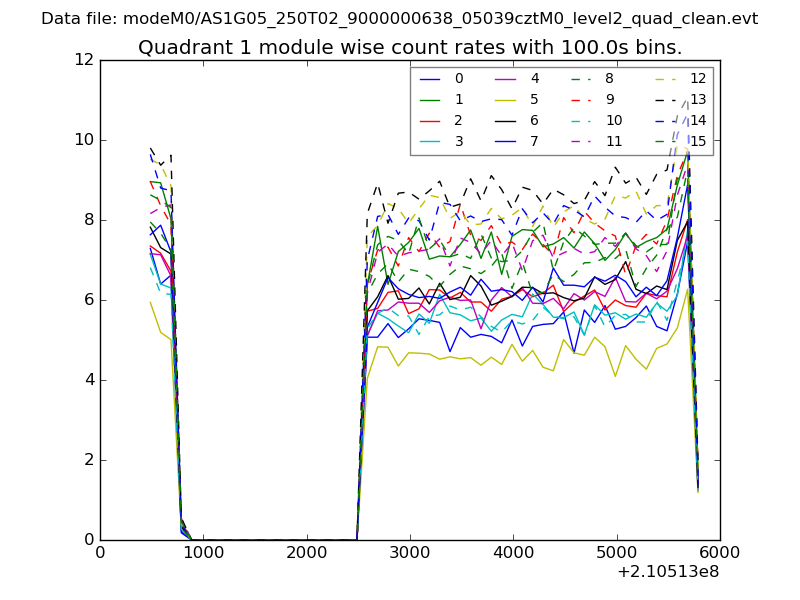
| Module-wise count rates for Quadrant A Data is divided into 100 sec bins |
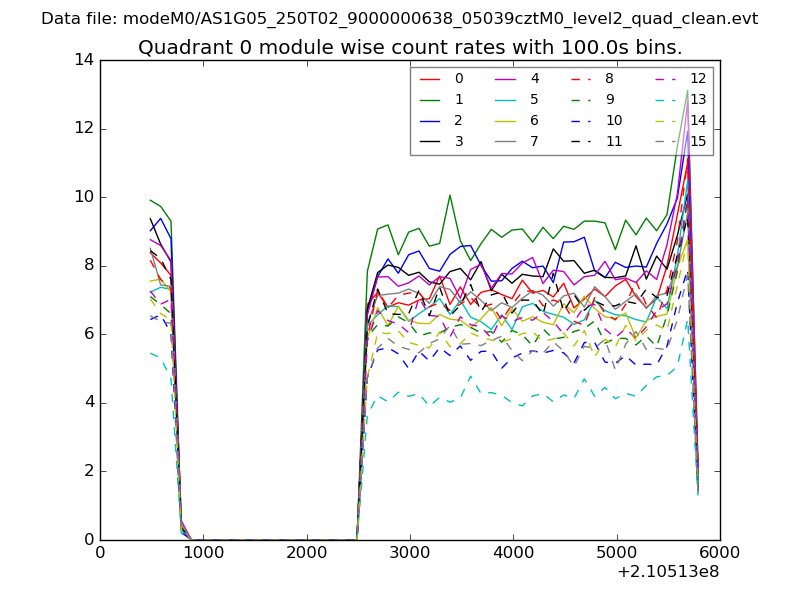 |
 |
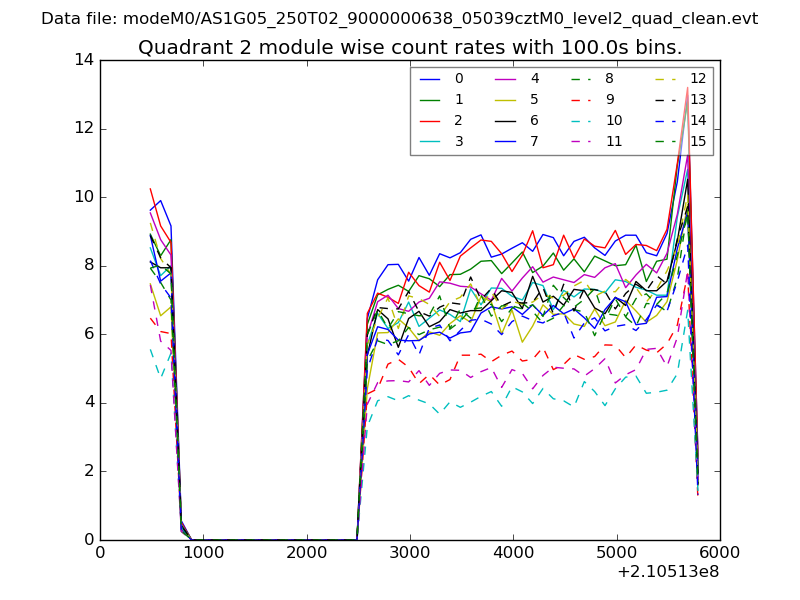
| Module-wise count rates for Quadrant B Data is divided into 100 sec bins |
 |
 |
| Module-wise count rates for Quadrant C Data is divided into 100 sec bins |
 |
 |
| Module-wise count rates for Quadrant D Data is divided into 100 sec bins |
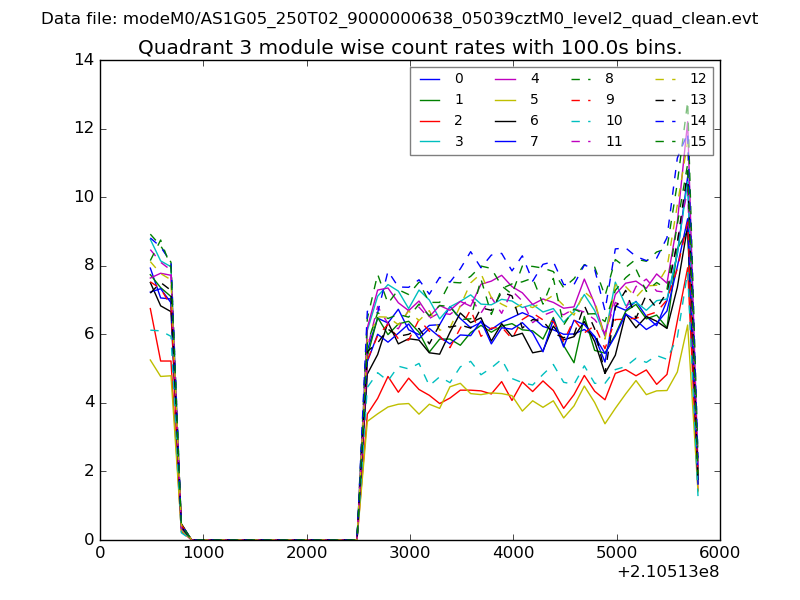 |
 |
| Parameter | Plot |
|---|---|
| CZT HV Monitor | 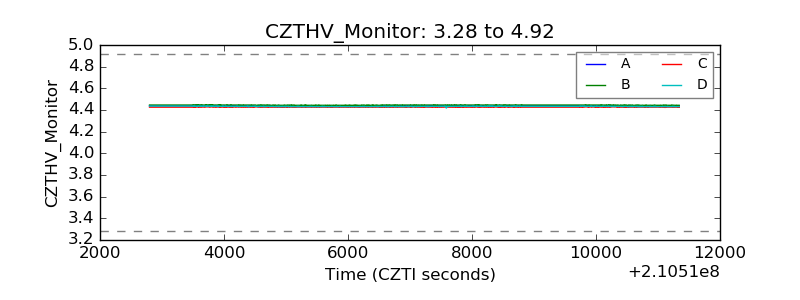 |
| D_VDD | 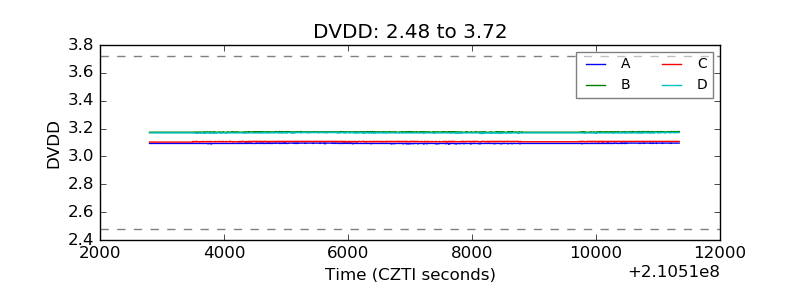 |
| Temperature 1 | 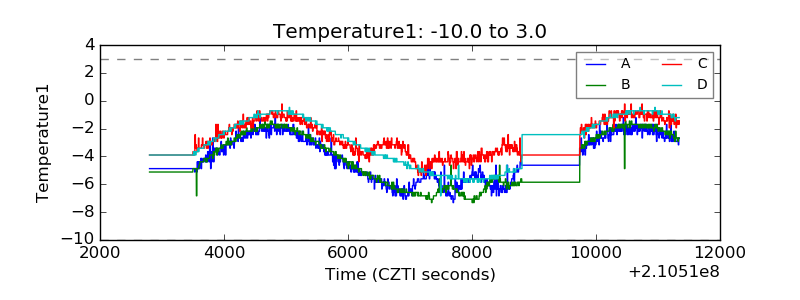 |
| Veto HV Monitor | 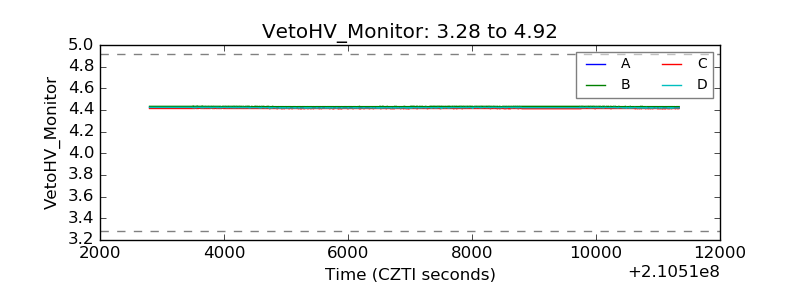 |
| Veto LLD | 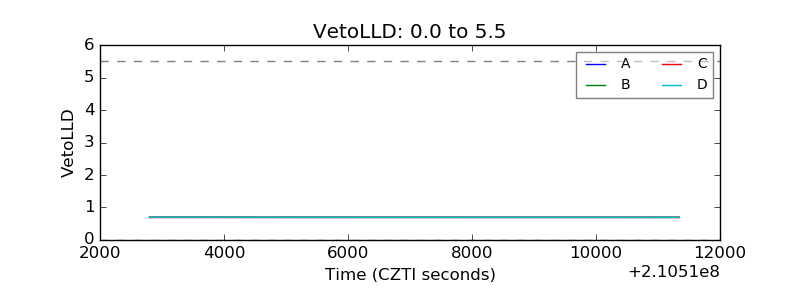 |
| Alpha Counter | 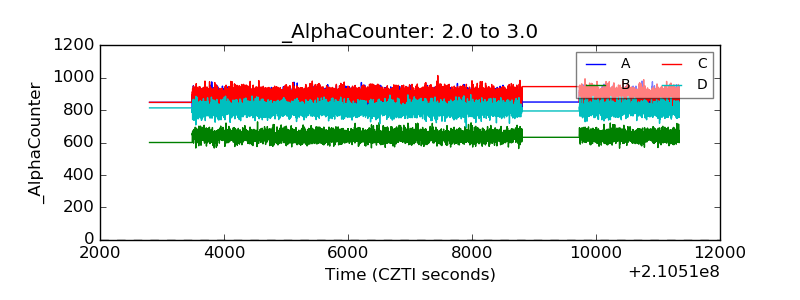 |
| _CPM_Rate | 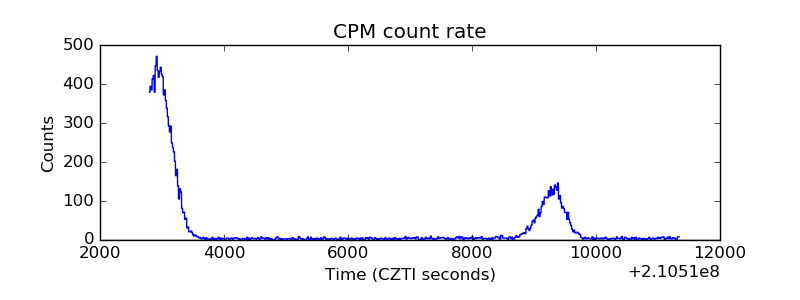 |
| CZT Counter | 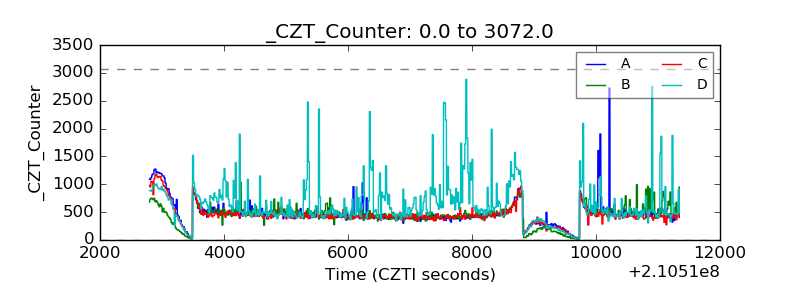 |
| +2.5 Volts monitor |  |
| +5 Volts monitor | 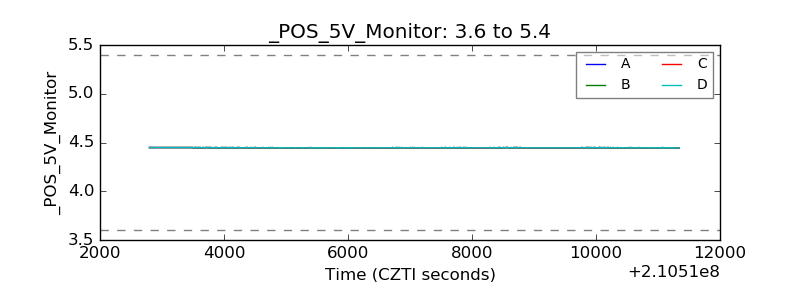 |
| _ROLL_ROT | 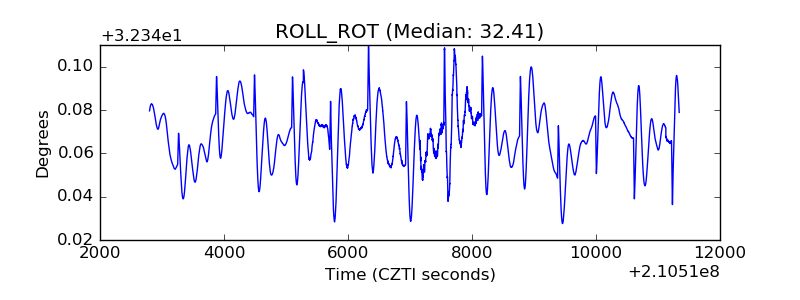 |
| _Roll_DEC | 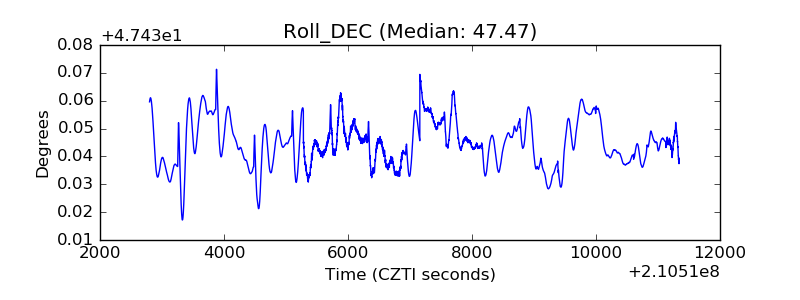 |
| _Roll_RA | 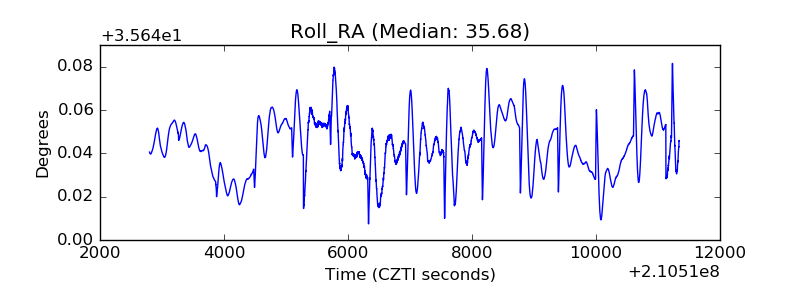 |
| Veto Counter | 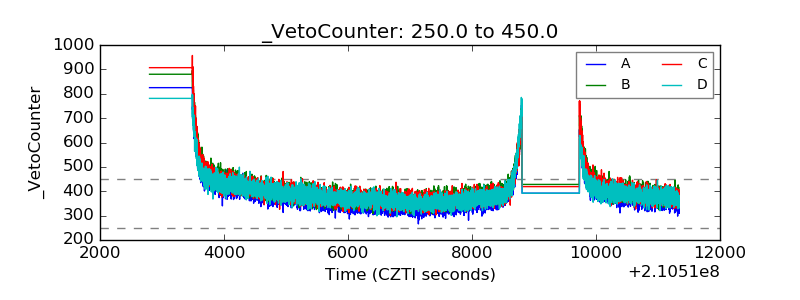 |