| Param | Original file | Final file |
|---|---|---|
| Filename | modeM0/AS1G05_250T02_9000000638_05045cztM0_level2.evt | modeM0/AS1G05_250T02_9000000638_05045cztM0_level2_quad_clean.evt |
| Size (bytes) | 1,345,976,640 | 217,900,800 |
| Size | 1.3 GB | 207.8 MB |
| Events in quadrant A | 9,130,820 | 1,314,471 |
| Events in quadrant B | 10,578,190 | 1,318,777 |
| Events in quadrant C | 8,603,466 | 1,340,053 |
| Events in quadrant D | 11,119,835 | 1,270,658 |
| Mode M9 | |||
|---|---|---|---|
| Quadrant | BADHDUFLAG | Total packets | Discarded packets |
| A | 0 | 18 | 0 |
| B | 0 | 18 | 0 |
| C | 0 | 18 | 0 |
| D | 0 | 18 | 0 |
| Mode SS | |||
|---|---|---|---|
| Quadrant | BADHDUFLAG | Total packets | Discarded packets |
| A | 0 | 404 | 0 |
| B | 0 | 404 | 0 |
| C | 0 | 404 | 0 |
| D | 0 | 404 | 0 |
| Mode M0 | |||
|---|---|---|---|
| Quadrant | BADHDUFLAG | Total packets | Discarded packets |
| A | 0 | 41614 | 6 |
| B | 0 | 45540 | 5 |
| C | 0 | 40070 | 5 |
| D | 0 | 47665 | 5 |
| Quadrant | Total seconds | Saturated seconds | Saturation percentage |
|---|---|---|---|
| A | 19668 | 213 | 1.082977% |
| B | 19668 | 377 | 1.916819% |
| C | 19668 | 92 | 0.467765% |
| D | 19668 | 636 | 3.233679% |
Noise dominated data is calculated using 1-second bins in cleaned event files. If a bin has >2000 counts, and if more than 50% of those come from <1% of pixels, then it is considered to be noise-dominated and hence unusable.
| Quadrant | # 1 sec bins | Bins with >0 counts | Bins with >2000 counts | High rate bins dominated by noise | Noise dominated (total time) | Noise dominated (detector-on time) | Marked lightcurve |
|---|---|---|---|---|---|---|---|
| A | 21633 | 19673 | 57 | 57 | 0.26% | 0.29% | 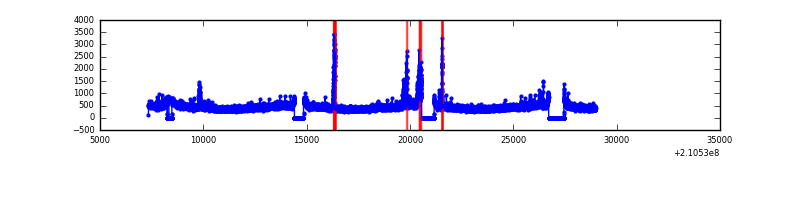 |
| B | 21633 | 19673 | 94 | 94 | 0.43% | 0.48% | 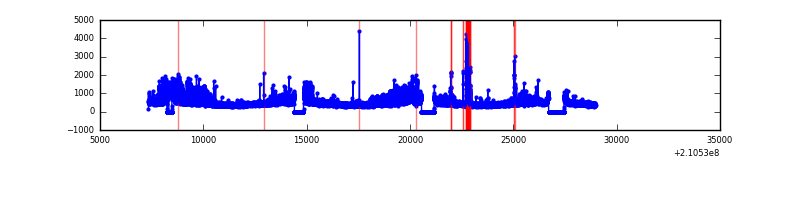 |
| C | 21633 | 19673 | 0 | 0 | 0.00% | 0.00% | 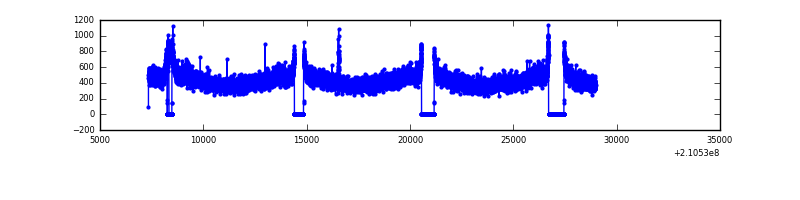 |
| D | 21633 | 19673 | 377 | 377 | 1.74% | 1.92% | 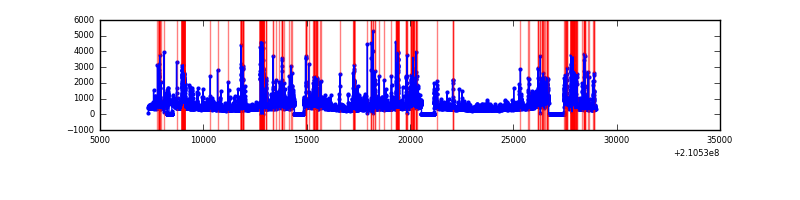 |
Top three noisy pixels from each quadrant. If the there are fewer than three noisy pixels in the level2.evt file, extra rows are filled as -1
| Pixel properties | Quadrant properties | ||||||
|---|---|---|---|---|---|---|---|
| Quadrant | DetID | PixID | Counts | Sigma | Mean | Median | Sigma |
| A | 13 | 251 | 258549 | 566.66 | 2221 | 2170 | 452.4 |
| A | 15 | 234 | 169552 | 369.96 | 2221 | 2170 | 452.4 |
| A | 15 | 174 | 108321 | 234.62 | 2221 | 2170 | 452.4 |
| B | 15 | 204 | 1311613 | 3076.99 | 2242 | 2186 | 425.6 |
| B | 10 | 247 | 350447 | 818.37 | 2242 | 2186 | 425.6 |
| B | 0 | 219 | 130304 | 301.06 | 2242 | 2186 | 425.6 |
| C | 14 | 67 | 62350 | 120.13 | 2174 | 2181 | 500.9 |
| C | 8 | 128 | 18644 | 32.87 | 2174 | 2181 | 500.9 |
| C | 9 | 54 | 18641 | 32.86 | 2174 | 2181 | 500.9 |
| D | 1 | 7 | 818452 | 1577.25 | 2136 | 2067 | 517.6 |
| D | 13 | 235 | 634713 | 1222.27 | 2136 | 2067 | 517.6 |
| D | 2 | 136 | 587299 | 1130.66 | 2136 | 2067 | 517.6 |
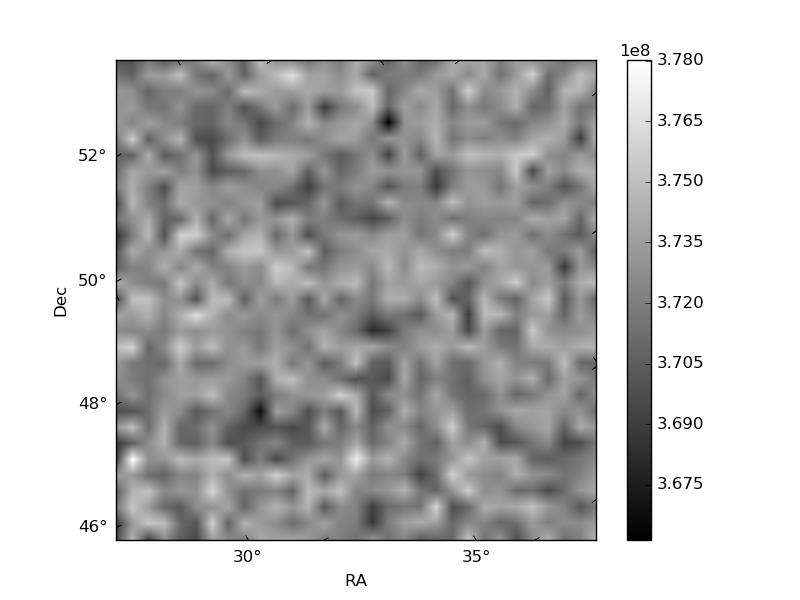
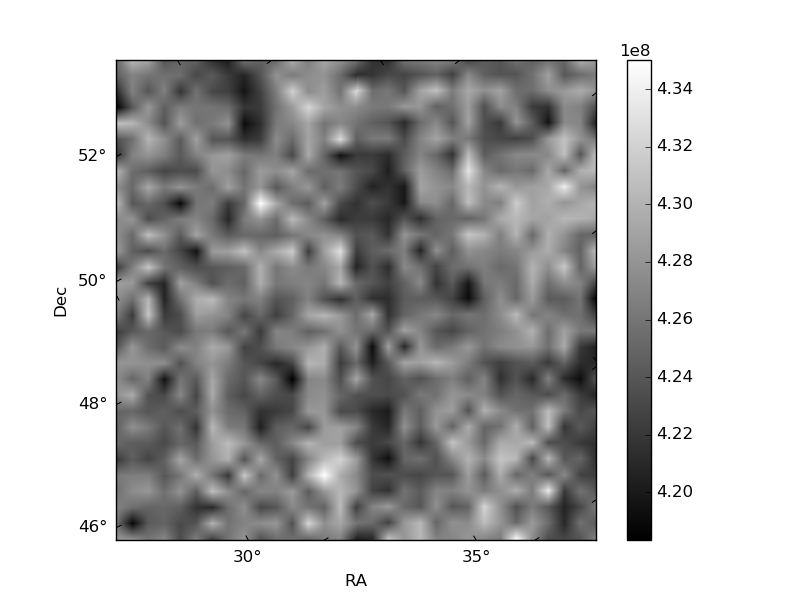
Histogram calculated using DETX and DETY for each event in the final _common_clean file
| Quadrant A | 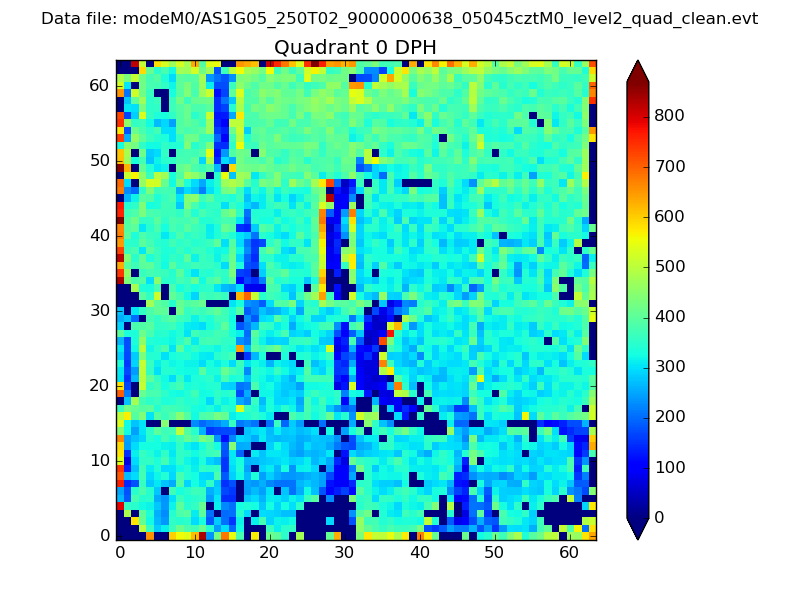 |
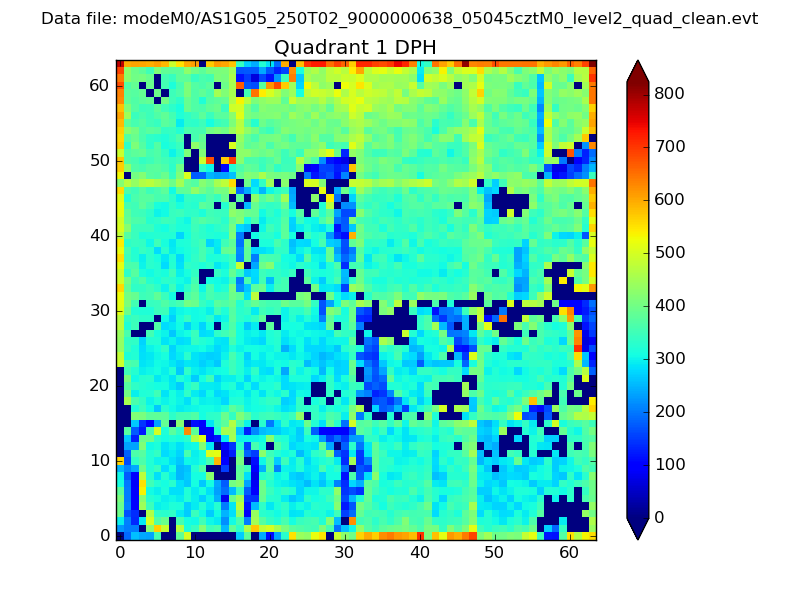 |
Quadrant B |
|---|---|---|---|
| Quadrant D | 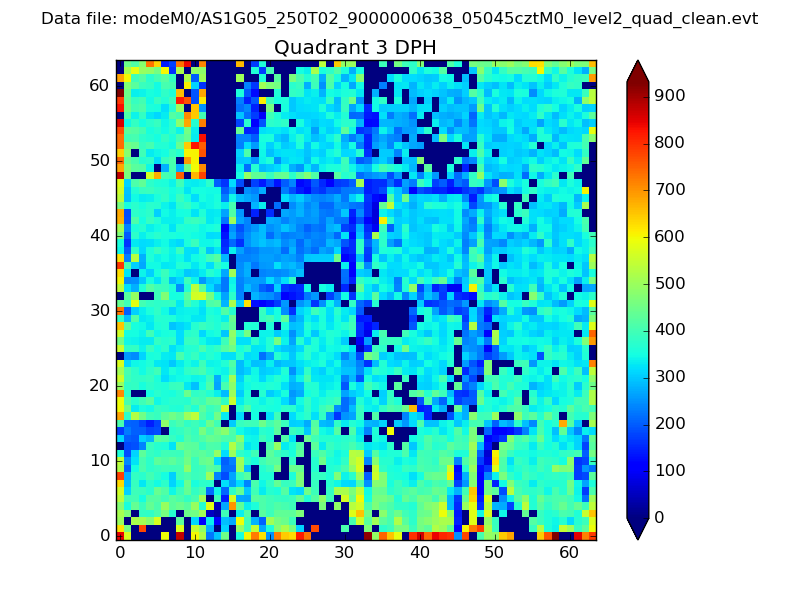 |
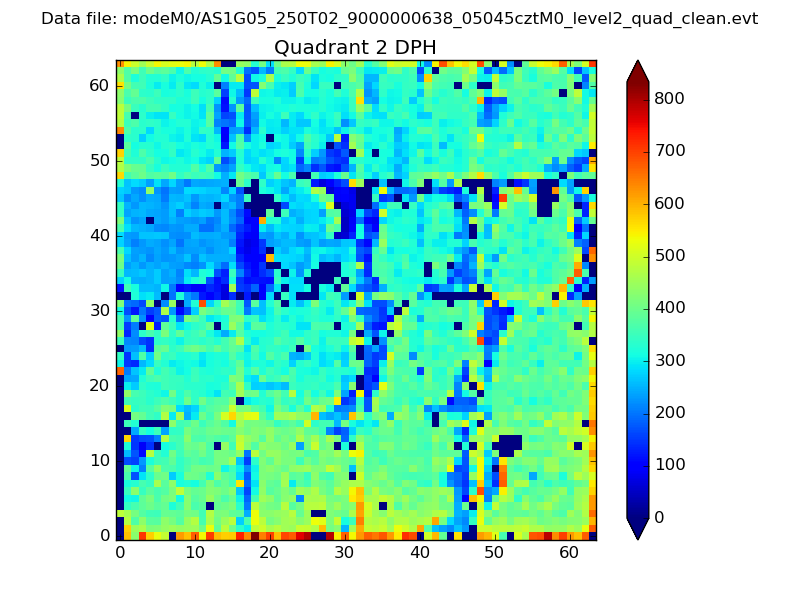 |
Quadrant C |
| Plot type | Count rate plots | Images |
|---|---|---|
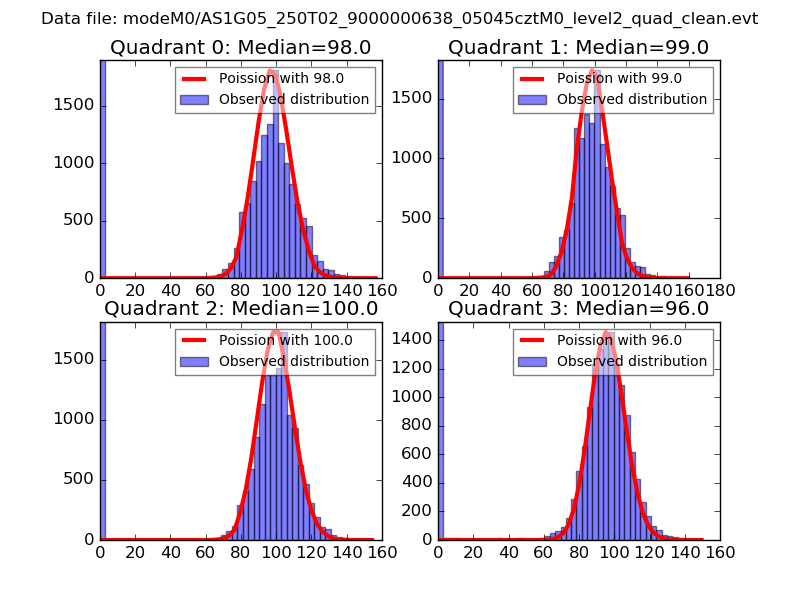
| Comparison with Poisson distribution Blue bars denote a histogram of data divided into 1 sec bins. Red curve is a Poisson curve with rate = median count rate of data. |
 |
 |
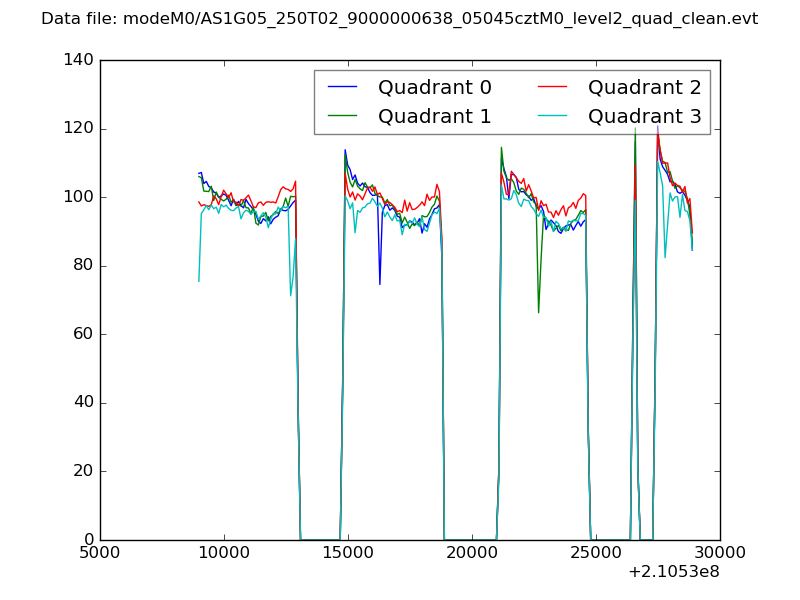
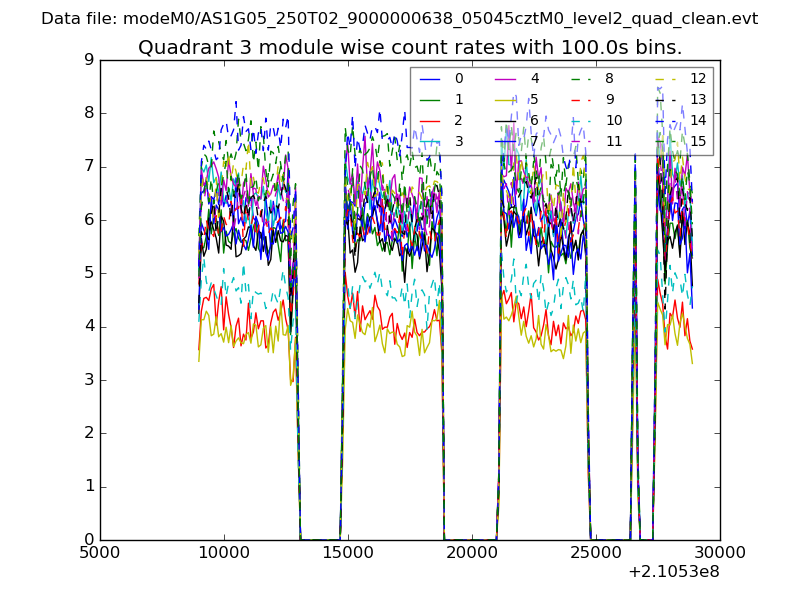
| Quadrant-wise count rates Data is divided into 100 sec bins |
 |
|
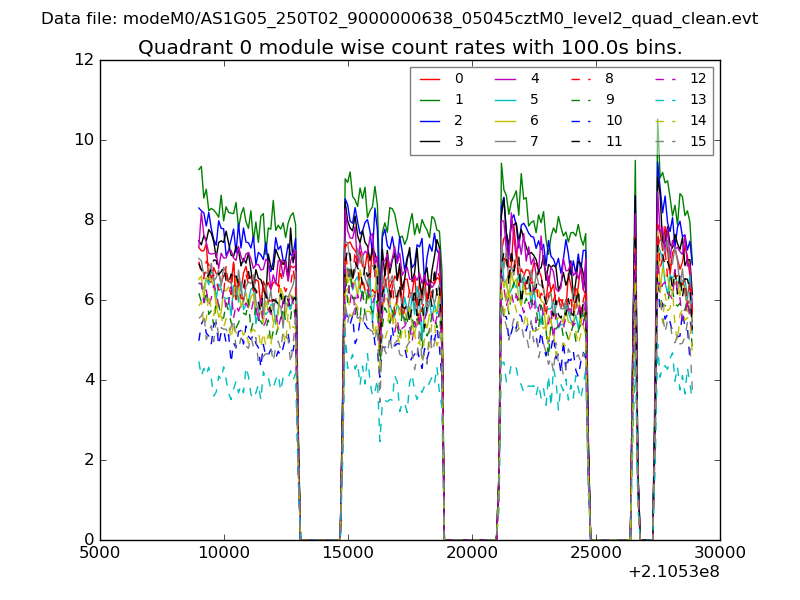
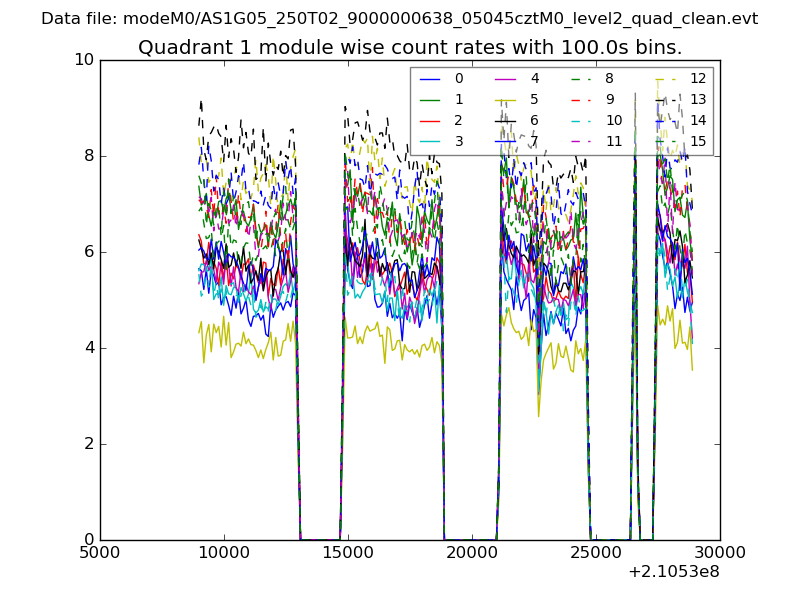
| Module-wise count rates for Quadrant A Data is divided into 100 sec bins |
 |
 |
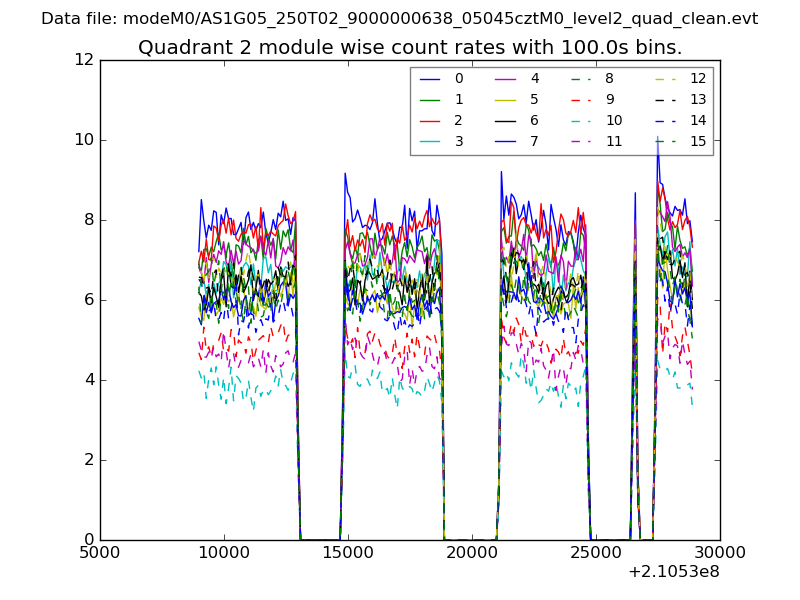
| Module-wise count rates for Quadrant B Data is divided into 100 sec bins |
 |
 |
| Module-wise count rates for Quadrant C Data is divided into 100 sec bins |
 |
 |
| Module-wise count rates for Quadrant D Data is divided into 100 sec bins |
 |
 |
| Parameter | Plot |
|---|---|
| CZT HV Monitor | 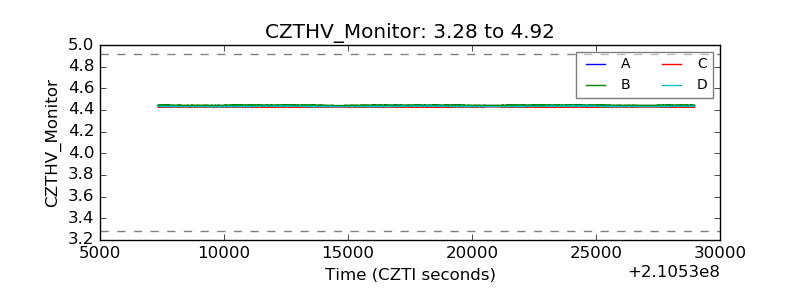 |
| D_VDD | 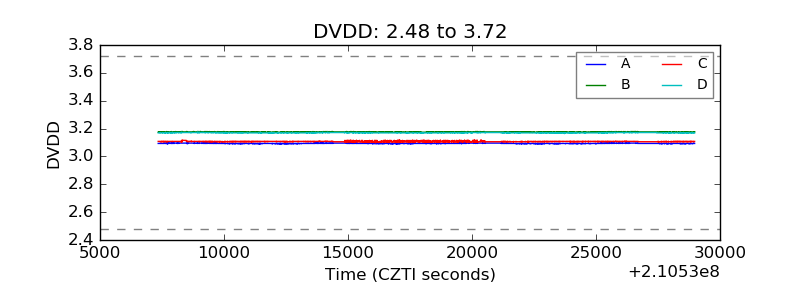 |
| Temperature 1 | 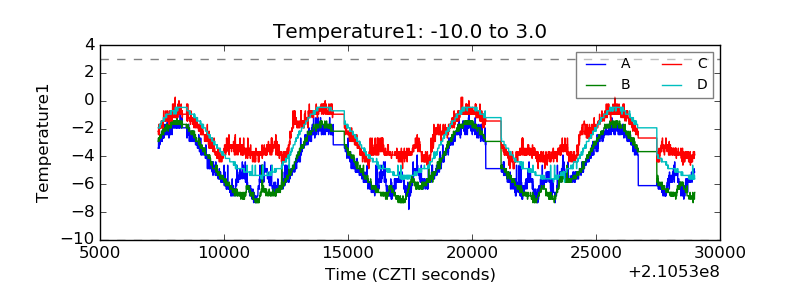 |
| Veto HV Monitor | 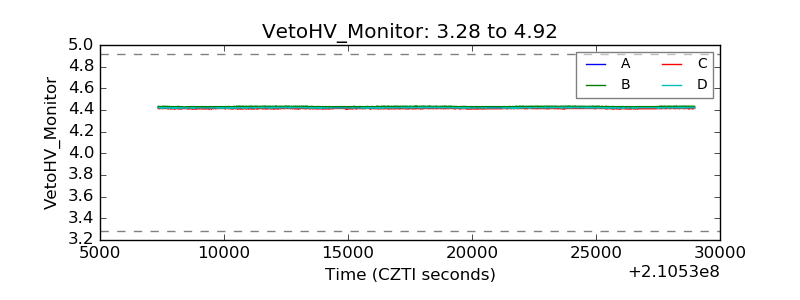 |
| Veto LLD | 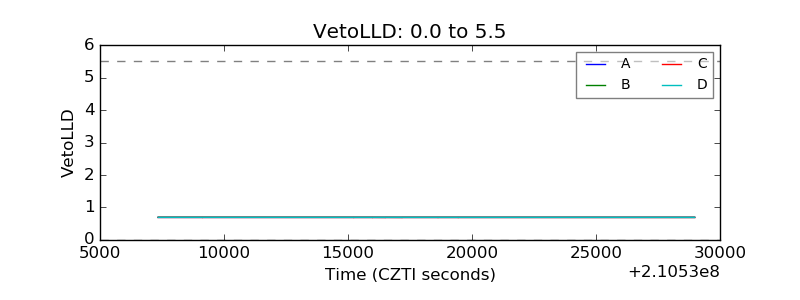 |
| Alpha Counter | 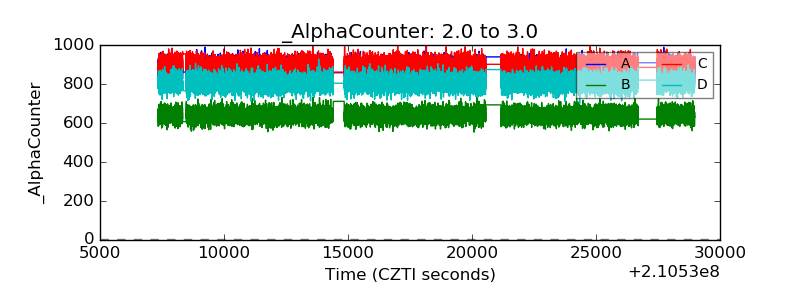 |
| _CPM_Rate | 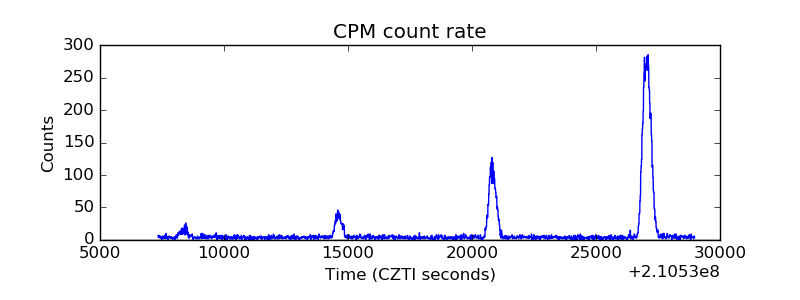 |
| CZT Counter | 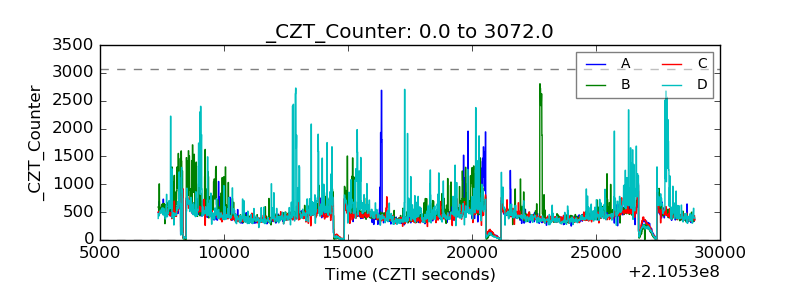 |
| +2.5 Volts monitor |  |
| +5 Volts monitor |  |
| _ROLL_ROT | 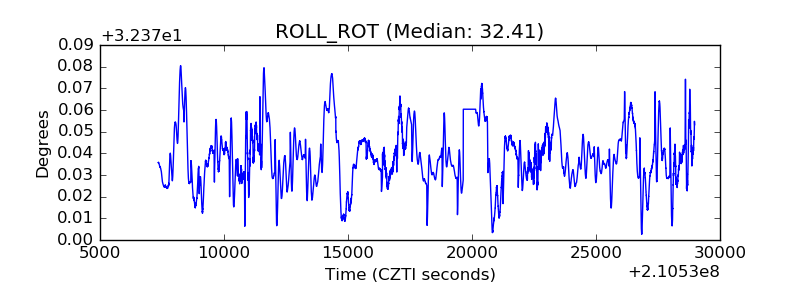 |
| _Roll_DEC | 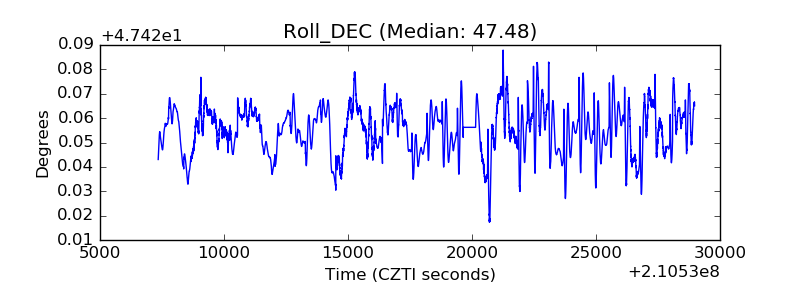 |
| _Roll_RA | 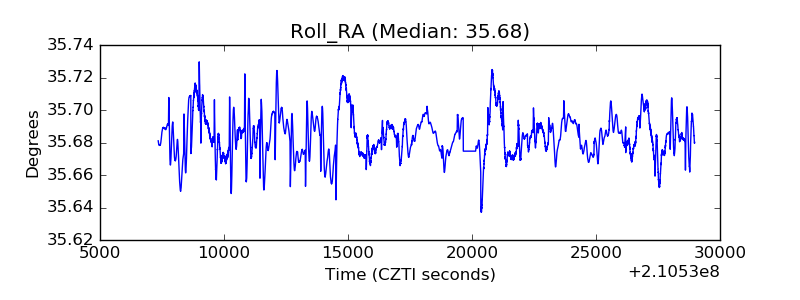 |
| Veto Counter | 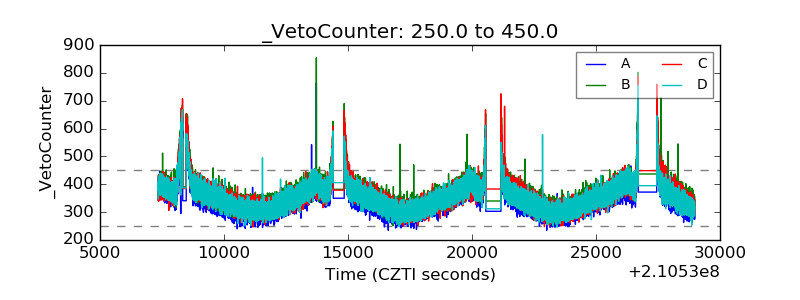 |