| Param | Original file | Final file |
|---|---|---|
| Filename | modeM0/AS1G05_250T02_9000000638_05046cztM0_level2.evt | modeM0/AS1G05_250T02_9000000638_05046cztM0_level2_quad_clean.evt |
| Size (bytes) | 487,739,520 | 87,825,600 |
| Size | 465.1 MB | 83.8 MB |
| Events in quadrant A | 3,225,039 | 543,511 |
| Events in quadrant B | 3,404,833 | 541,809 |
| Events in quadrant C | 3,162,671 | 549,953 |
| Events in quadrant D | 4,485,033 | 518,526 |
| Mode M9 | |||
|---|---|---|---|
| Quadrant | BADHDUFLAG | Total packets | Discarded packets |
| A | 0 | 16 | 0 |
| B | 0 | 16 | 0 |
| C | 0 | 16 | 0 |
| D | 0 | 16 | 0 |
| Mode SS | |||
|---|---|---|---|
| Quadrant | BADHDUFLAG | Total packets | Discarded packets |
| A | 0 | 150 | 0 |
| B | 0 | 150 | 0 |
| C | 0 | 150 | 0 |
| D | 0 | 150 | 0 |
| Mode M0 | |||
|---|---|---|---|
| Quadrant | BADHDUFLAG | Total packets | Discarded packets |
| A | 0 | 14974 | 3 |
| B | 0 | 15302 | 2 |
| C | 0 | 14784 | 2 |
| D | 0 | 18609 | 2 |
| Quadrant | Total seconds | Saturated seconds | Saturation percentage |
|---|---|---|---|
| A | 7261 | 20 | 0.275444% |
| B | 7261 | 47 | 0.647294% |
| C | 7261 | 23 | 0.316761% |
| D | 7261 | 313 | 4.310701% |
Noise dominated data is calculated using 1-second bins in cleaned event files. If a bin has >2000 counts, and if more than 50% of those come from <1% of pixels, then it is considered to be noise-dominated and hence unusable.
| Quadrant | # 1 sec bins | Bins with >0 counts | Bins with >2000 counts | High rate bins dominated by noise | Noise dominated (total time) | Noise dominated (detector-on time) | Marked lightcurve |
|---|---|---|---|---|---|---|---|
| A | 8946 | 7263 | 0 | 0 | 0.00% | 0.00% |  |
| B | 8946 | 7263 | 0 | 0 | 0.00% | 0.00% |  |
| C | 8946 | 7263 | 0 | 0 | 0.00% | 0.00% |  |
| D | 8946 | 7263 | 208 | 208 | 2.33% | 2.86% | 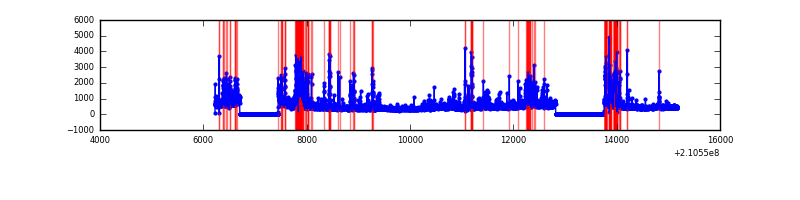 |
Top three noisy pixels from each quadrant. If the there are fewer than three noisy pixels in the level2.evt file, extra rows are filled as -1
| Pixel properties | Quadrant properties | ||||||
|---|---|---|---|---|---|---|---|
| Quadrant | DetID | PixID | Counts | Sigma | Mean | Median | Sigma |
| A | 13 | 251 | 19710 | 110.74 | 826 | 806 | 170.7 |
| A | 15 | 174 | 14122 | 78.0 | 826 | 806 | 170.7 |
| A | 0 | 50 | 12325 | 67.48 | 826 | 806 | 170.7 |
| B | 15 | 204 | 111247 | 690.03 | 835 | 815 | 160.0 |
| B | 0 | 219 | 24650 | 148.93 | 835 | 815 | 160.0 |
| B | 5 | 70 | 14782 | 87.27 | 835 | 815 | 160.0 |
| C | 14 | 67 | 7821 | 37.42 | 806 | 809 | 187.4 |
| C | 13 | 61 | 6638 | 31.1 | 806 | 809 | 187.4 |
| C | 9 | 54 | 5625 | 25.7 | 806 | 809 | 187.4 |
| D | 13 | 235 | 631178 | 3284.28 | 785 | 763 | 191.9 |
| D | 2 | 33 | 284532 | 1478.35 | 785 | 763 | 191.9 |
| D | 1 | 7 | 268449 | 1394.57 | 785 | 763 | 191.9 |
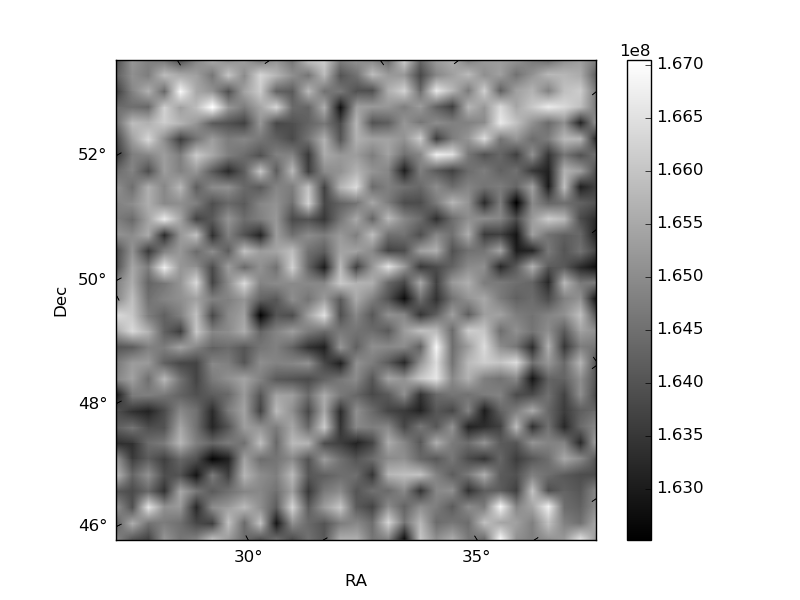
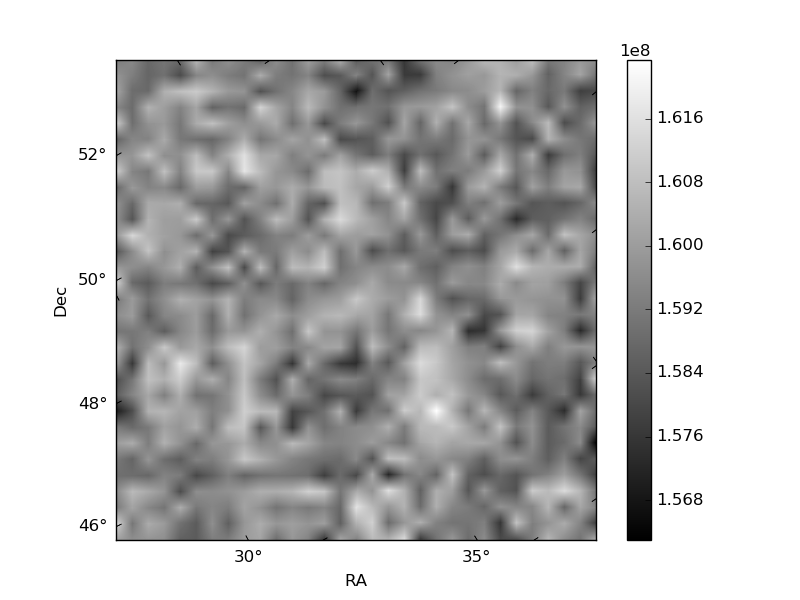
Histogram calculated using DETX and DETY for each event in the final _common_clean file
| Quadrant A | 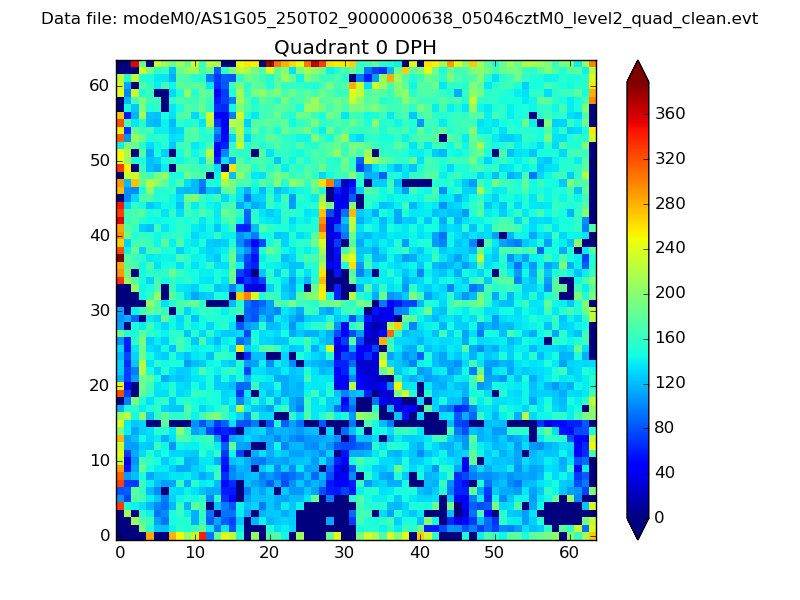 |
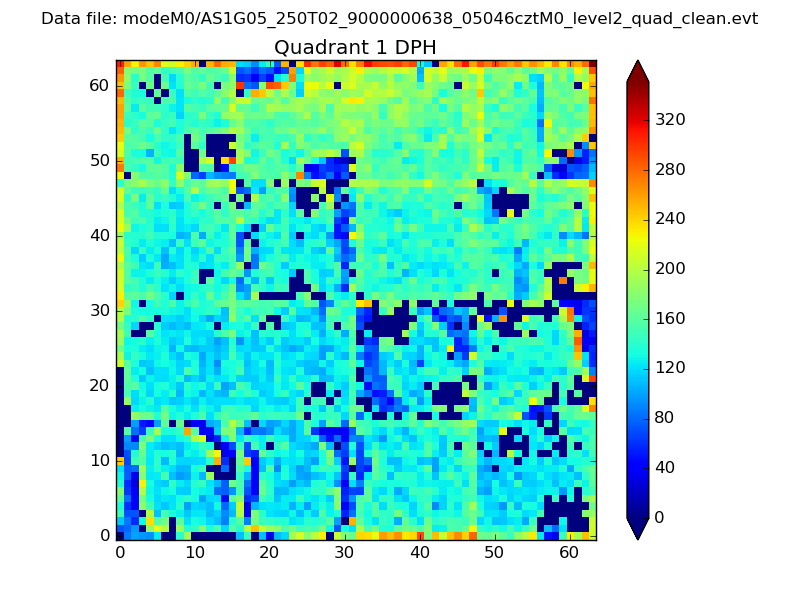 |
Quadrant B |
|---|---|---|---|
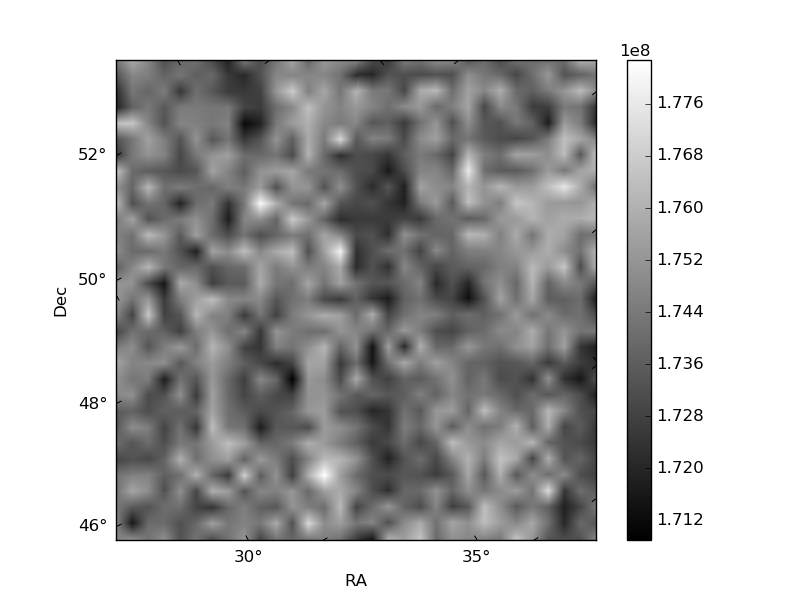
| Quadrant D | 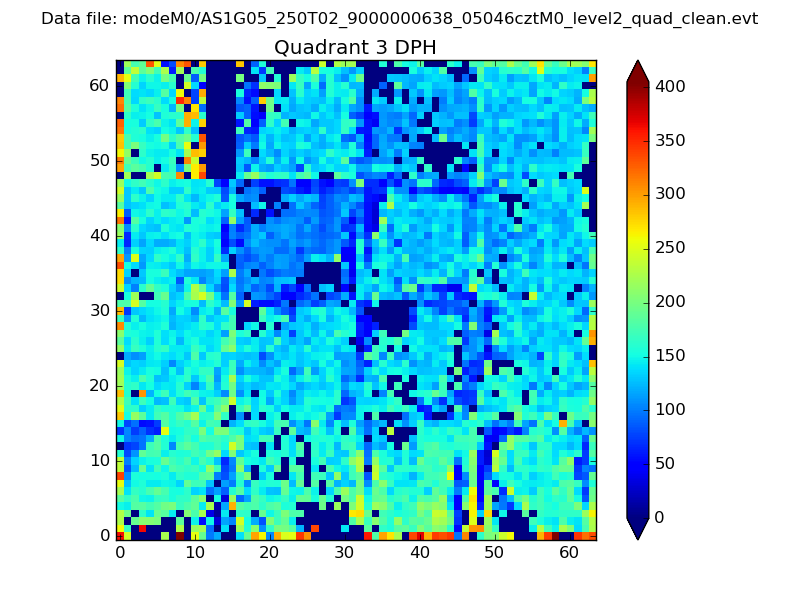 |
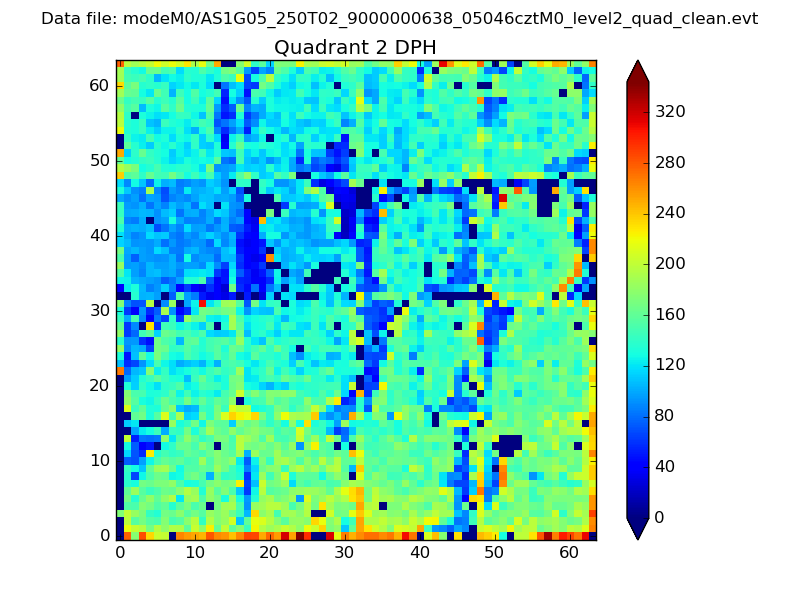 |
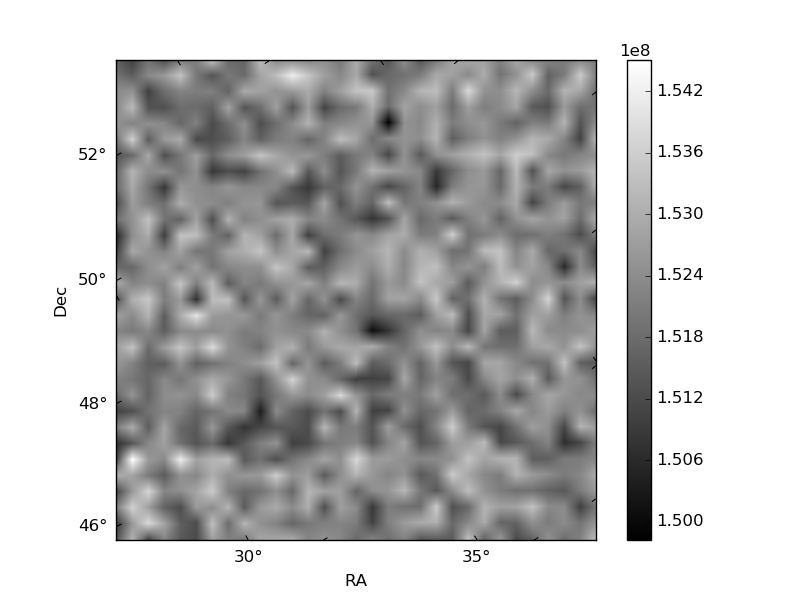
Quadrant C |
| Plot type | Count rate plots | Images |
|---|---|---|
| Comparison with Poisson distribution Blue bars denote a histogram of data divided into 1 sec bins. Red curve is a Poisson curve with rate = median count rate of data. |
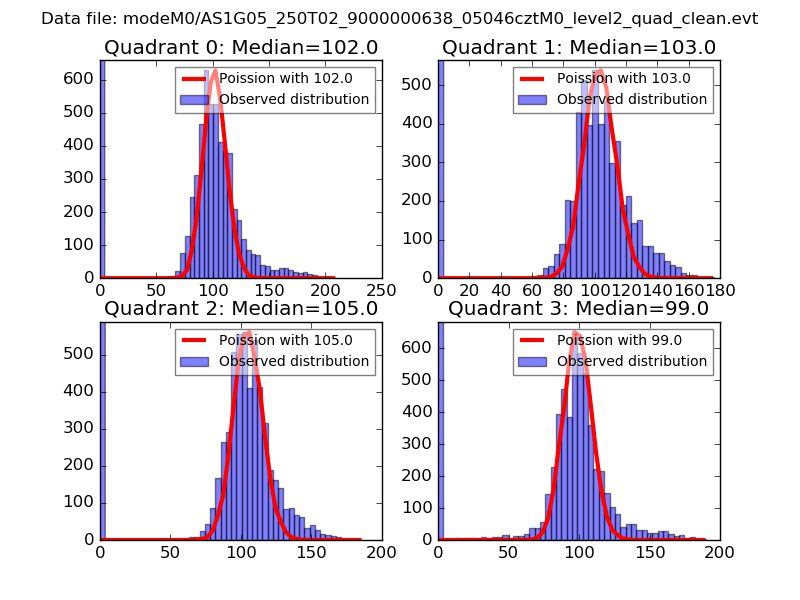 |
 |
| Quadrant-wise count rates Data is divided into 100 sec bins |
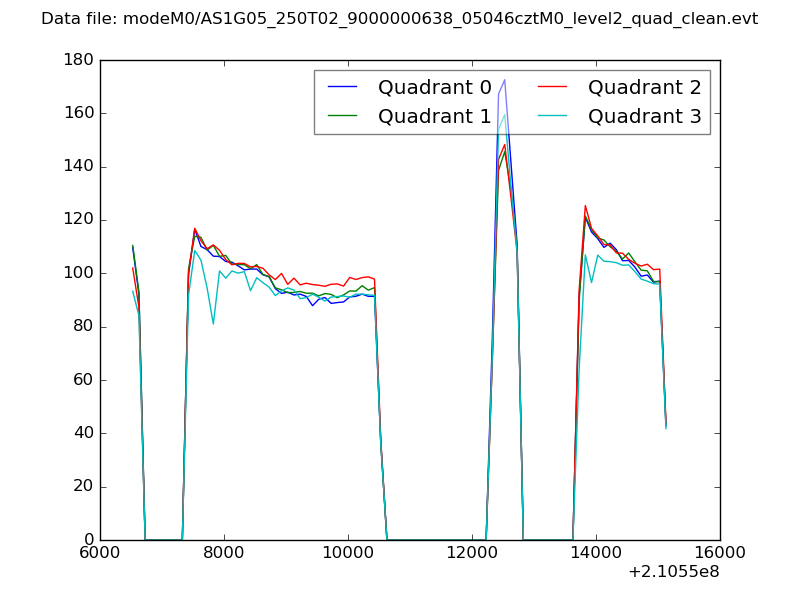 |
|
| Module-wise count rates for Quadrant A Data is divided into 100 sec bins |
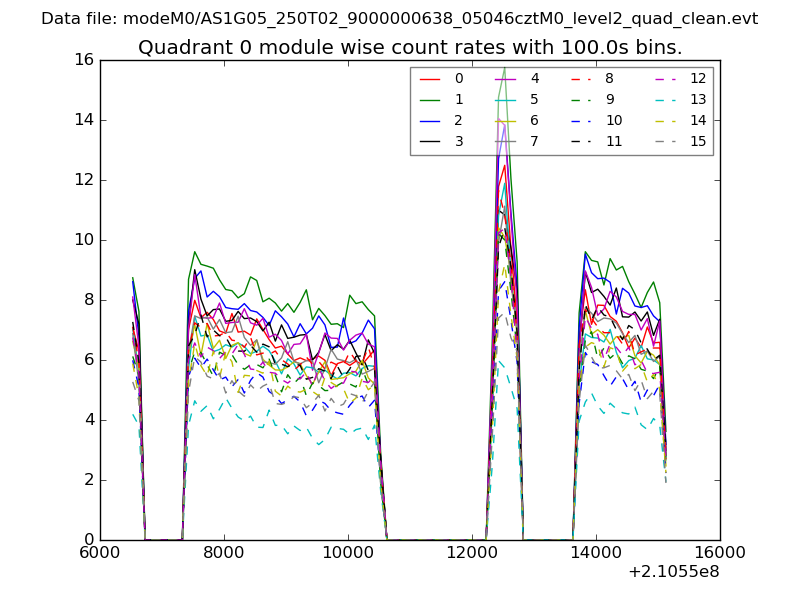 |
 |
| Module-wise count rates for Quadrant B Data is divided into 100 sec bins |
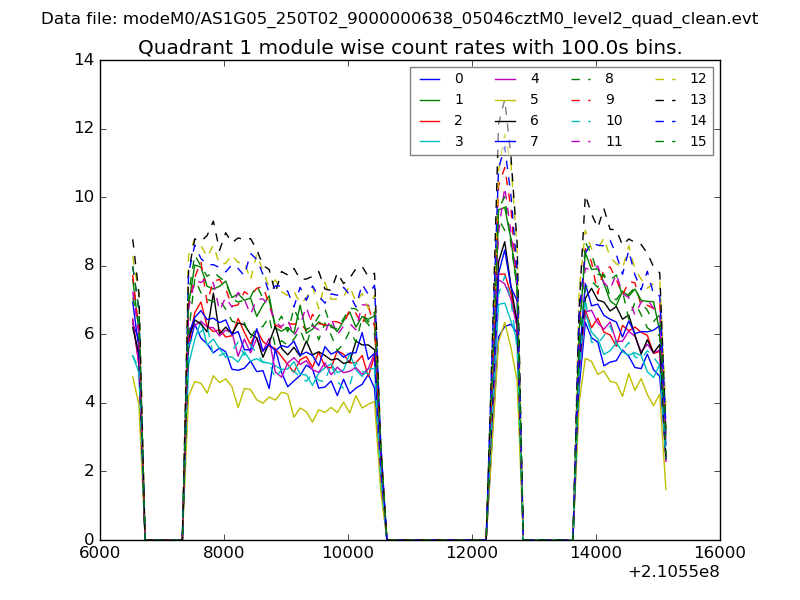 |
 |
| Module-wise count rates for Quadrant C Data is divided into 100 sec bins |
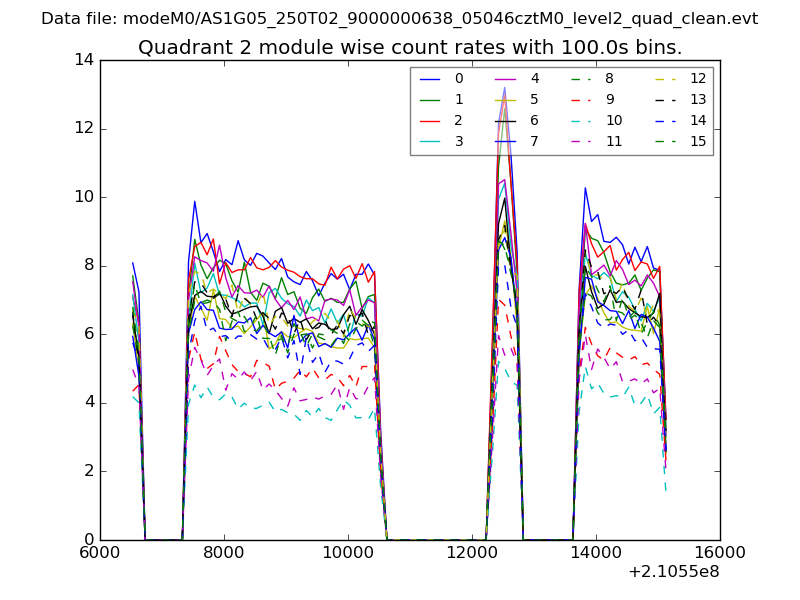 |
 |
| Module-wise count rates for Quadrant D Data is divided into 100 sec bins |
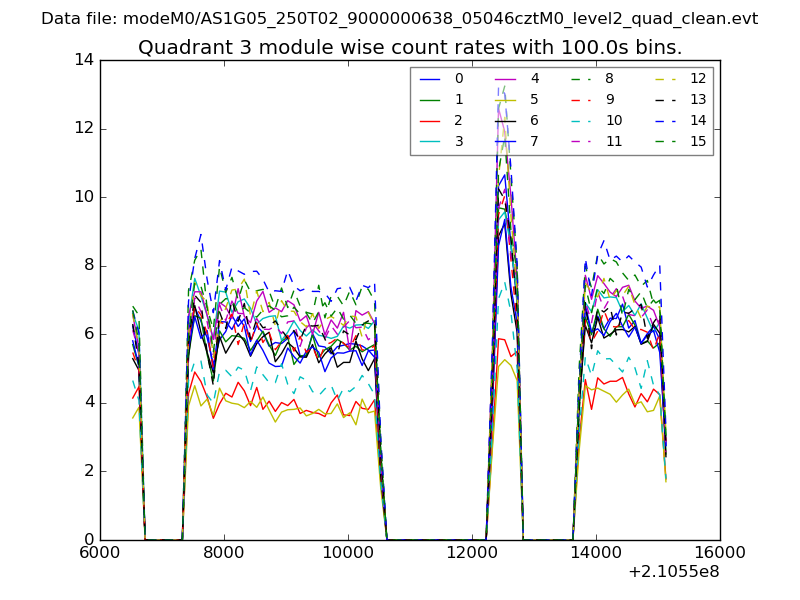 |
 |
| Parameter | Plot |
|---|---|
| CZT HV Monitor | 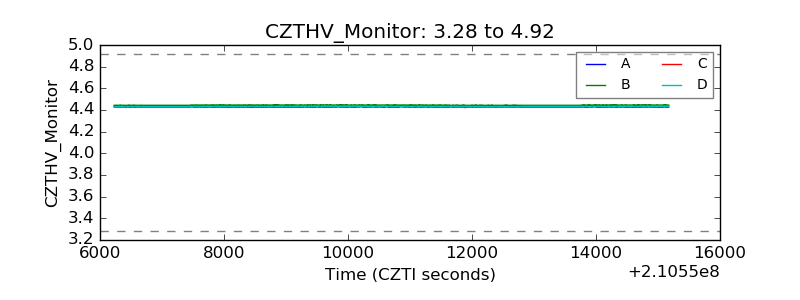 |
| D_VDD | 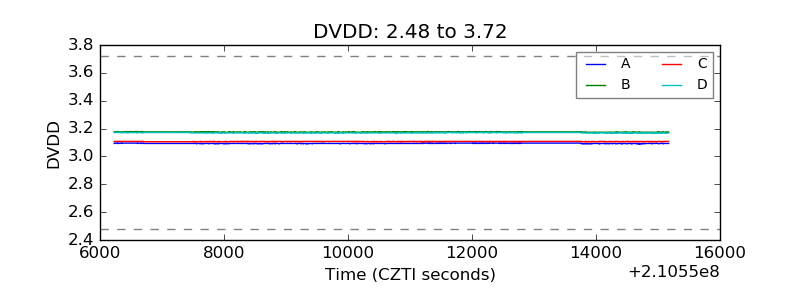 |
| Temperature 1 | 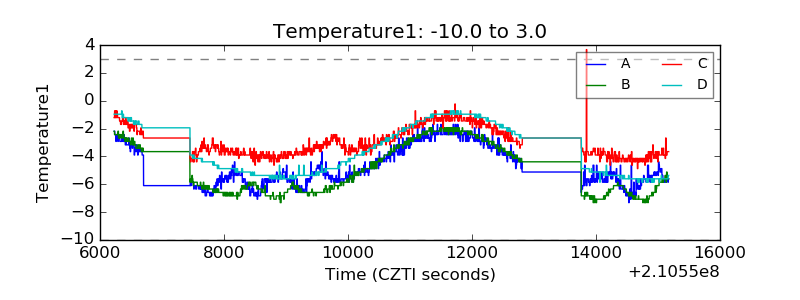 |
| Veto HV Monitor | 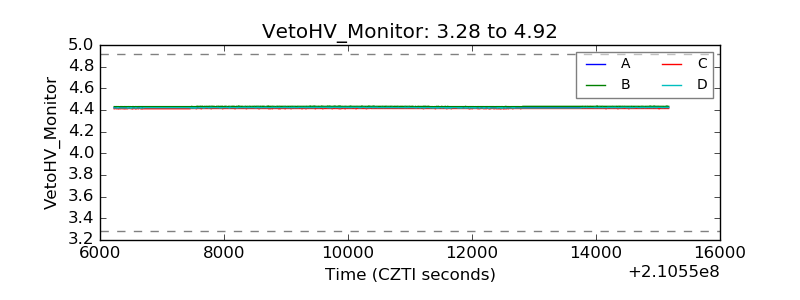 |
| Veto LLD | 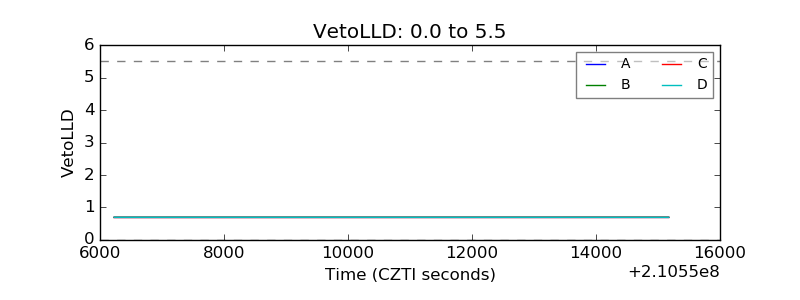 |
| Alpha Counter | 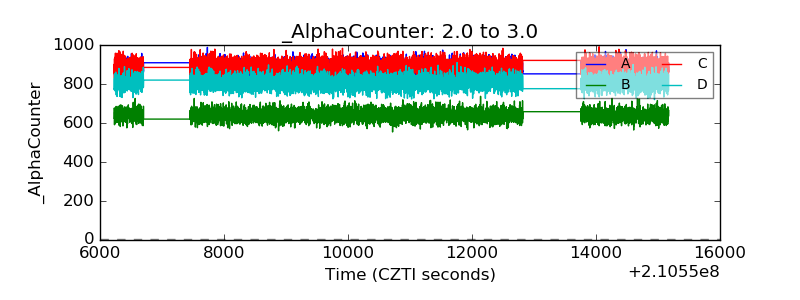 |
| _CPM_Rate | 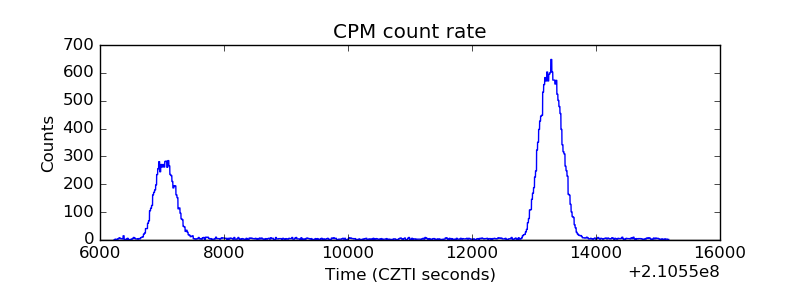 |
| CZT Counter | 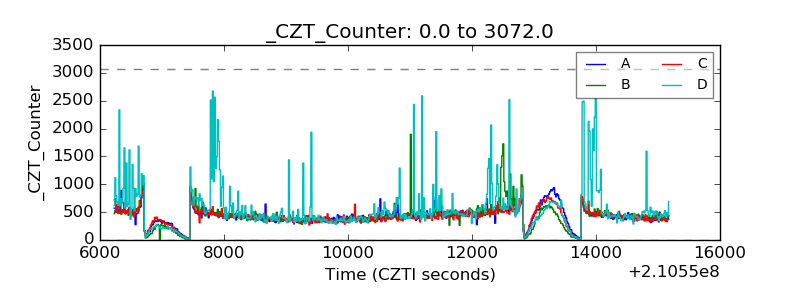 |
| +2.5 Volts monitor |  |
| +5 Volts monitor |  |
| _ROLL_ROT | 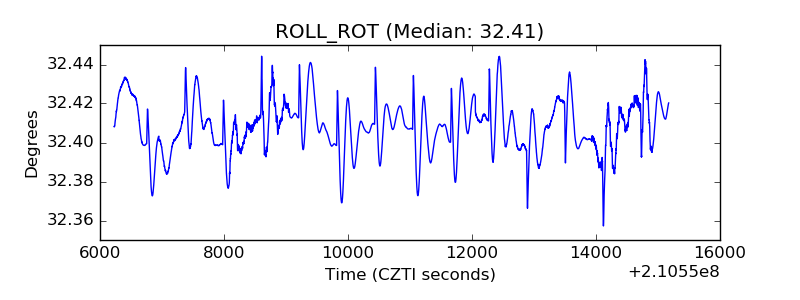 |
| _Roll_DEC | 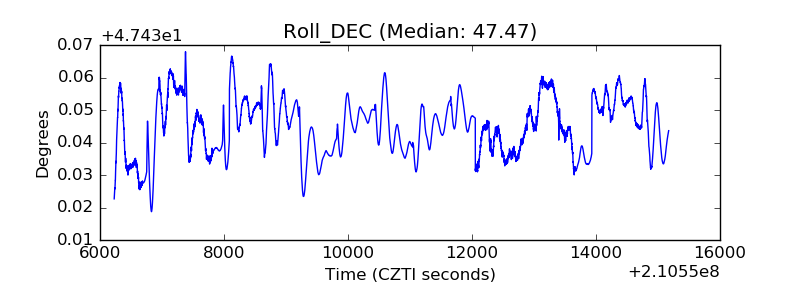 |
| _Roll_RA | 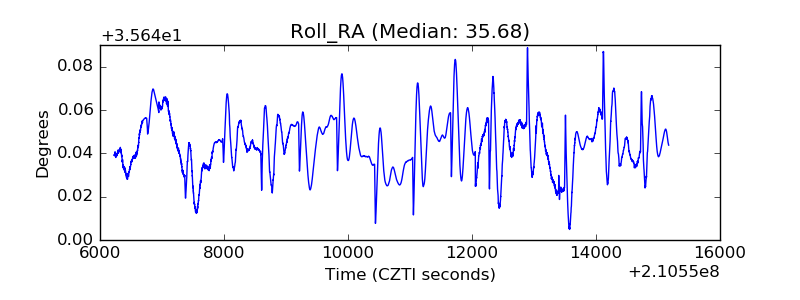 |
| Veto Counter | 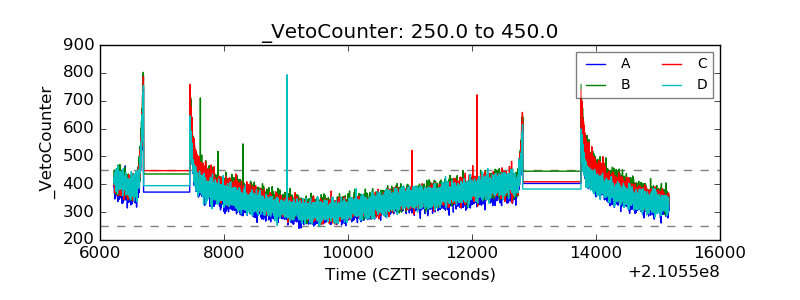 |