| Param | Original file | Final file |
|---|---|---|
| Filename | modeM0/AS1G05_218T04_9000000640cztM0_level2.fits | modeM0/AS1G05_218T04_9000000640cztM0_level2_quad_clean.evt |
| Size (bytes) | 919,546,560 | 846,650,880 |
| Size | 876.9 MB | 807.4 MB |
| Events in quadrant A | 5,572,238 | 4,984,217 |
| Events in quadrant B | 5,391,220 | 5,045,398 |
| Events in quadrant C | 5,474,002 | 4,780,223 |
| Events in quadrant D | 4,433,528 | 3,861,138 |
| Mode SS | |||
|---|---|---|---|
| Quadrant | BADHDUFLAG | Total packets | Discarded packets |
| A | 0 | 2074 | 0 |
| B | 0 | 2074 | 0 |
| C | 0 | 2074 | 0 |
| D | 0 | 2064 | 0 |
| Mode M9 | |||
|---|---|---|---|
| Quadrant | BADHDUFLAG | Total packets | Discarded packets |
| A | 0 | 138 | 0 |
| B | 0 | 138 | 0 |
| C | 0 | 138 | 0 |
| D | 0 | 138 | 0 |
| Mode M0 | |||
|---|---|---|---|
| Quadrant | BADHDUFLAG | Total packets | Discarded packets |
| A | 0 | 230005 | 0 |
| B | 0 | 214580 | 0 |
| C | 0 | 224277 | 0 |
| D | 0 | 325477 | 0 |
| Quadrant | Total seconds | Saturated seconds | Saturation percentage |
|---|---|---|---|
| A | 101711 | 3175 | 3.121590% |
| B | 101691 | 1529 | 1.503575% |
| C | 101708 | 1170 | 1.150352% |
| D | 101649 | 14324 | 14.091629% |
Noise dominated data is calculated using 1-second bins in cleaned event files. If a bin has >2000 counts, and if more than 50% of those come from <1% of pixels, then it is considered to be noise-dominated and hence unusable.
| Quadrant | # 1 sec bins | Bins with >0 counts | Bins with >2000 counts | High rate bins dominated by noise | Noise dominated (total time) | Noise dominated (detector-on time) | Marked lightcurve |
|---|---|---|---|---|---|---|---|
| A | 151810 | 101941 | 0 | 0 | 0.00% | 0.00% |  |
| B | 151810 | 101947 | 0 | 0 | 0.00% | 0.00% |  |
| C | 151810 | 101949 | 0 | 0 | 0.00% | 0.00% |  |
| D | 151810 | 101296 | 0 | 0 | 0.00% | 0.00% | 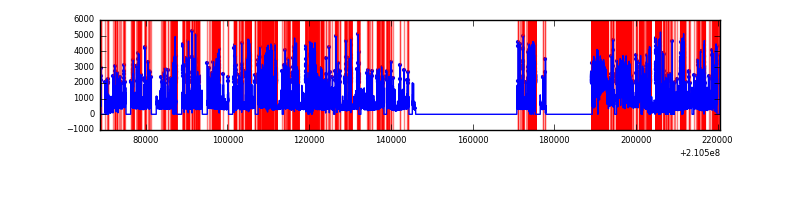 |
Top three noisy pixels from each quadrant. If the there are fewer than three noisy pixels in the level2.evt file, extra rows are filled as -1
| Pixel properties | Quadrant properties | ||||||
|---|---|---|---|---|---|---|---|
| Quadrant | DetID | PixID | Counts | Sigma | Mean | Median | Sigma |
| A | 14 | 188 | 5408 | 10.97 | 1444 | 1342 | 370.7 |
| A | 0 | 29 | 5327 | 10.75 | 1444 | 1342 | 370.7 |
| A | 7 | 110 | 4757 | 9.21 | 1444 | 1342 | 370.7 |
| B | 2 | 9 | 4563 | 11.23 | 1421 | 1347 | 286.4 |
| B | 12 | 226 | 3829 | 8.67 | 1421 | 1347 | 286.4 |
| B | 14 | 254 | 3810 | 8.6 | 1421 | 1347 | 286.4 |
| C | 12 | 241 | 3947 | 6.78 | 1445 | 1329 | 386.3 |
| C | 1 | 80 | 3903 | 6.66 | 1445 | 1329 | 386.3 |
| C | 1 | 81 | 3835 | 6.49 | 1445 | 1329 | 386.3 |
| D | 11 | 82 | 3440 | 6.75 | 1263 | 1146 | 339.8 |
| D | 3 | 14 | 3256 | 6.21 | 1263 | 1146 | 339.8 |
| D | 1 | 19 | 3221 | 6.11 | 1263 | 1146 | 339.8 |
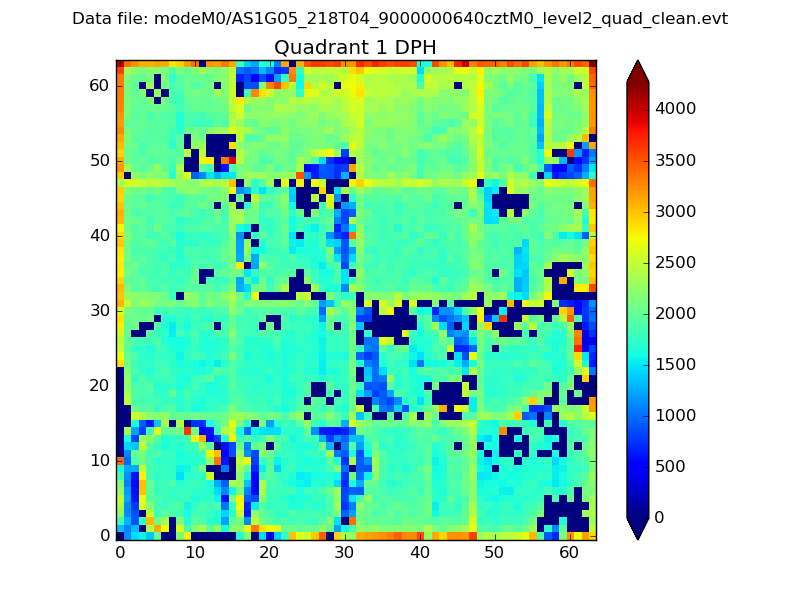
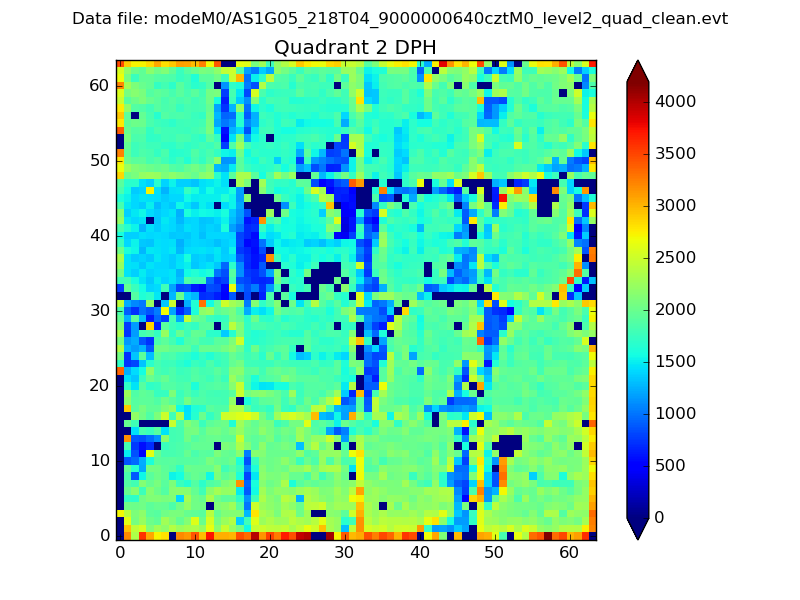
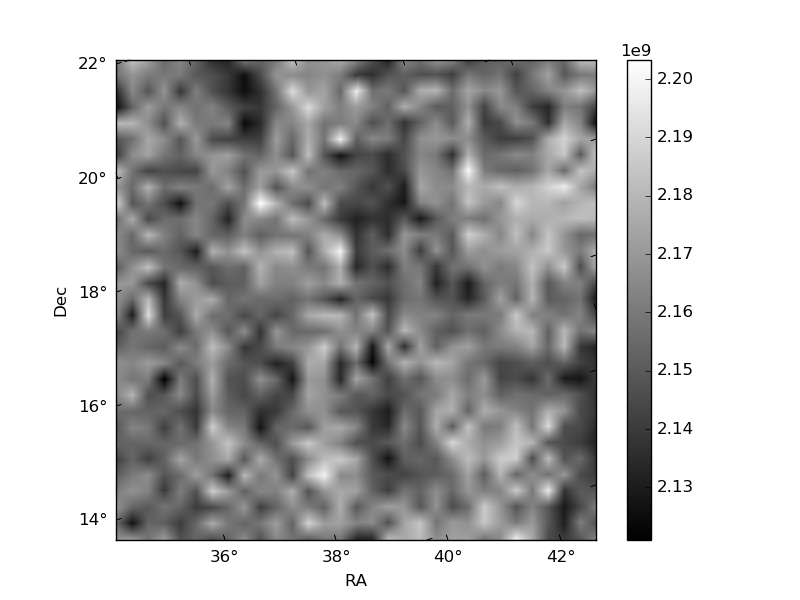
Histogram calculated using DETX and DETY for each event in the final _common_clean file
| Quadrant A |  |
 |
Quadrant B |
|---|---|---|---|
| Quadrant D | 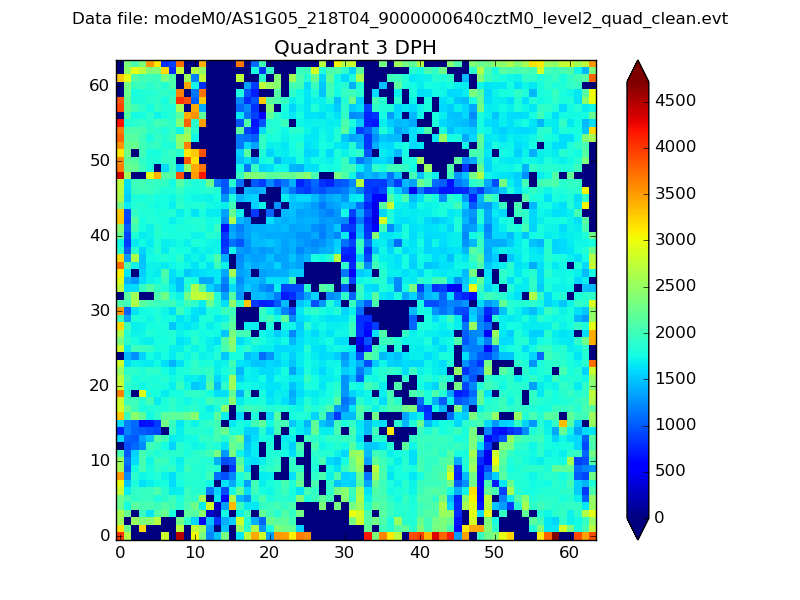 |
 |
Quadrant C |
| Plot type | Count rate plots | Images |
|---|---|---|
| Comparison with Poisson distribution Blue bars denote a histogram of data divided into 1 sec bins. Red curve is a Poisson curve with rate = median count rate of data. |
 |
 |
| Quadrant-wise count rates Data is divided into 100 sec bins |
 |
|
| Module-wise count rates for Quadrant A Data is divided into 100 sec bins |
 |
 |
| Module-wise count rates for Quadrant B Data is divided into 100 sec bins |
 |
 |
| Module-wise count rates for Quadrant C Data is divided into 100 sec bins |
 |
 |
| Module-wise count rates for Quadrant D Data is divided into 100 sec bins |
 |
 |
| Parameter | Plot |
|---|---|
| CZT HV Monitor |  |
| D_VDD |  |
| Temperature 1 |  |
| Veto HV Monitor |  |
| Veto LLD |  |
| Alpha Counter |  |
| _CPM_Rate |  |
| CZT Counter |  |
| +2.5 Volts monitor |  |
| +5 Volts monitor |  |
| _ROLL_ROT | 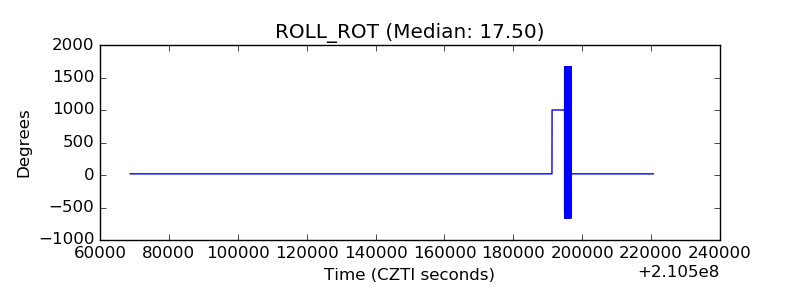 |
| _Roll_DEC | 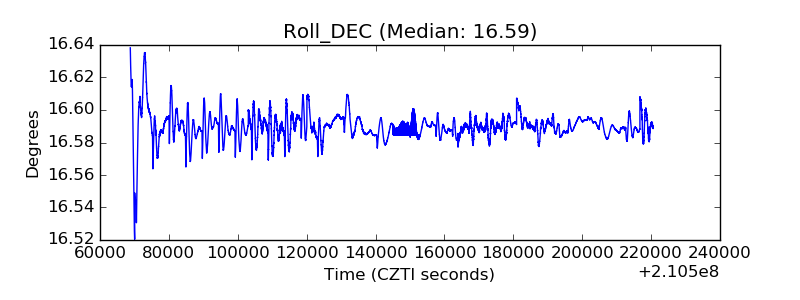 |
| _Roll_RA |  |
| Veto Counter |  |