| Param | Original file | Final file |
|---|---|---|
| Filename | modeM0/AS1G05_218T04_9000000640_05049cztM0_level2.evt | modeM0/AS1G05_218T04_9000000640_05049cztM0_level2_quad_clean.evt |
| Size (bytes) | 480,245,760 | 85,020,480 |
| Size | 458.0 MB | 81.1 MB |
| Events in quadrant A | 3,268,923 | 539,313 |
| Events in quadrant B | 3,314,857 | 530,210 |
| Events in quadrant C | 3,267,877 | 522,326 |
| Events in quadrant D | 4,226,646 | 504,782 |
| Mode SS | |||
|---|---|---|---|
| Quadrant | BADHDUFLAG | Total packets | Discarded packets |
| A | 0 | 142 | 2 |
| B | 0 | 142 | 0 |
| C | 0 | 142 | 2 |
| D | 0 | 142 | 6 |
| Mode M9 | |||
|---|---|---|---|
| Quadrant | BADHDUFLAG | Total packets | Discarded packets |
| A | 0 | 23 | 0 |
| B | 0 | 23 | 0 |
| C | 0 | 23 | 0 |
| D | 0 | 23 | 0 |
| Mode M0 | |||
|---|---|---|---|
| Quadrant | BADHDUFLAG | Total packets | Discarded packets |
| A | 0 | 14540 | 165 |
| B | 0 | 14540 | 195 |
| C | 0 | 14633 | 200 |
| D | 0 | 17491 | 252 |
| Quadrant | Total seconds | Saturated seconds | Saturation percentage |
|---|---|---|---|
| A | 6878 | 101 | 1.468450% |
| B | 6862 | 87 | 1.267852% |
| C | 6856 | 50 | 0.729288% |
| D | 6852 | 143 | 2.086982% |
Noise dominated data is calculated using 1-second bins in cleaned event files. If a bin has >2000 counts, and if more than 50% of those come from <1% of pixels, then it is considered to be noise-dominated and hence unusable.
| Quadrant | # 1 sec bins | Bins with >0 counts | Bins with >2000 counts | High rate bins dominated by noise | Noise dominated (total time) | Noise dominated (detector-on time) | Marked lightcurve |
|---|---|---|---|---|---|---|---|
| A | 9155 | 6945 | 16 | 16 | 0.17% | 0.23% | 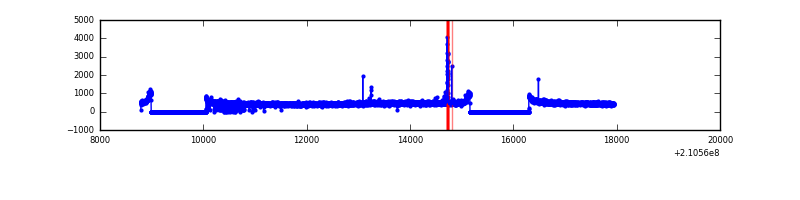 |
| B | 9155 | 6948 | 0 | 0 | 0.00% | 0.00% | 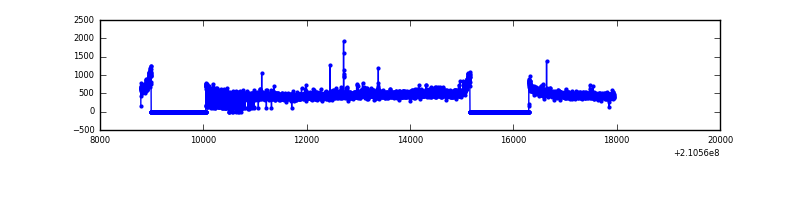 |
| C | 9155 | 6948 | 0 | 0 | 0.00% | 0.00% | 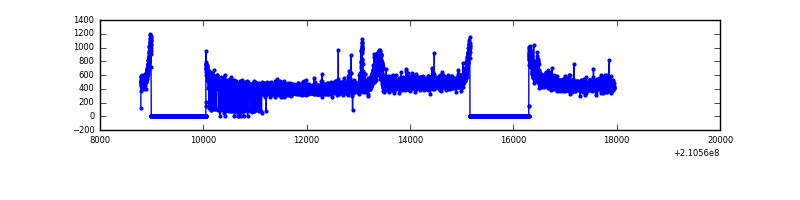 |
| D | 9155 | 6944 | 57 | 57 | 0.62% | 0.82% | 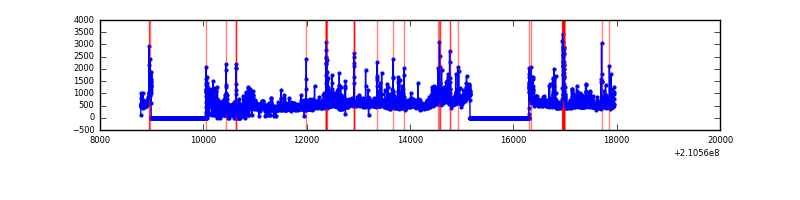 |
Top three noisy pixels from each quadrant. If the there are fewer than three noisy pixels in the level2.evt file, extra rows are filled as -1
| Pixel properties | Quadrant properties | ||||||
|---|---|---|---|---|---|---|---|
| Quadrant | DetID | PixID | Counts | Sigma | Mean | Median | Sigma |
| A | 0 | 50 | 60066 | 351.04 | 831 | 815 | 168.8 |
| A | 0 | 226 | 8454 | 45.26 | 831 | 815 | 168.8 |
| A | 12 | 194 | 8010 | 42.63 | 831 | 815 | 168.8 |
| B | 15 | 204 | 55054 | 339.52 | 828 | 812 | 159.8 |
| B | 0 | 219 | 26870 | 163.11 | 828 | 812 | 159.8 |
| B | 12 | 111 | 14350 | 84.74 | 828 | 812 | 159.8 |
| C | 1 | 16 | 144354 | 775.74 | 793 | 797 | 185.1 |
| C | 14 | 67 | 28852 | 151.6 | 793 | 797 | 185.1 |
| C | 13 | 61 | 6518 | 30.91 | 793 | 797 | 185.1 |
| D | 1 | 7 | 436508 | 2205.66 | 794 | 771 | 197.6 |
| D | 2 | 136 | 218256 | 1100.89 | 794 | 771 | 197.6 |
| D | 12 | 233 | 194522 | 980.75 | 794 | 771 | 197.6 |
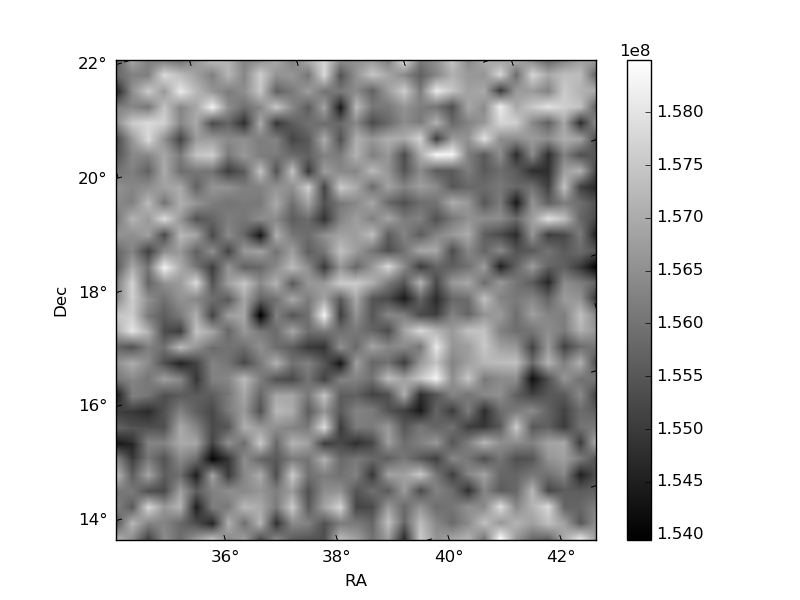
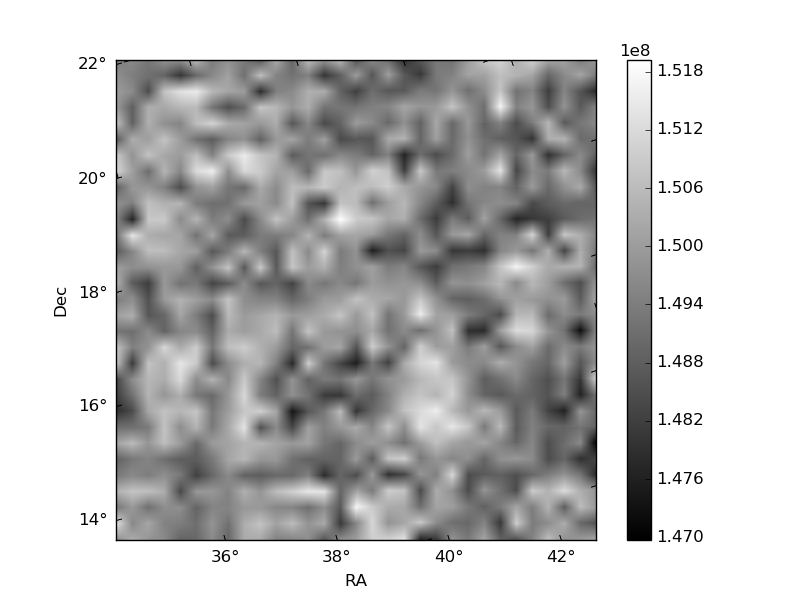
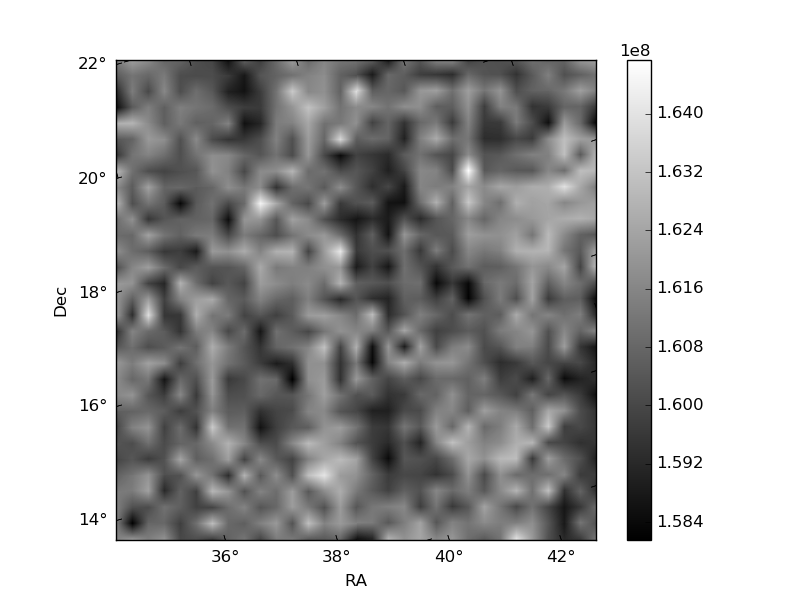
Histogram calculated using DETX and DETY for each event in the final _common_clean file
| Quadrant A | 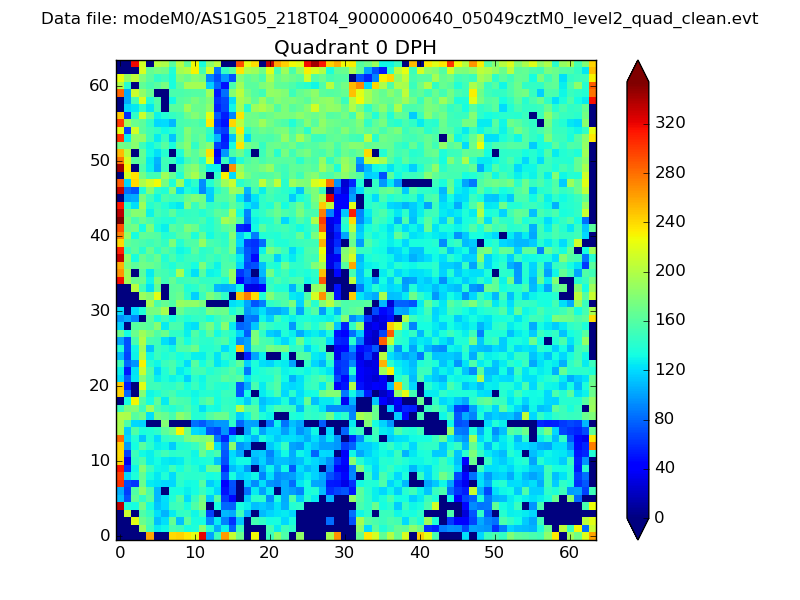 |
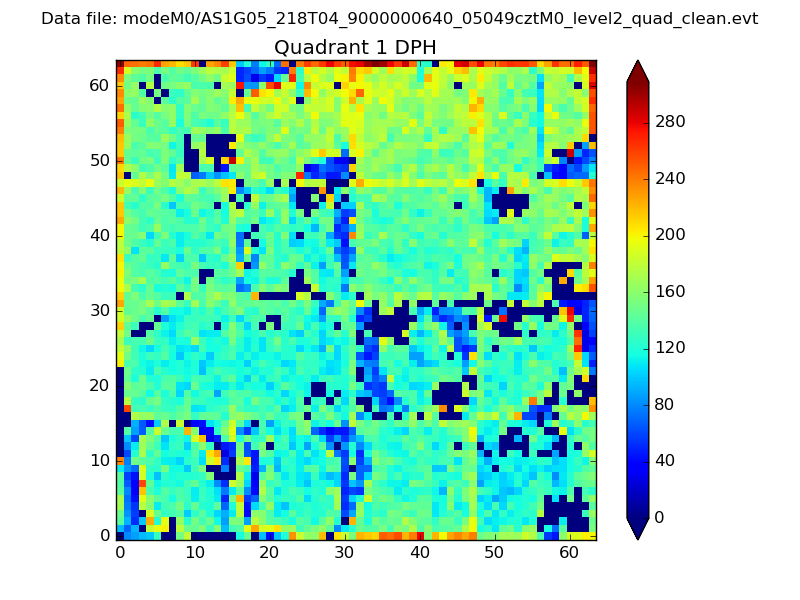 |
Quadrant B |
|---|---|---|---|
| Quadrant D | 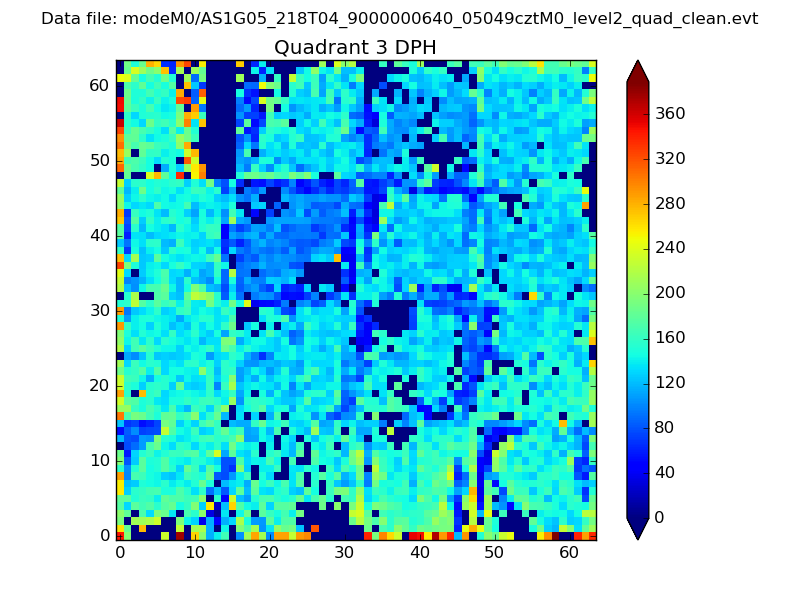 |
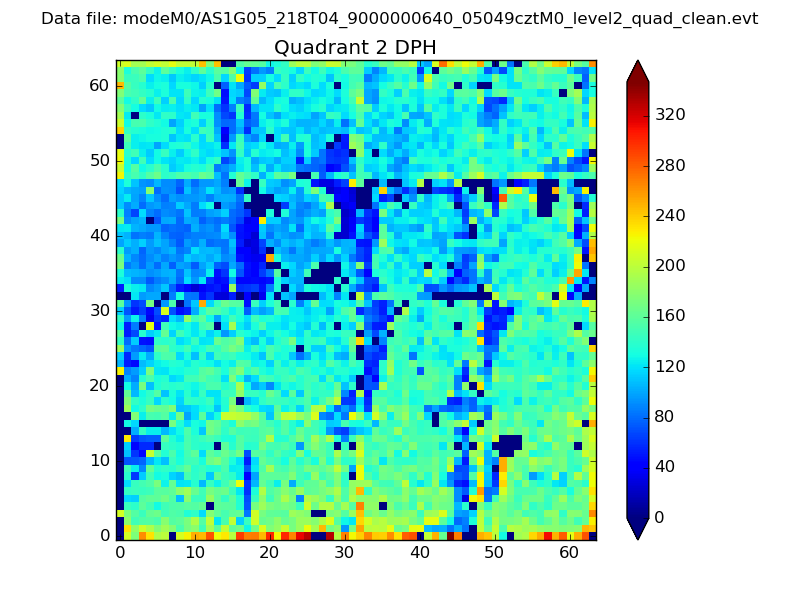 |
Quadrant C |
| Plot type | Count rate plots | Images |
|---|---|---|
| Comparison with Poisson distribution Blue bars denote a histogram of data divided into 1 sec bins. Red curve is a Poisson curve with rate = median count rate of data. |
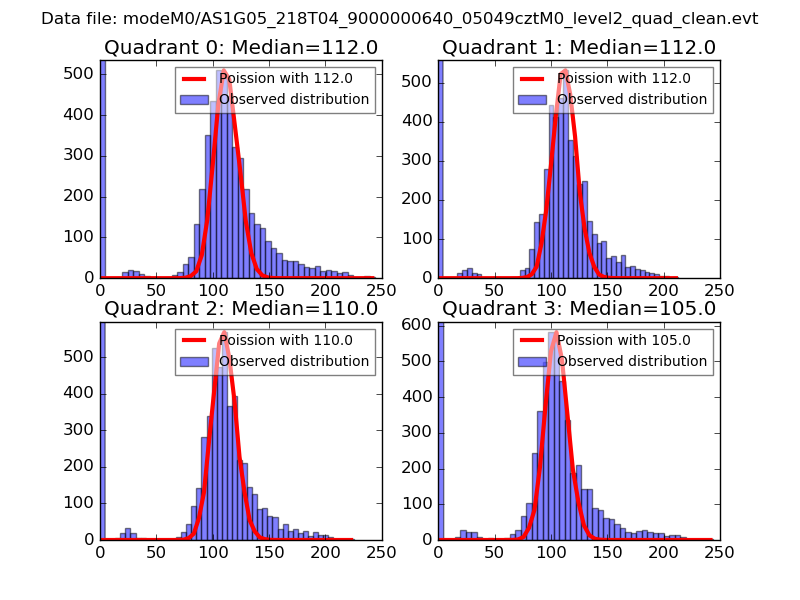 |
 |
| Quadrant-wise count rates Data is divided into 100 sec bins |
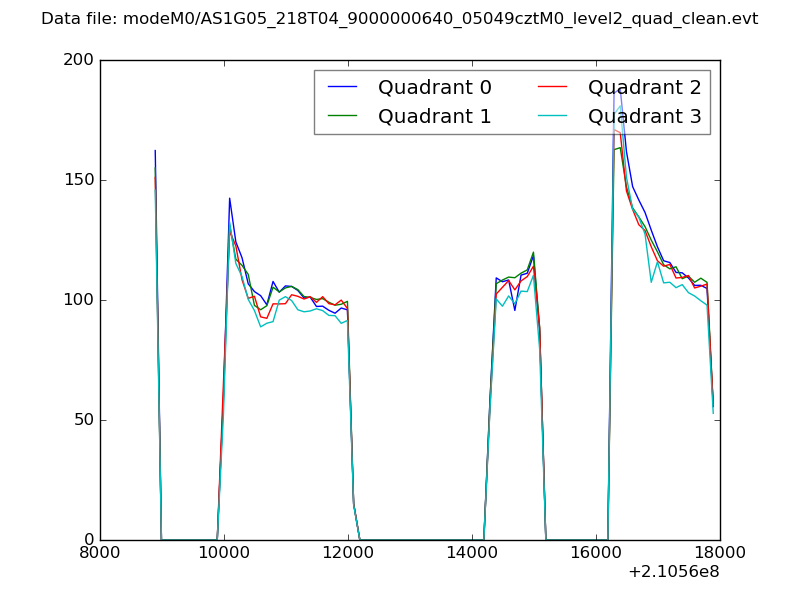 |
|
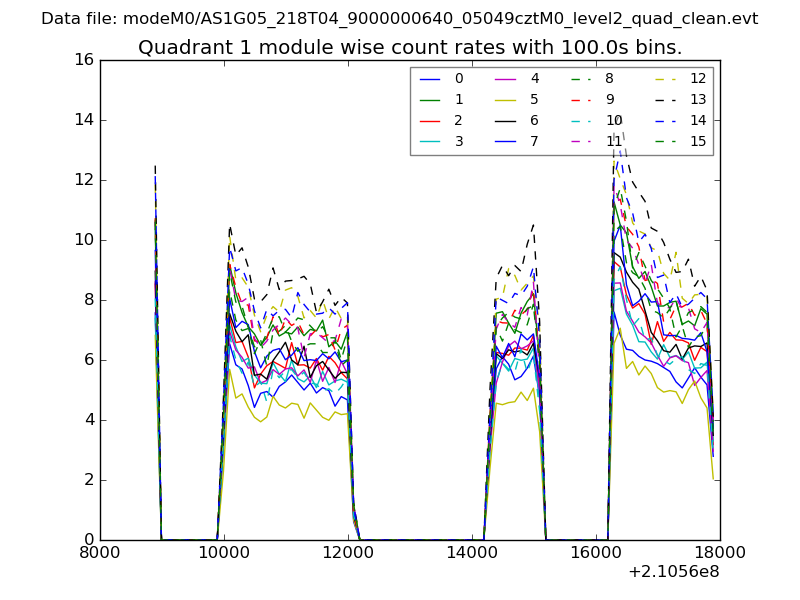
| Module-wise count rates for Quadrant A Data is divided into 100 sec bins |
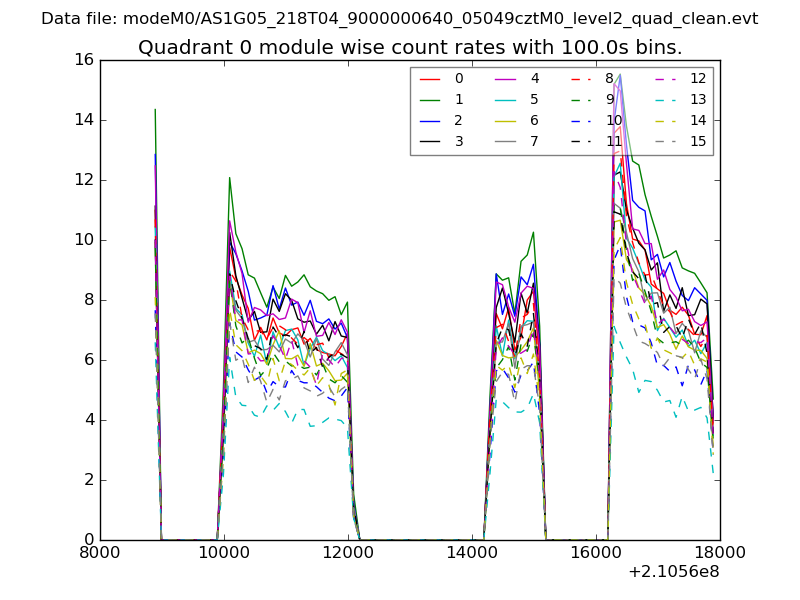 |
 |
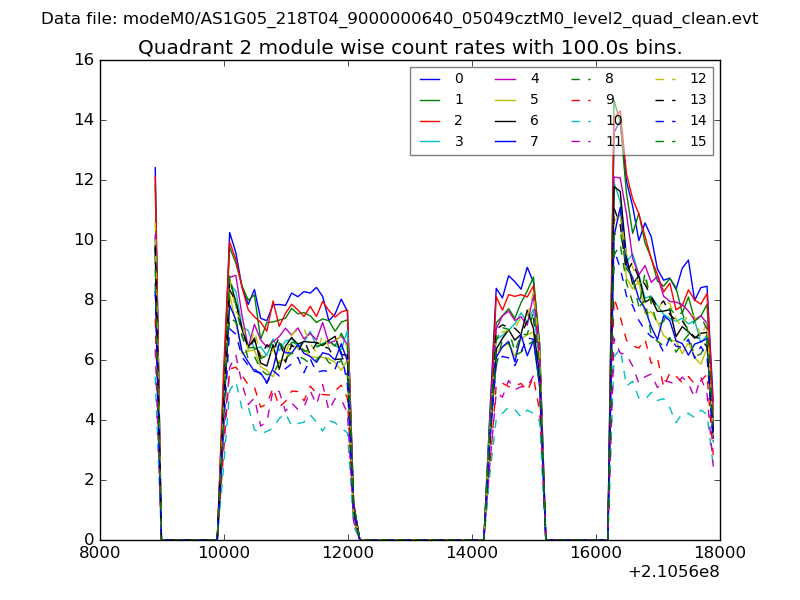
| Module-wise count rates for Quadrant B Data is divided into 100 sec bins |
 |
 |
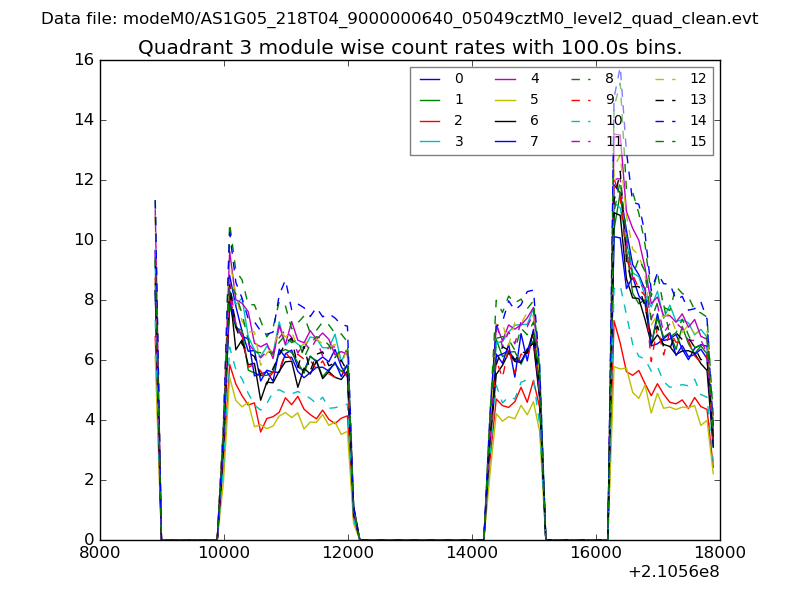
| Module-wise count rates for Quadrant C Data is divided into 100 sec bins |
 |
 |
| Module-wise count rates for Quadrant D Data is divided into 100 sec bins |
 |
 |
| Parameter | Plot |
|---|---|
| CZT HV Monitor | 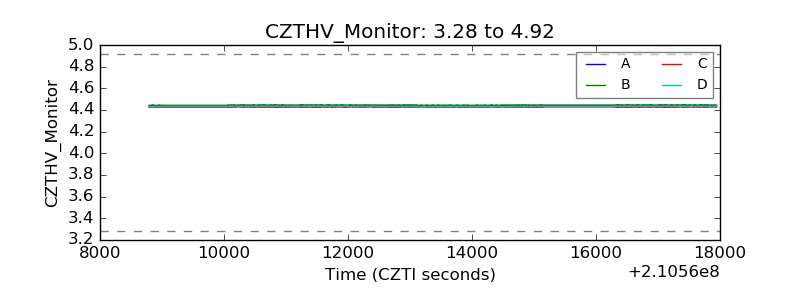 |
| D_VDD |  |
| Temperature 1 | 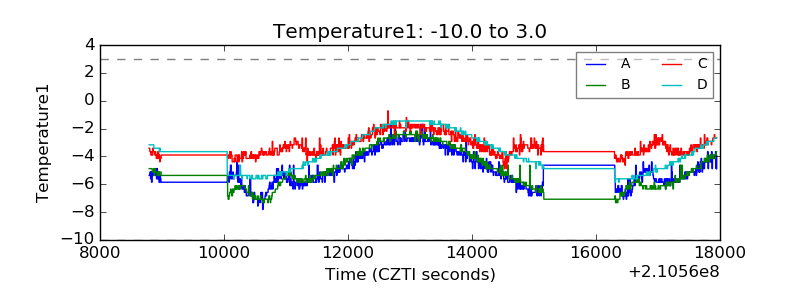 |
| Veto HV Monitor |  |
| Veto LLD | 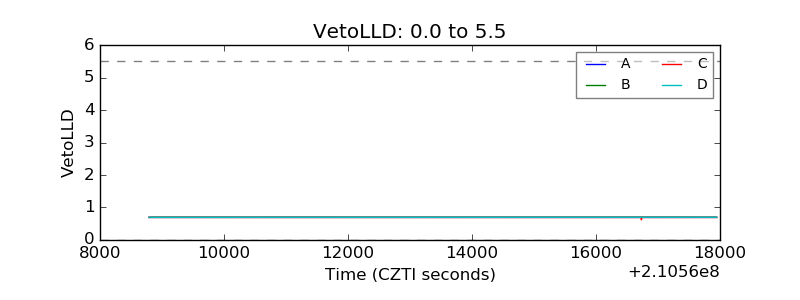 |
| Alpha Counter | 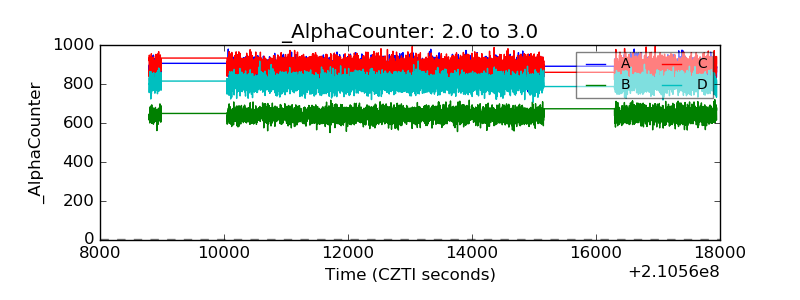 |
| _CPM_Rate | 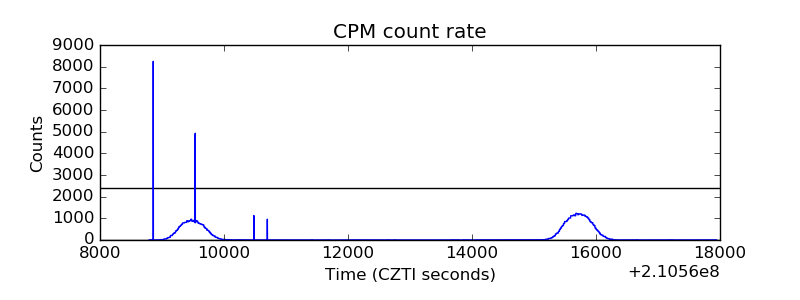 |
| CZT Counter | 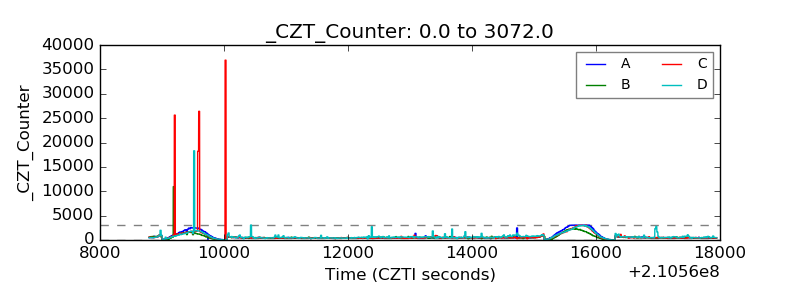 |
| +2.5 Volts monitor |  |
| +5 Volts monitor |  |
| _ROLL_ROT | 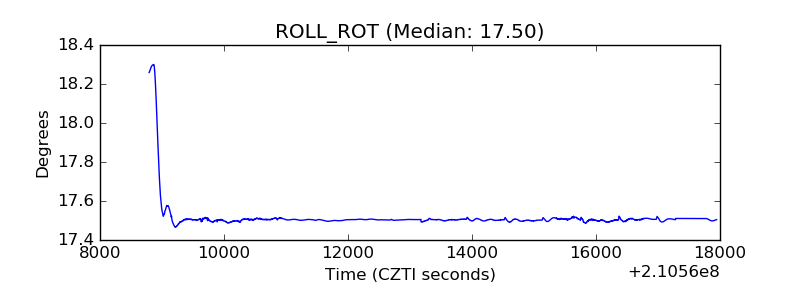 |
| _Roll_DEC | 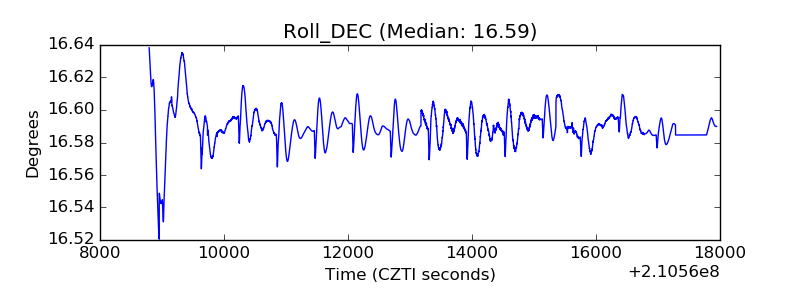 |
| _Roll_RA | 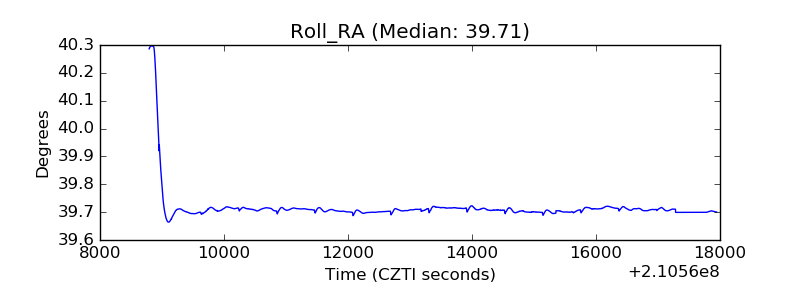 |
| Veto Counter | 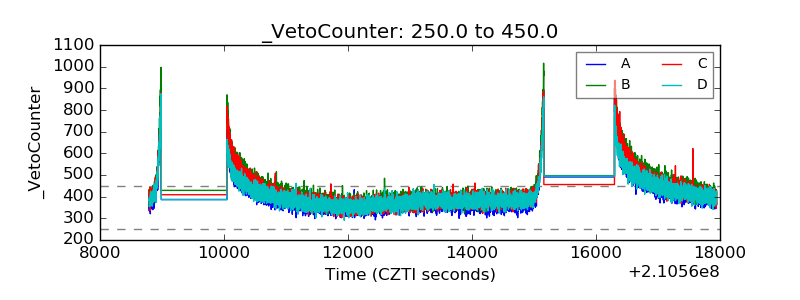 |