| Param | Original file | Final file |
|---|---|---|
| Filename | modeM0/AS1G05_218T04_9000000640_05052cztM0_level2.evt | modeM0/AS1G05_218T04_9000000640_05052cztM0_level2_quad_clean.evt |
| Size (bytes) | 502,727,040 | 64,586,880 |
| Size | 479.4 MB | 61.6 MB |
| Events in quadrant A | 3,348,553 | 382,688 |
| Events in quadrant B | 3,316,323 | 385,867 |
| Events in quadrant C | 4,191,839 | 370,637 |
| Events in quadrant D | 3,924,905 | 360,505 |
| Mode SS | |||
|---|---|---|---|
| Quadrant | BADHDUFLAG | Total packets | Discarded packets |
| A | 0 | 132 | 0 |
| B | 0 | 132 | 0 |
| C | 0 | 132 | 0 |
| D | 0 | 132 | 0 |
| Mode M9 | |||
|---|---|---|---|
| Quadrant | BADHDUFLAG | Total packets | Discarded packets |
| A | 0 | 15 | 0 |
| B | 0 | 15 | 0 |
| C | 0 | 15 | 0 |
| D | 0 | 16 | 0 |
| Mode M0 | |||
|---|---|---|---|
| Quadrant | BADHDUFLAG | Total packets | Discarded packets |
| A | 0 | 14033 | 3 |
| B | 0 | 13803 | 2 |
| C | 0 | 16906 | 2 |
| D | 0 | 15905 | 2 |
| Quadrant | Total seconds | Saturated seconds | Saturation percentage |
|---|---|---|---|
| A | 6536 | 164 | 2.509180% |
| B | 6536 | 125 | 1.912485% |
| C | 6536 | 116 | 1.774786% |
| D | 6536 | 246 | 3.763770% |
Noise dominated data is calculated using 1-second bins in cleaned event files. If a bin has >2000 counts, and if more than 50% of those come from <1% of pixels, then it is considered to be noise-dominated and hence unusable.
| Quadrant | # 1 sec bins | Bins with >0 counts | Bins with >2000 counts | High rate bins dominated by noise | Noise dominated (total time) | Noise dominated (detector-on time) | Marked lightcurve |
|---|---|---|---|---|---|---|---|
| A | 7771 | 6537 | 34 | 34 | 0.44% | 0.52% | 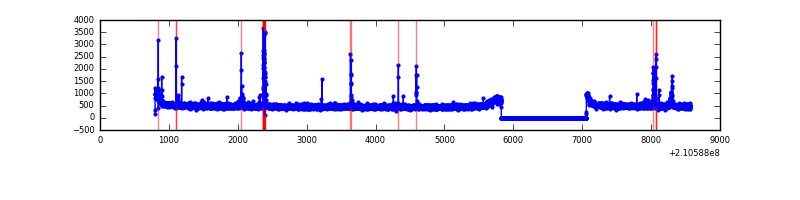 |
| B | 7771 | 6537 | 13 | 13 | 0.17% | 0.20% | 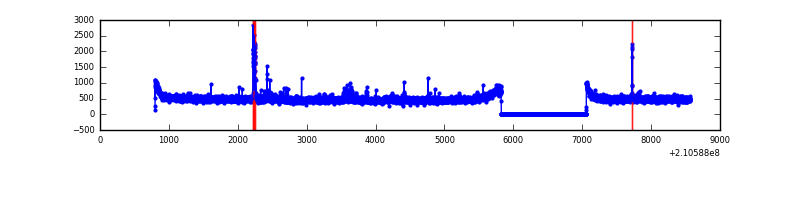 |
| C | 7771 | 6537 | 11 | 11 | 0.14% | 0.17% | 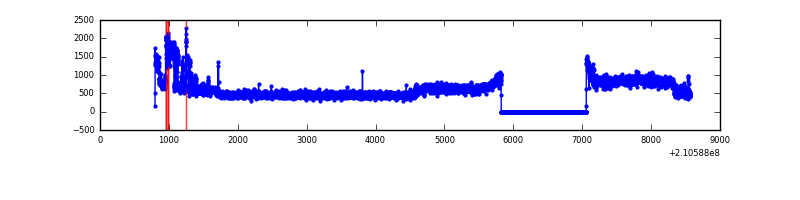 |
| D | 7771 | 6537 | 100 | 100 | 1.29% | 1.53% | 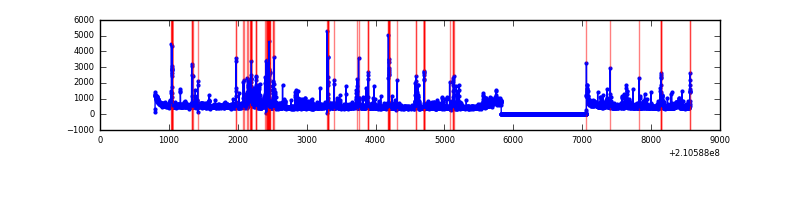 |
Top three noisy pixels from each quadrant. If the there are fewer than three noisy pixels in the level2.evt file, extra rows are filled as -1
| Pixel properties | Quadrant properties | ||||||
|---|---|---|---|---|---|---|---|
| Quadrant | DetID | PixID | Counts | Sigma | Mean | Median | Sigma |
| A | 0 | 50 | 108523 | 649.74 | 821 | 804 | 165.8 |
| A | 15 | 174 | 40435 | 239.04 | 821 | 804 | 165.8 |
| A | 15 | 234 | 24878 | 145.21 | 821 | 804 | 165.8 |
| B | 15 | 54 | 66912 | 418.78 | 820 | 801 | 157.9 |
| B | 15 | 204 | 33590 | 207.7 | 820 | 801 | 157.9 |
| B | 0 | 219 | 25277 | 155.04 | 820 | 801 | 157.9 |
| C | 1 | 16 | 1103184 | 6090.24 | 782 | 786 | 181.0 |
| C | 14 | 67 | 36556 | 197.61 | 782 | 786 | 181.0 |
| C | 13 | 61 | 6303 | 30.48 | 782 | 786 | 181.0 |
| D | 2 | 136 | 302921 | 1550.41 | 789 | 763 | 194.9 |
| D | 13 | 235 | 248803 | 1272.73 | 789 | 763 | 194.9 |
| D | 10 | 15 | 102951 | 524.34 | 789 | 763 | 194.9 |
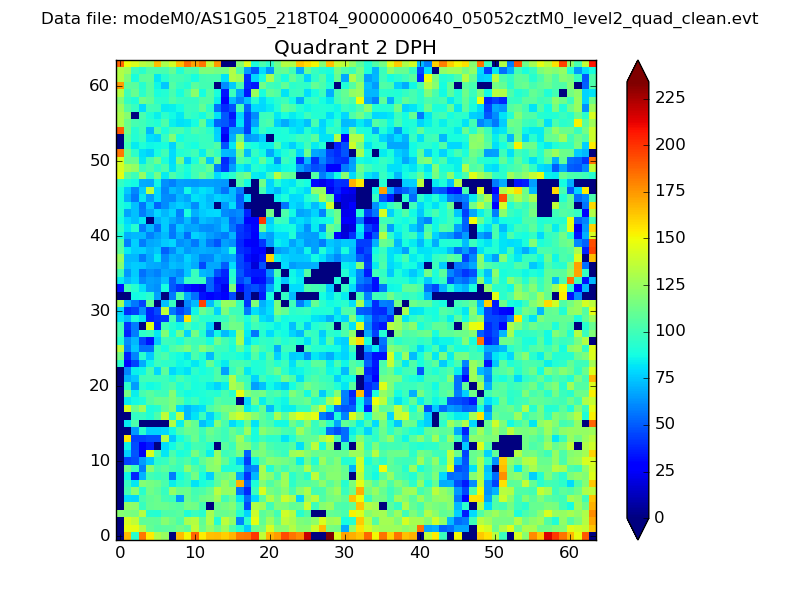
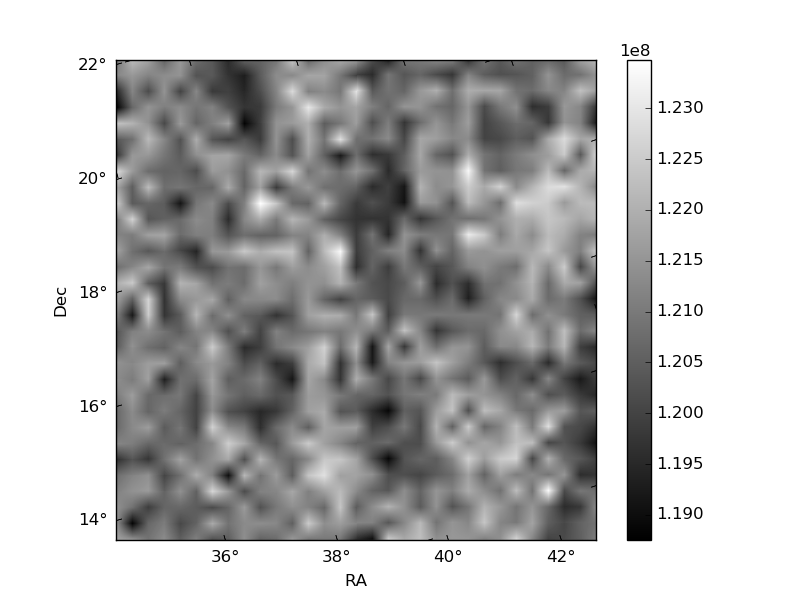
Histogram calculated using DETX and DETY for each event in the final _common_clean file
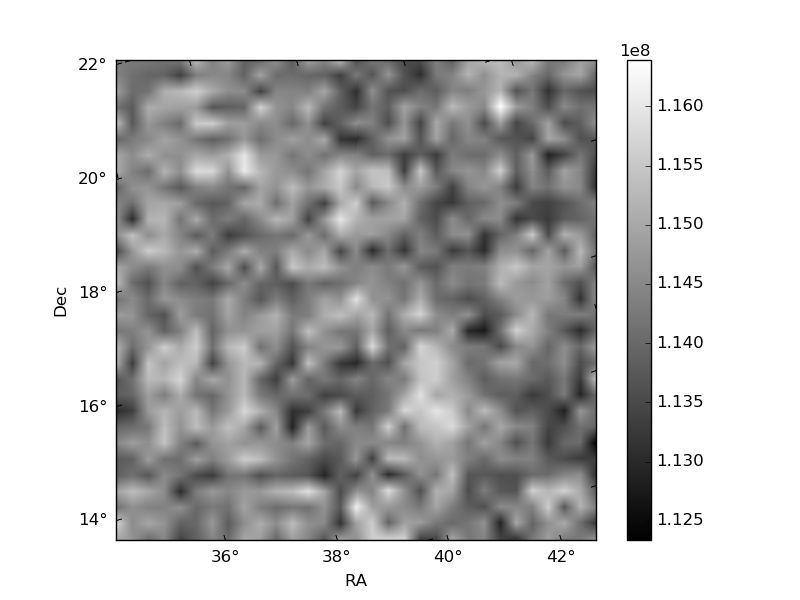
| Quadrant A | 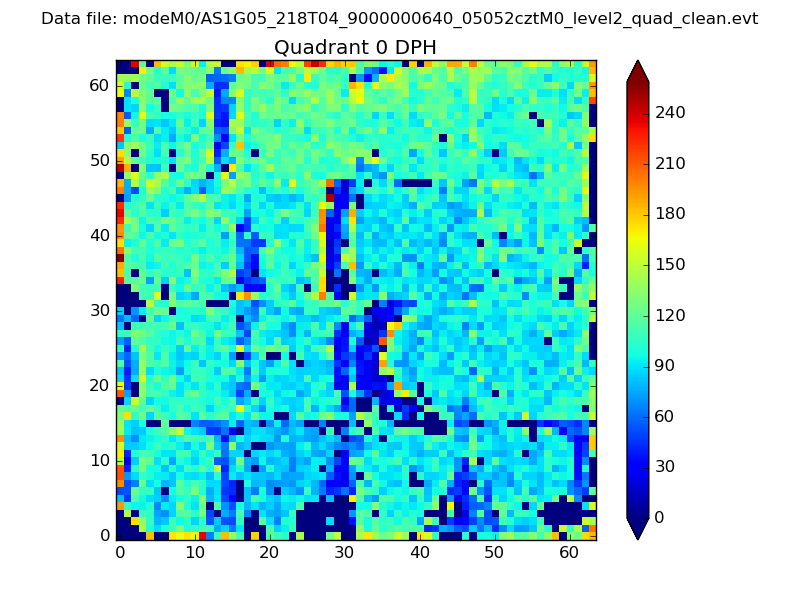 |
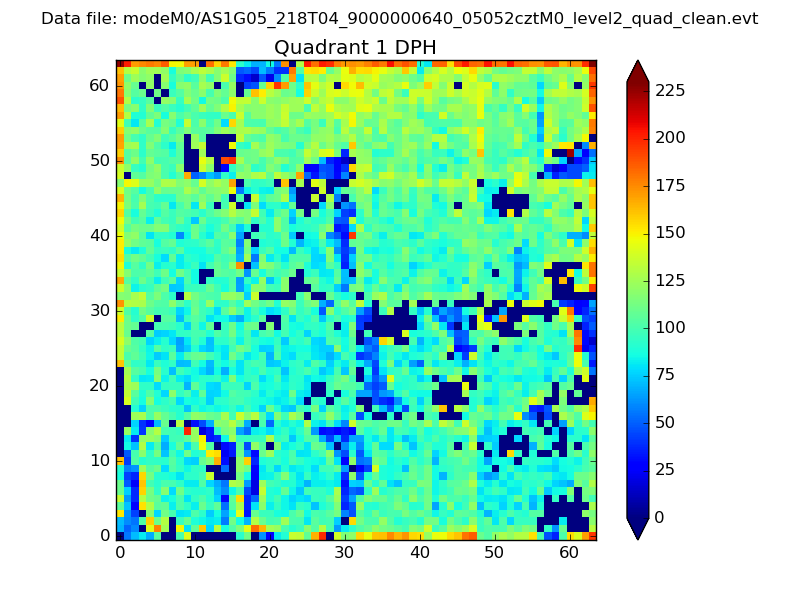 |
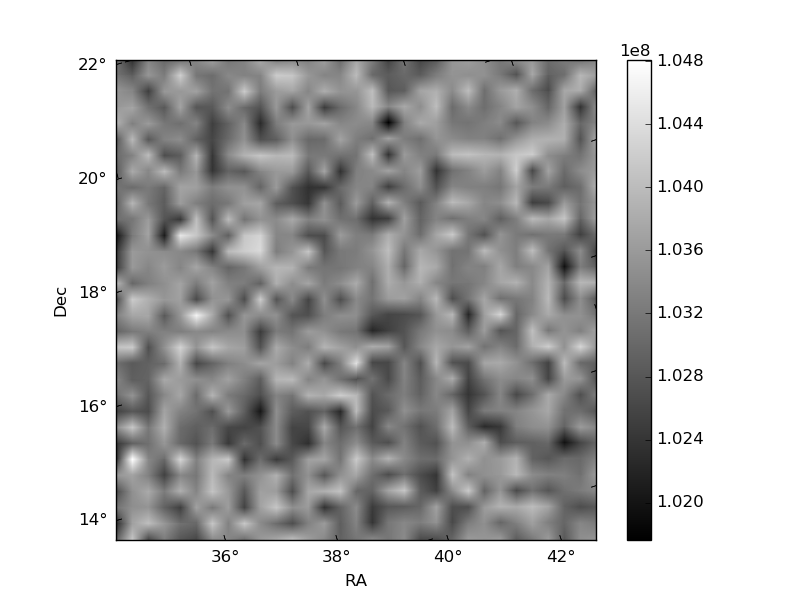
Quadrant B |
|---|---|---|---|
| Quadrant D | 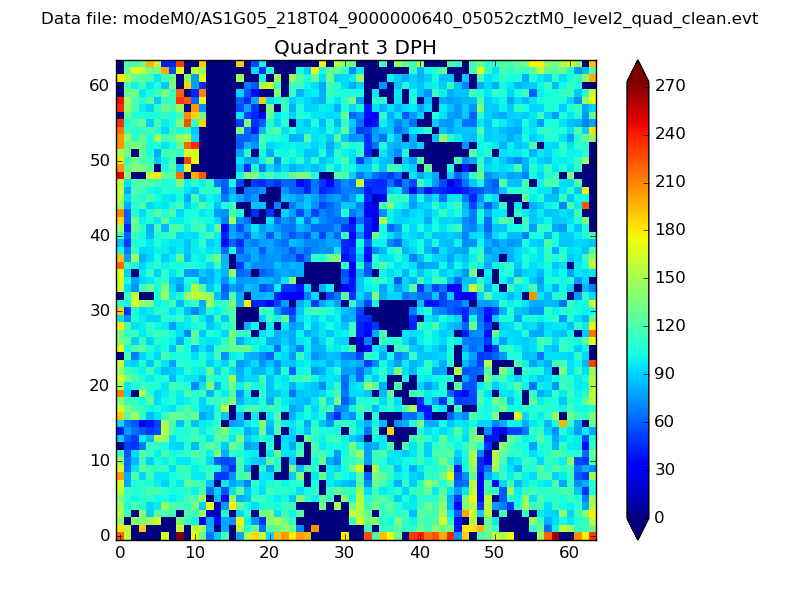 |
 |
Quadrant C |
| Plot type | Count rate plots | Images |
|---|---|---|
| Comparison with Poisson distribution Blue bars denote a histogram of data divided into 1 sec bins. Red curve is a Poisson curve with rate = median count rate of data. |
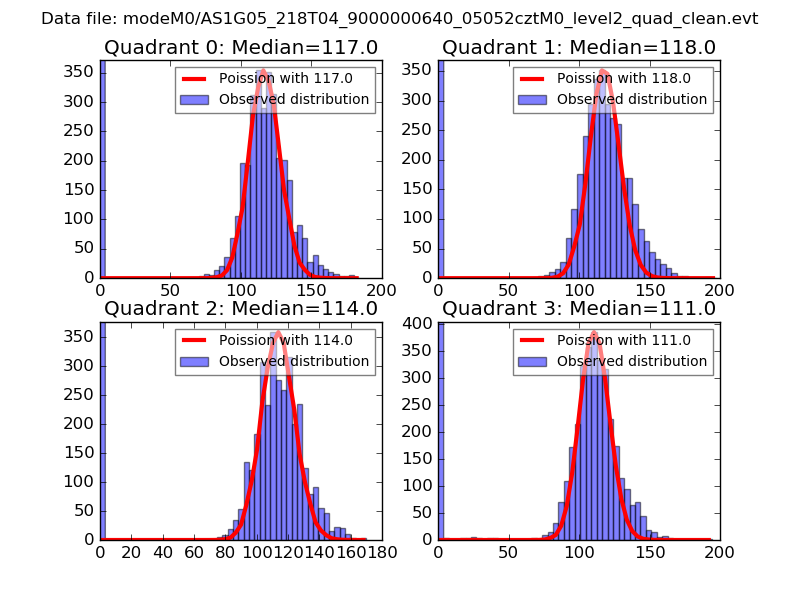 |
 |
| Quadrant-wise count rates Data is divided into 100 sec bins |
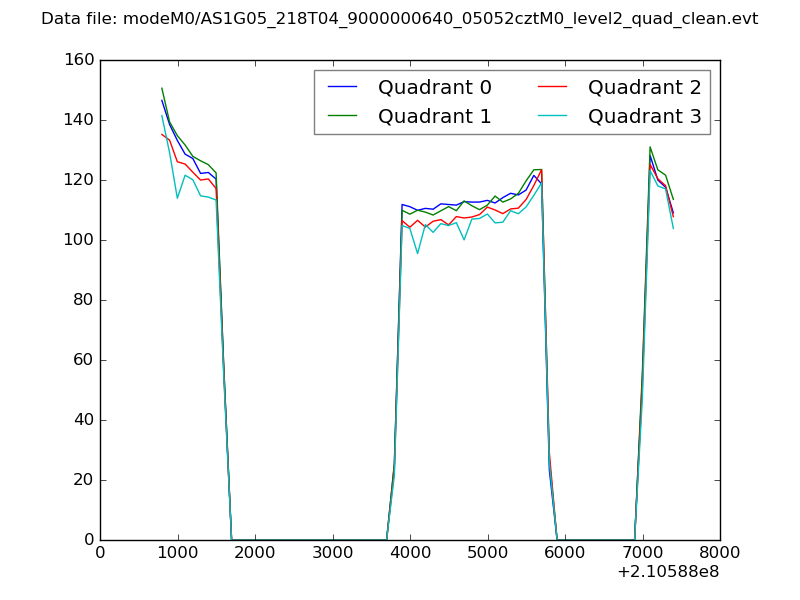 |
|
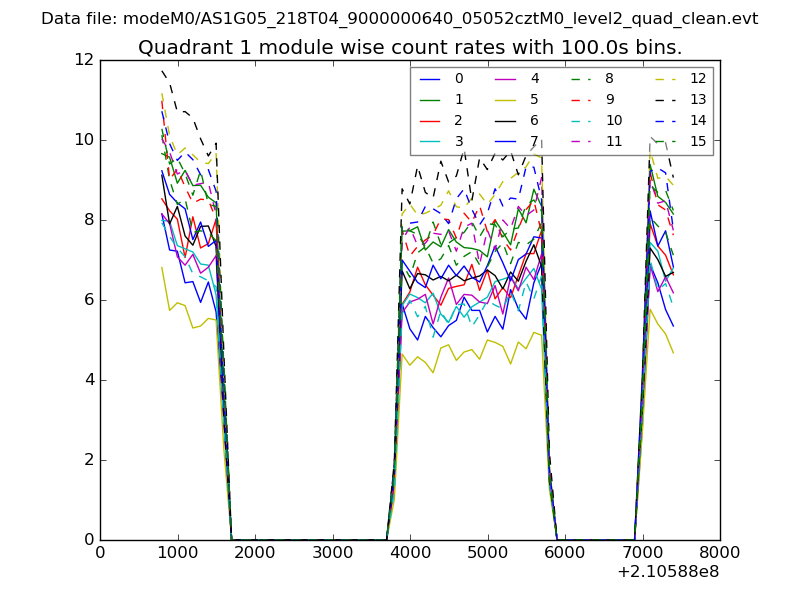
| Module-wise count rates for Quadrant A Data is divided into 100 sec bins |
 |
 |
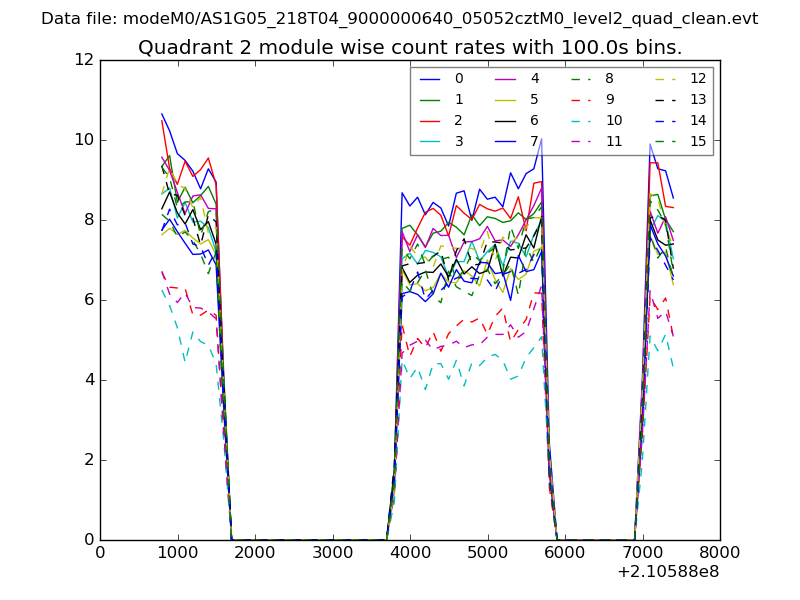
| Module-wise count rates for Quadrant B Data is divided into 100 sec bins |
 |
 |
| Module-wise count rates for Quadrant C Data is divided into 100 sec bins |
 |
 |
| Module-wise count rates for Quadrant D Data is divided into 100 sec bins |
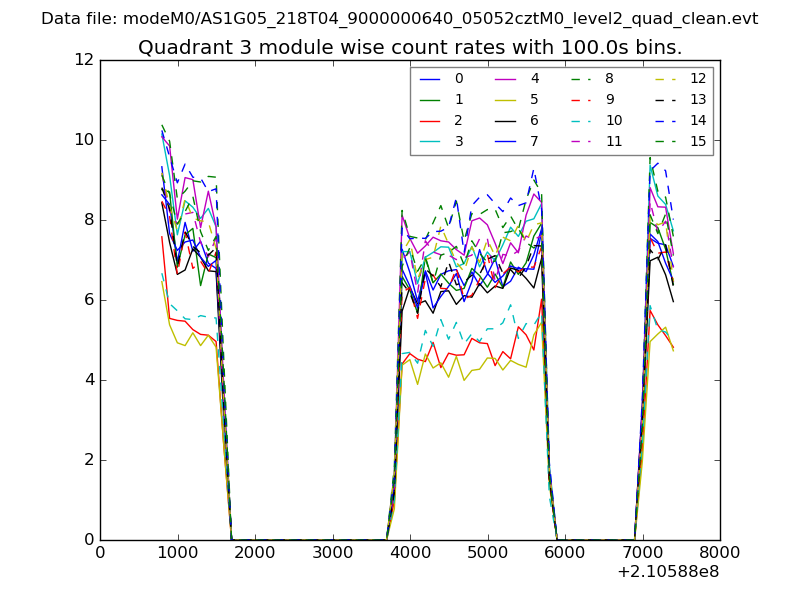 |
 |
| Parameter | Plot |
|---|---|
| CZT HV Monitor | 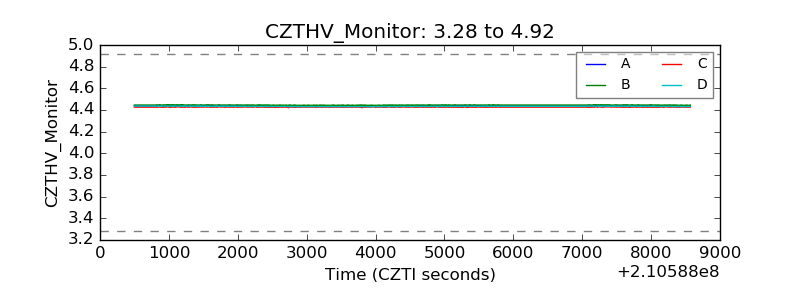 |
| D_VDD | 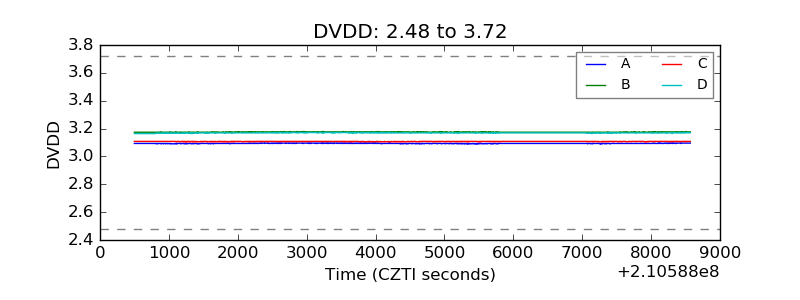 |
| Temperature 1 | 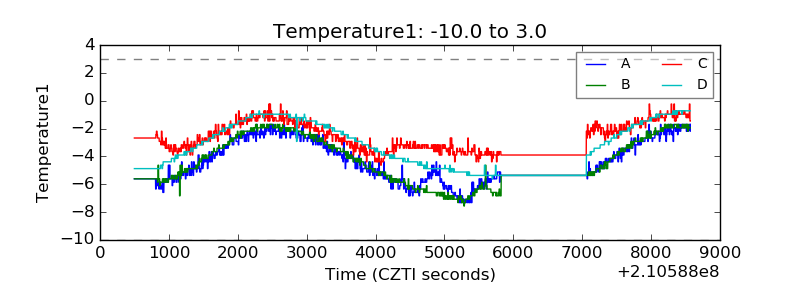 |
| Veto HV Monitor | 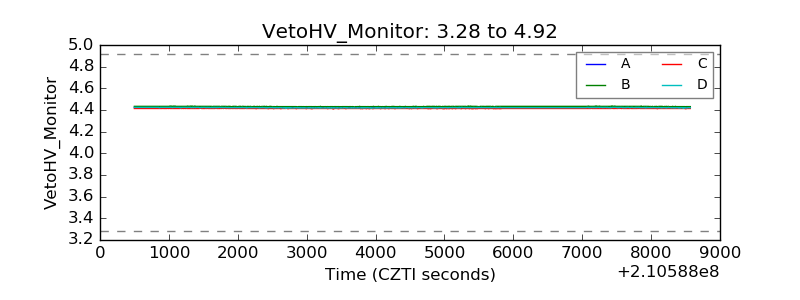 |
| Veto LLD | 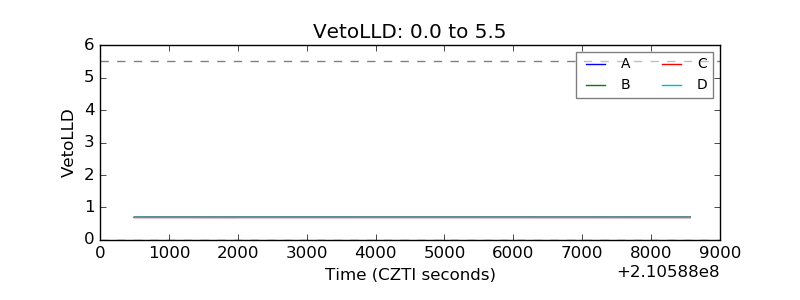 |
| Alpha Counter | 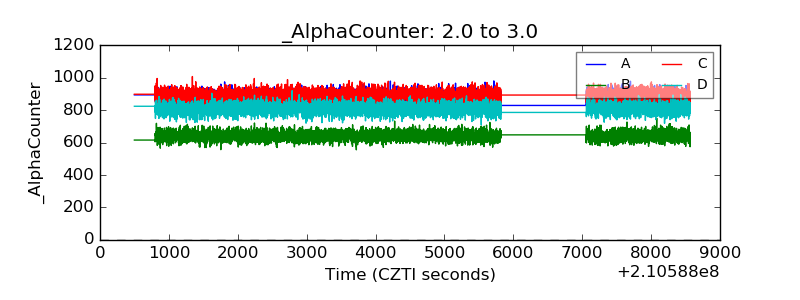 |
| _CPM_Rate | 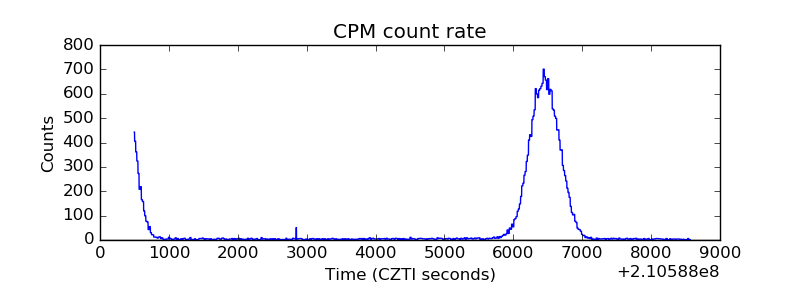 |
| CZT Counter | 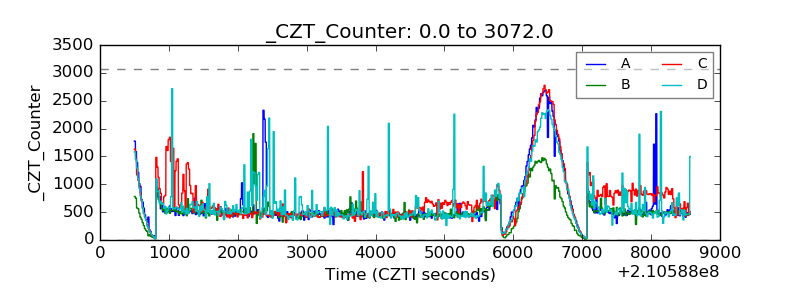 |
| +2.5 Volts monitor |  |
| +5 Volts monitor |  |
| _ROLL_ROT | 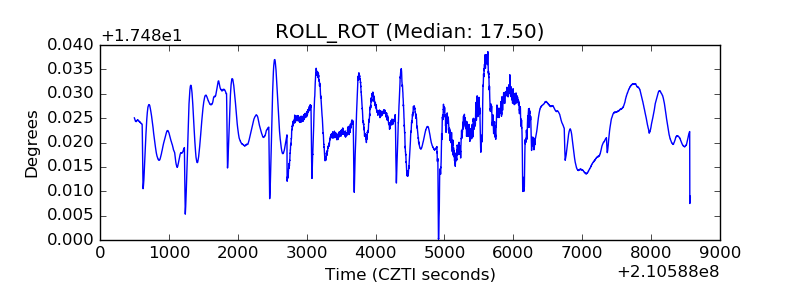 |
| _Roll_DEC | 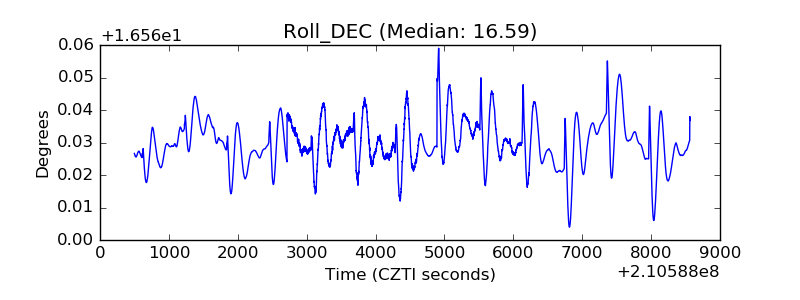 |
| _Roll_RA | 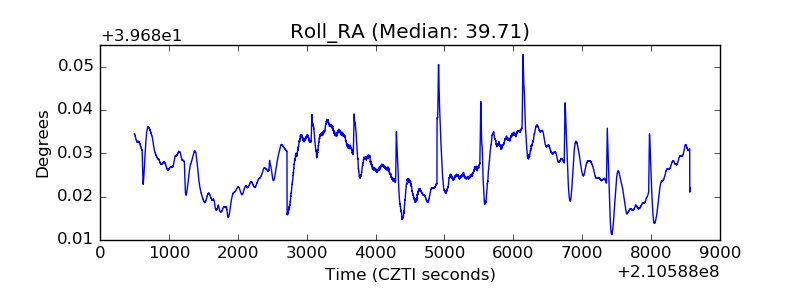 |
| Veto Counter | 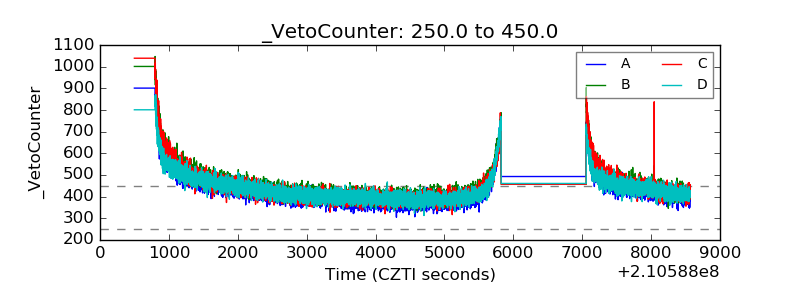 |