| Param | Original file | Final file |
|---|---|---|
| Filename | modeM0/AS1G05_218T04_9000000640_05053cztM0_level2.evt | modeM0/AS1G05_218T04_9000000640_05053cztM0_level2_quad_clean.evt |
| Size (bytes) | 525,533,760 | 59,279,040 |
| Size | 501.2 MB | 56.5 MB |
| Events in quadrant A | 3,649,207 | 337,393 |
| Events in quadrant B | 3,420,825 | 336,982 |
| Events in quadrant C | 4,034,265 | 327,043 |
| Events in quadrant D | 4,350,624 | 319,835 |
| Mode SS | |||
|---|---|---|---|
| Quadrant | BADHDUFLAG | Total packets | Discarded packets |
| A | 0 | 138 | 0 |
| B | 0 | 138 | 0 |
| C | 0 | 138 | 0 |
| D | 0 | 138 | 0 |
| Mode M9 | |||
|---|---|---|---|
| Quadrant | BADHDUFLAG | Total packets | Discarded packets |
| A | 0 | 10 | 0 |
| B | 0 | 10 | 0 |
| C | 0 | 10 | 0 |
| D | 0 | 11 | 0 |
| Mode M0 | |||
|---|---|---|---|
| Quadrant | BADHDUFLAG | Total packets | Discarded packets |
| A | 0 | 15238 | 3 |
| B | 0 | 14348 | 2 |
| C | 0 | 16384 | 2 |
| D | 0 | 17445 | 2 |
| Quadrant | Total seconds | Saturated seconds | Saturation percentage |
|---|---|---|---|
| A | 6790 | 401 | 5.905744% |
| B | 6790 | 148 | 2.179676% |
| C | 6790 | 112 | 1.649485% |
| D | 6790 | 394 | 5.802651% |
Noise dominated data is calculated using 1-second bins in cleaned event files. If a bin has >2000 counts, and if more than 50% of those come from <1% of pixels, then it is considered to be noise-dominated and hence unusable.
| Quadrant | # 1 sec bins | Bins with >0 counts | Bins with >2000 counts | High rate bins dominated by noise | Noise dominated (total time) | Noise dominated (detector-on time) | Marked lightcurve |
|---|---|---|---|---|---|---|---|
| A | 7815 | 6791 | 23 | 23 | 0.29% | 0.34% | 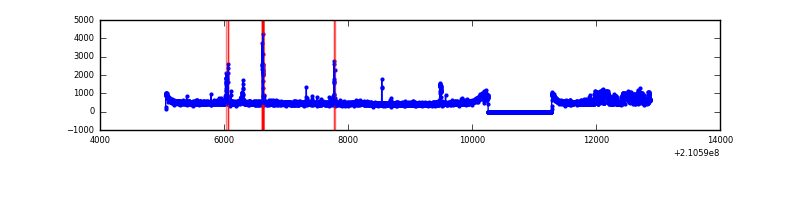 |
| B | 7815 | 6791 | 3 | 3 | 0.04% | 0.04% | 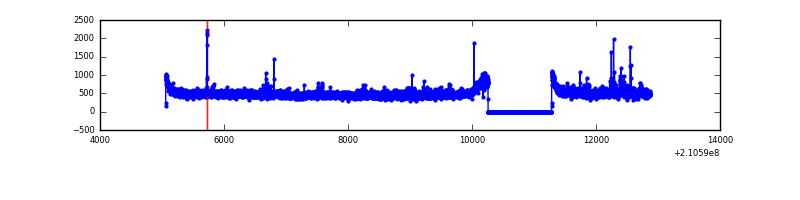 |
| C | 7815 | 6791 | 4 | 4 | 0.05% | 0.06% | 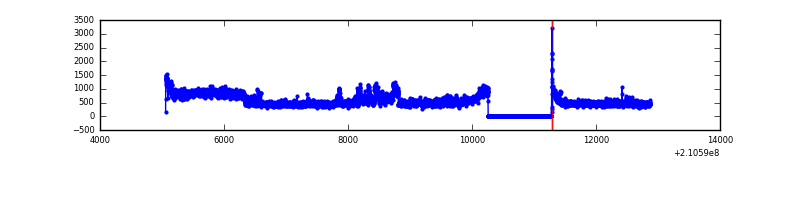 |
| D | 7815 | 6791 | 216 | 216 | 2.76% | 3.18% | 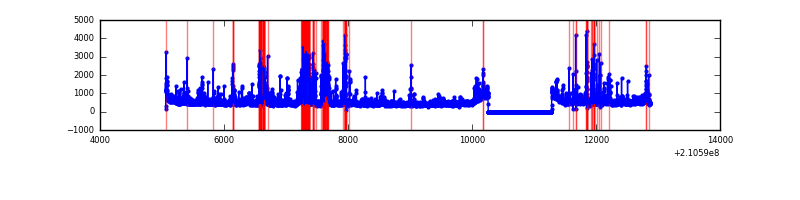 |
Top three noisy pixels from each quadrant. If the there are fewer than three noisy pixels in the level2.evt file, extra rows are filled as -1
| Pixel properties | Quadrant properties | ||||||
|---|---|---|---|---|---|---|---|
| Quadrant | DetID | PixID | Counts | Sigma | Mean | Median | Sigma |
| A | 14 | 111 | 279322 | 1645.64 | 830 | 811 | 169.2 |
| A | 15 | 174 | 106874 | 626.7 | 830 | 811 | 169.2 |
| A | 0 | 50 | 40583 | 235.0 | 830 | 811 | 169.2 |
| B | 4 | 48 | 46118 | 280.03 | 838 | 819 | 161.8 |
| B | 0 | 219 | 45889 | 278.62 | 838 | 819 | 161.8 |
| B | 15 | 204 | 41275 | 250.09 | 838 | 819 | 161.8 |
| C | 1 | 16 | 859906 | 4589.43 | 803 | 808 | 187.2 |
| C | 14 | 67 | 24762 | 127.97 | 803 | 808 | 187.2 |
| C | 5 | 207 | 14411 | 72.67 | 803 | 808 | 187.2 |
| D | 13 | 235 | 384750 | 1923.9 | 803 | 779 | 199.6 |
| D | 2 | 33 | 297452 | 1486.49 | 803 | 779 | 199.6 |
| D | 2 | 136 | 162476 | 810.19 | 803 | 779 | 199.6 |
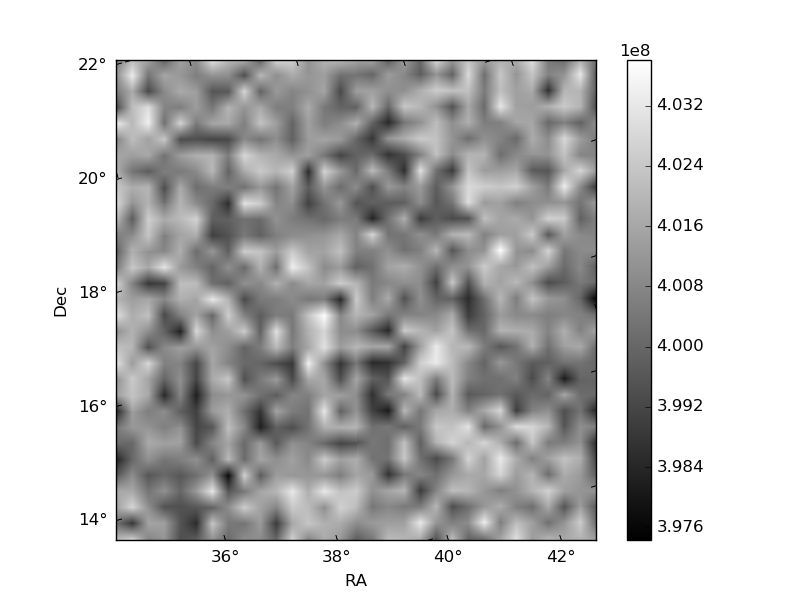
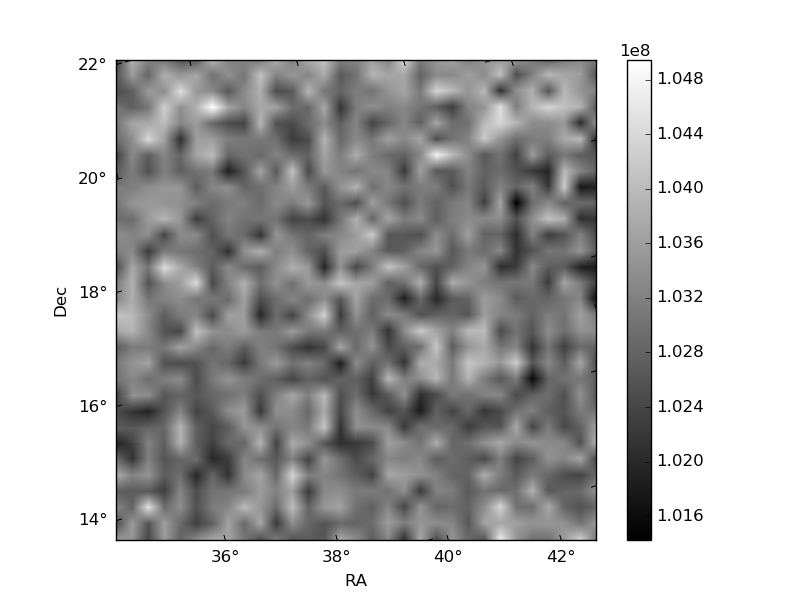
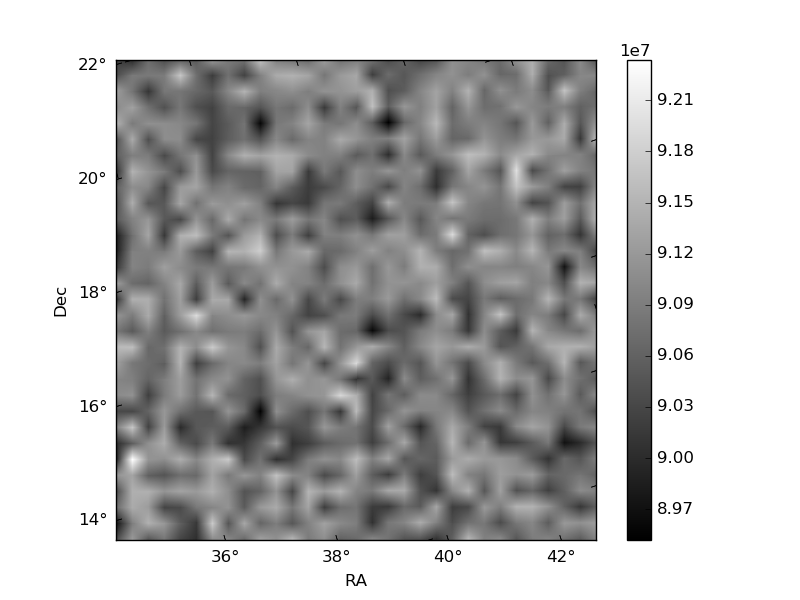
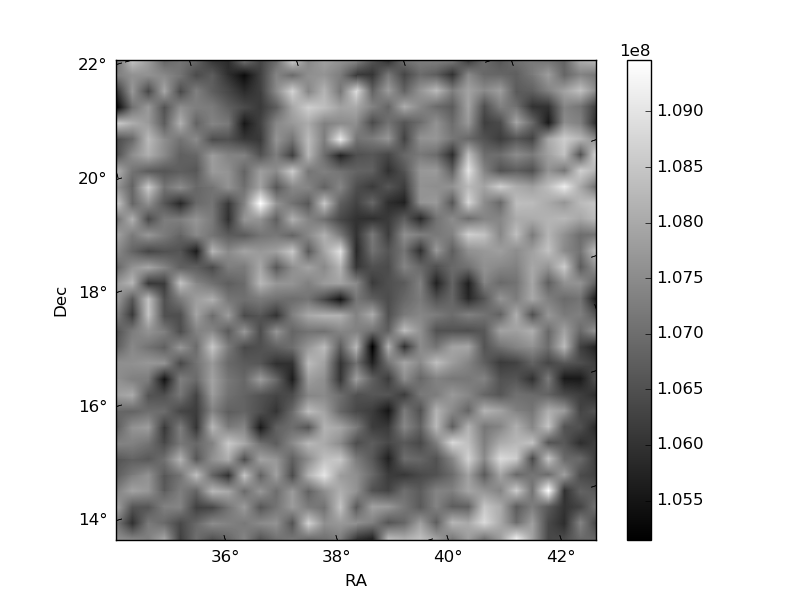
Histogram calculated using DETX and DETY for each event in the final _common_clean file
| Quadrant A | 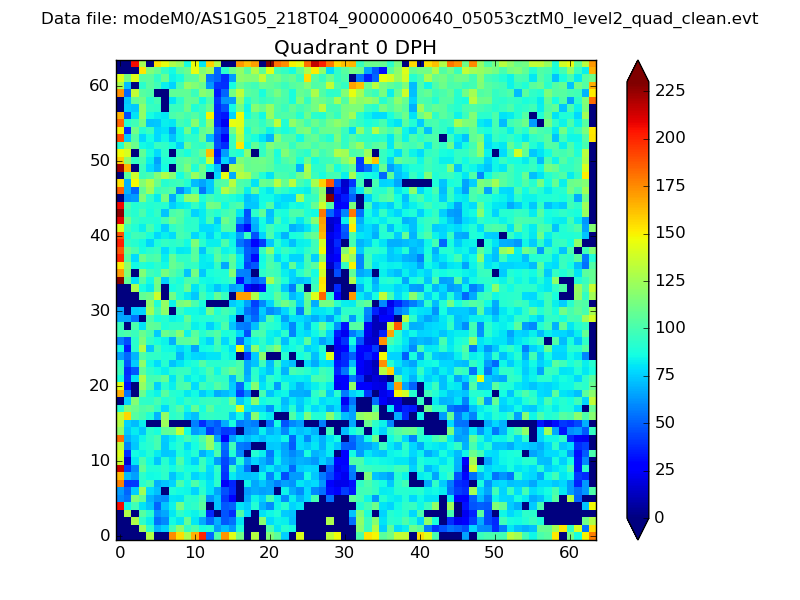 |
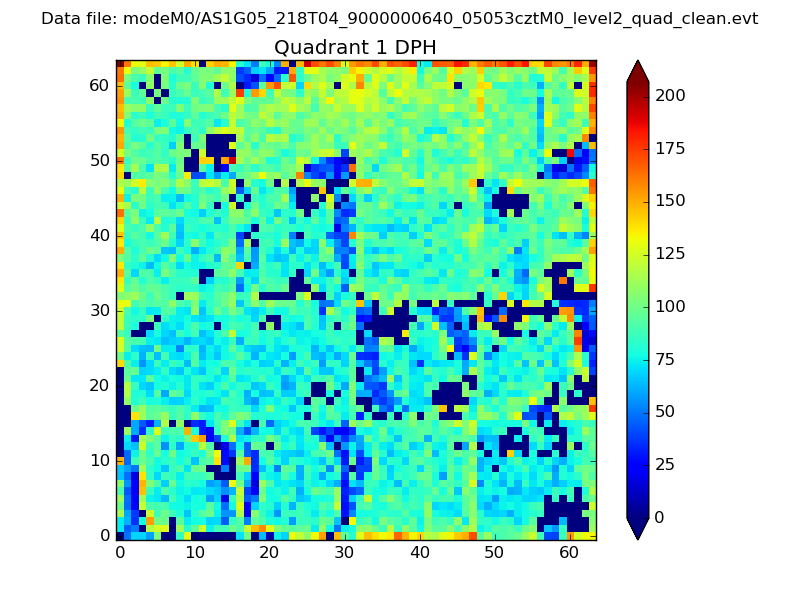 |
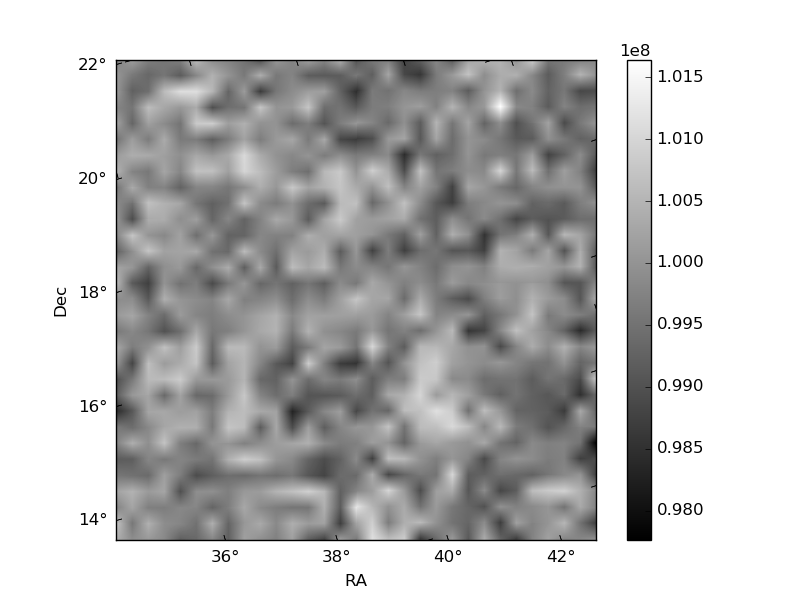
Quadrant B |
|---|---|---|---|
| Quadrant D | 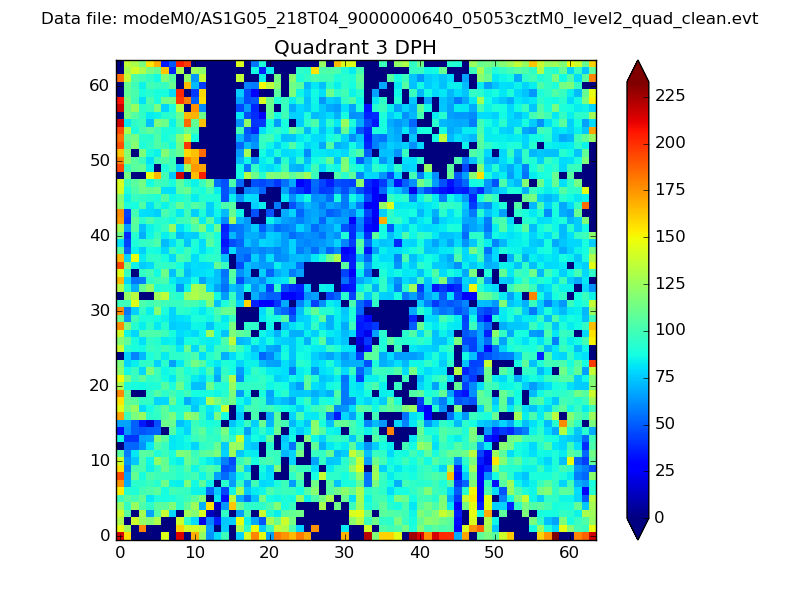 |
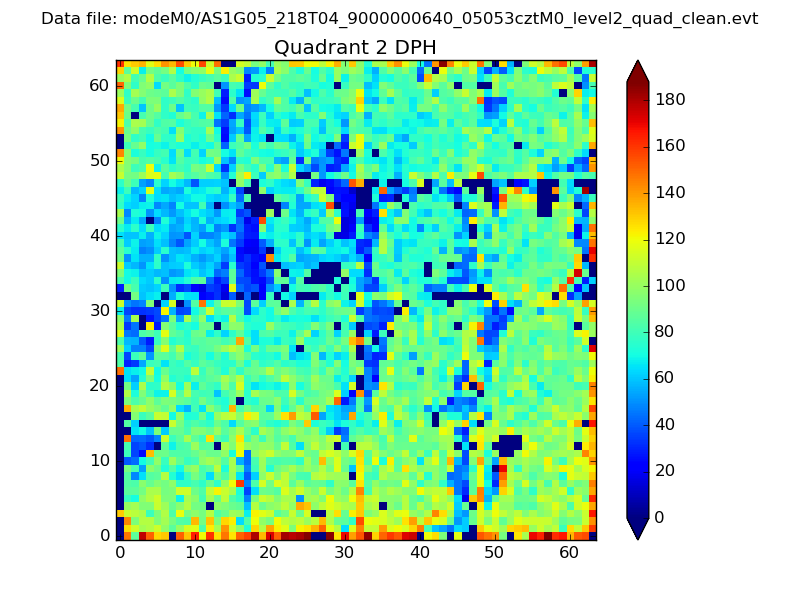 |
Quadrant C |
| Plot type | Count rate plots | Images |
|---|---|---|
| Comparison with Poisson distribution Blue bars denote a histogram of data divided into 1 sec bins. Red curve is a Poisson curve with rate = median count rate of data. |
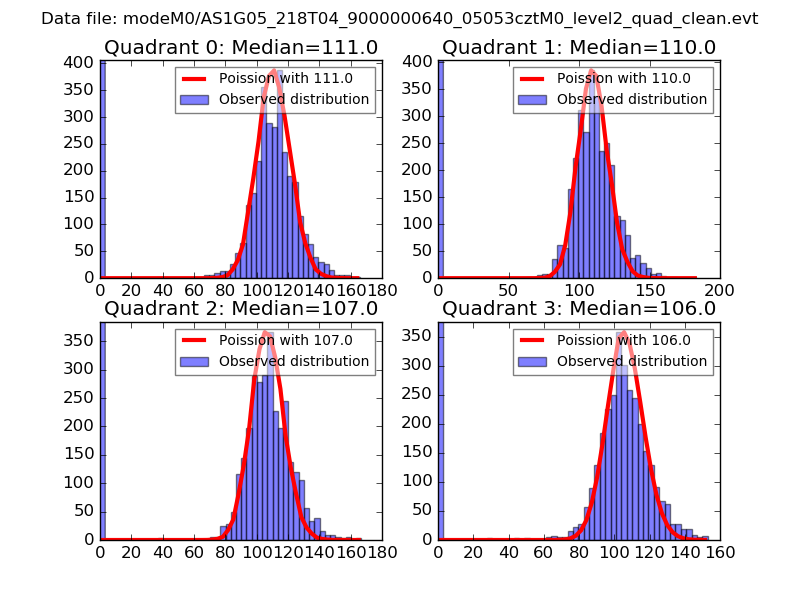 |
 |
| Quadrant-wise count rates Data is divided into 100 sec bins |
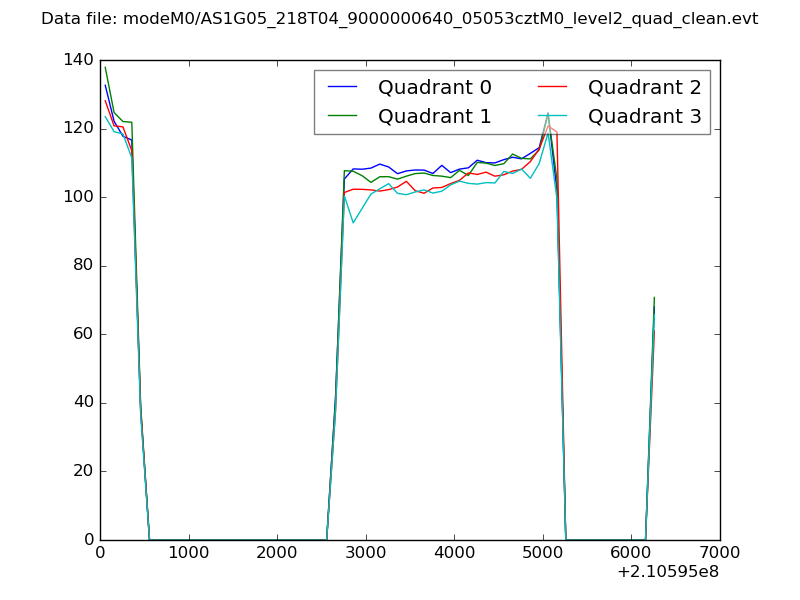 |
|
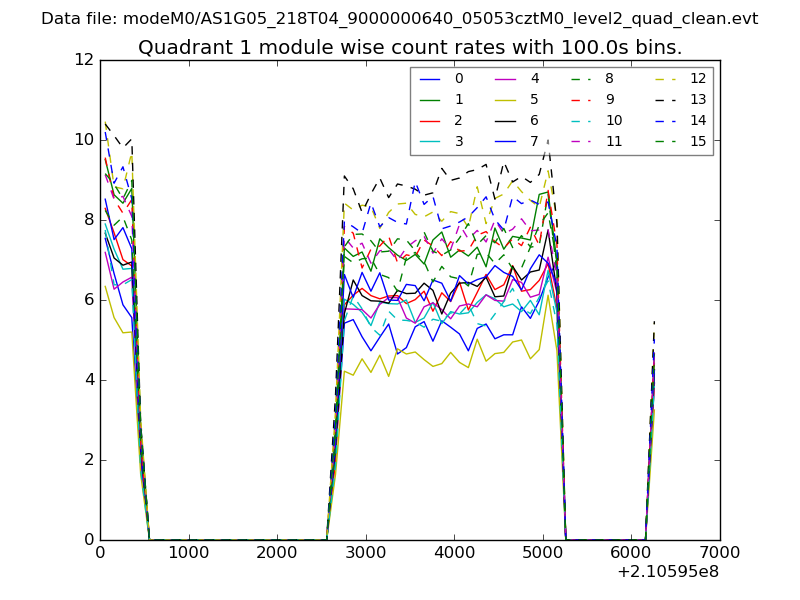
| Module-wise count rates for Quadrant A Data is divided into 100 sec bins |
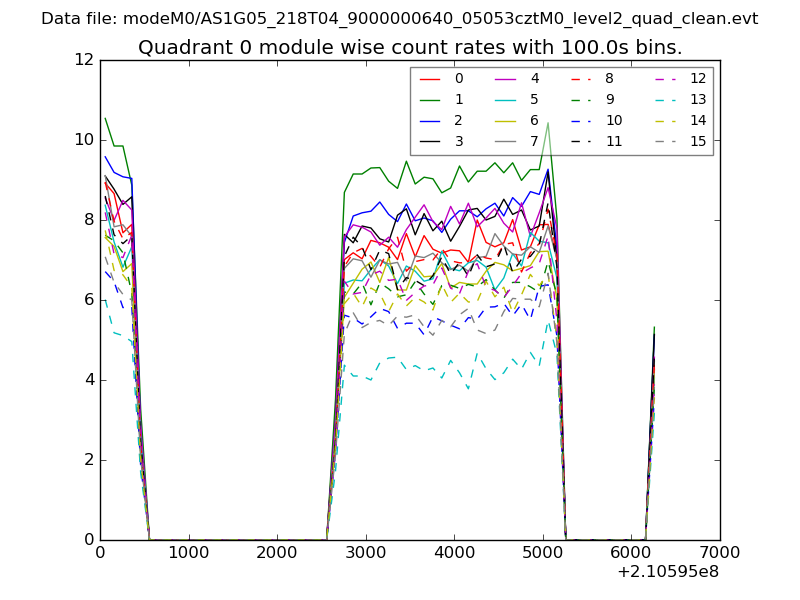 |
 |
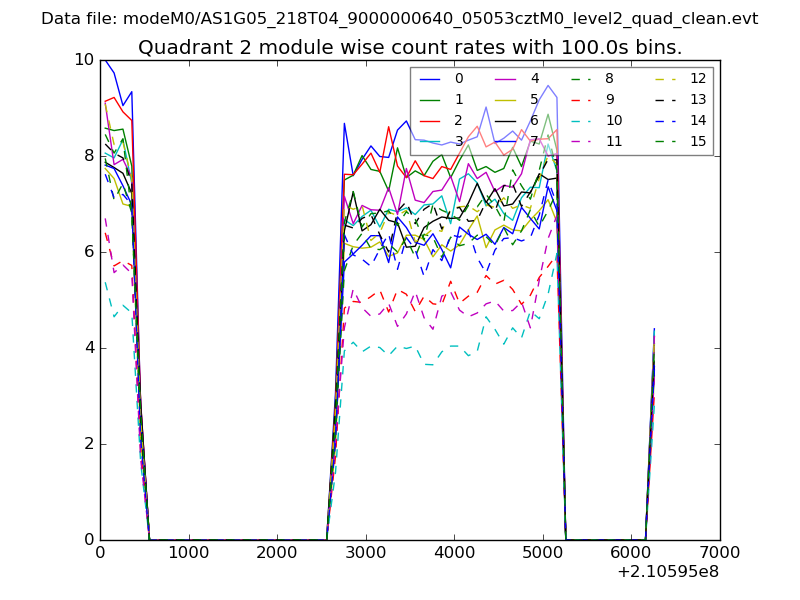
| Module-wise count rates for Quadrant B Data is divided into 100 sec bins |
 |
 |
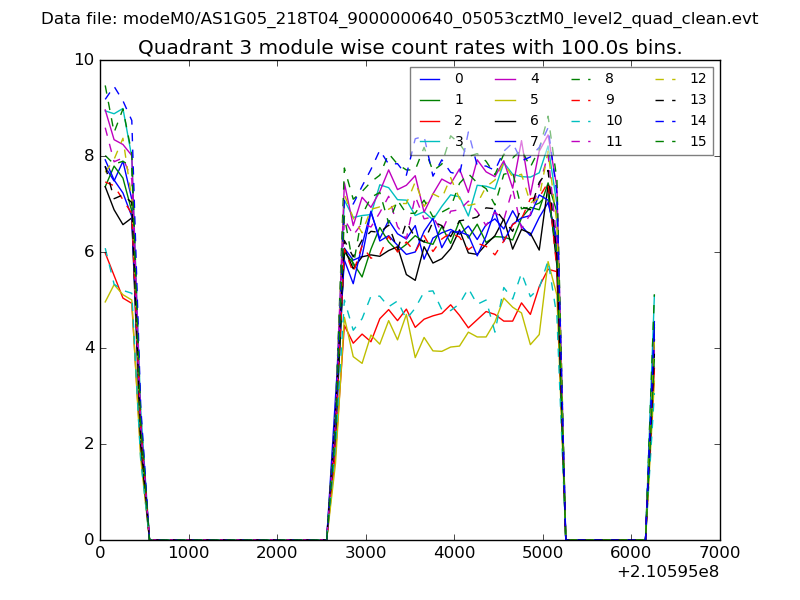
| Module-wise count rates for Quadrant C Data is divided into 100 sec bins |
 |
 |
| Module-wise count rates for Quadrant D Data is divided into 100 sec bins |
 |
 |
| Parameter | Plot |
|---|---|
| CZT HV Monitor | 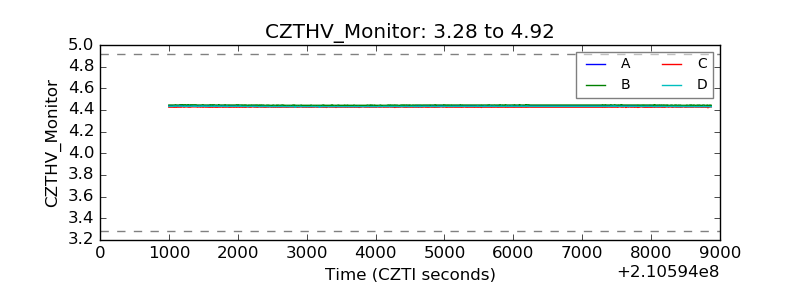 |
| D_VDD | 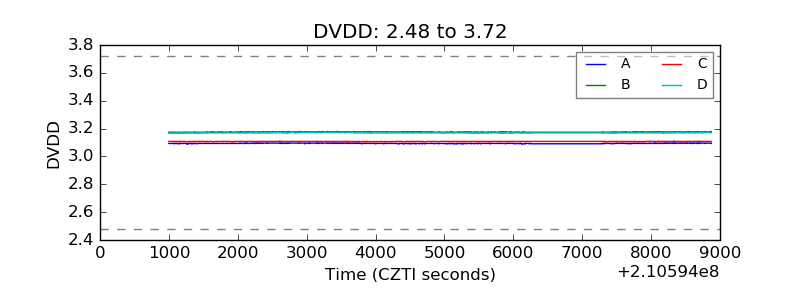 |
| Temperature 1 | 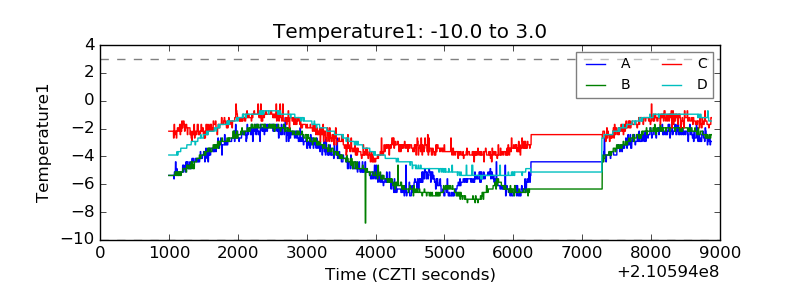 |
| Veto HV Monitor | 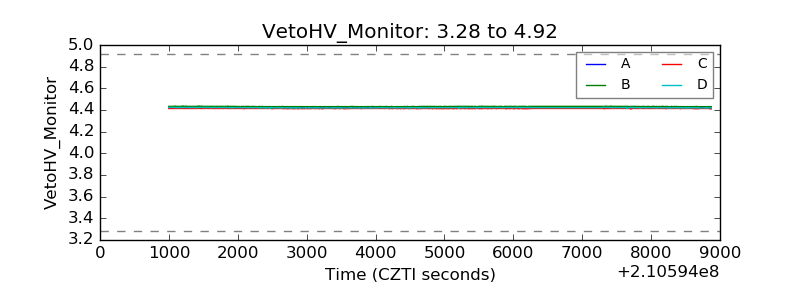 |
| Veto LLD | 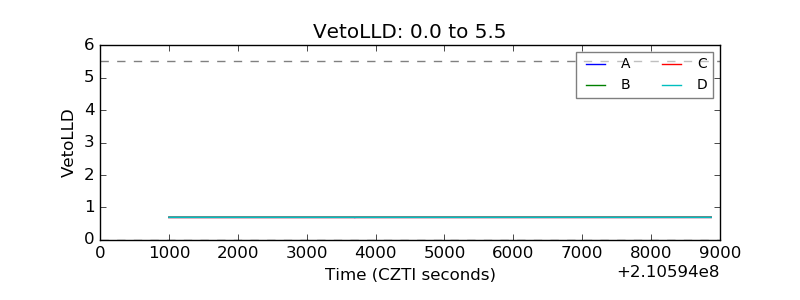 |
| Alpha Counter | 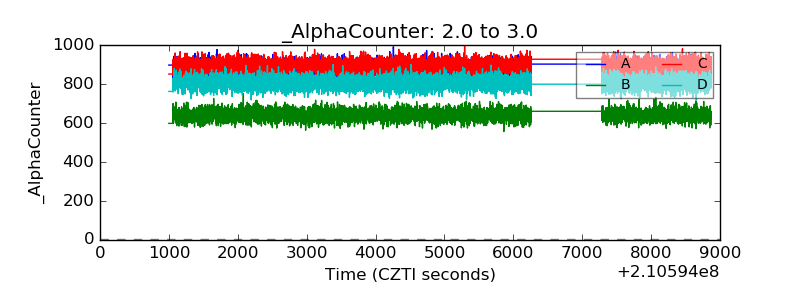 |
| _CPM_Rate | 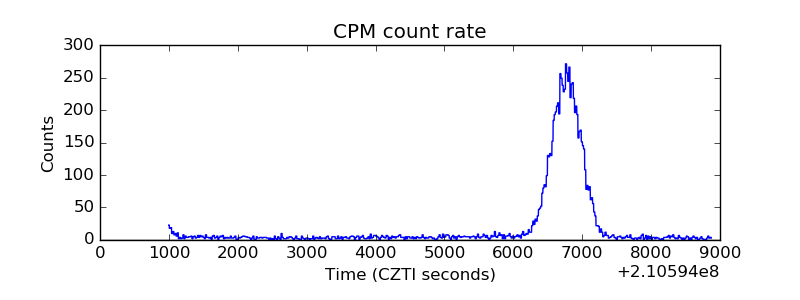 |
| CZT Counter | 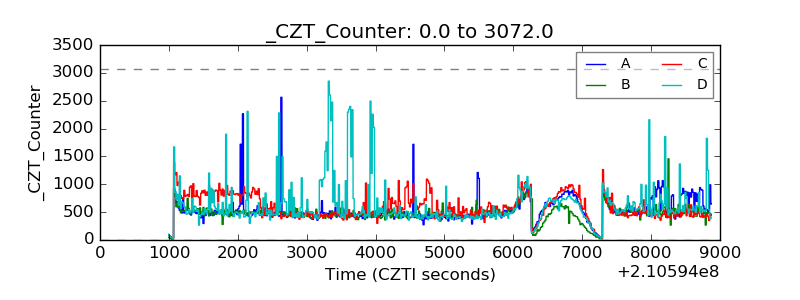 |
| +2.5 Volts monitor | 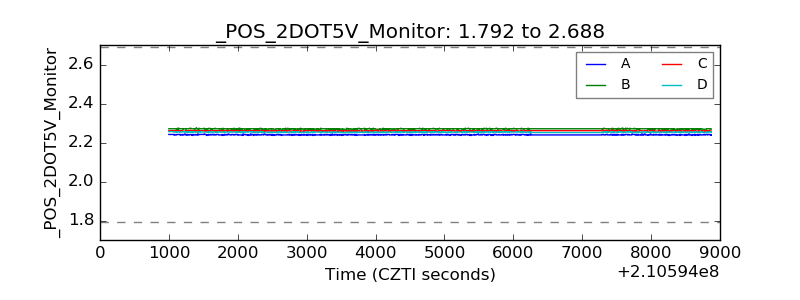 |
| +5 Volts monitor |  |
| _ROLL_ROT | 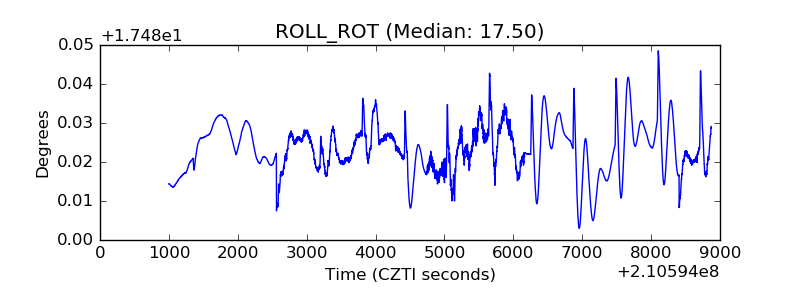 |
| _Roll_DEC | 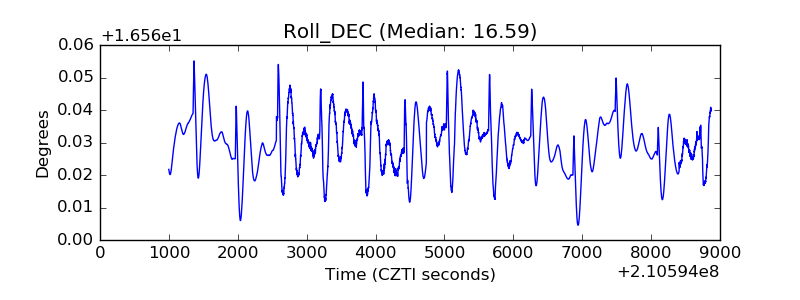 |
| _Roll_RA | 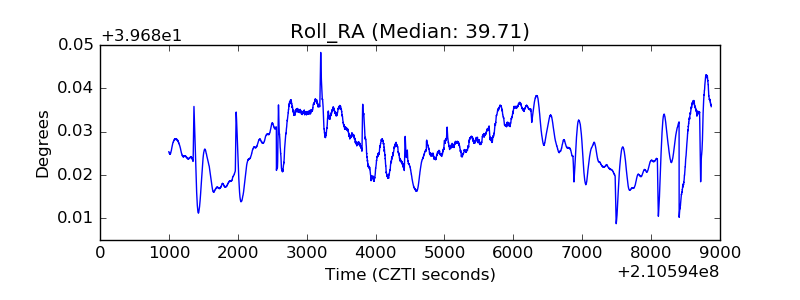 |
| Veto Counter | 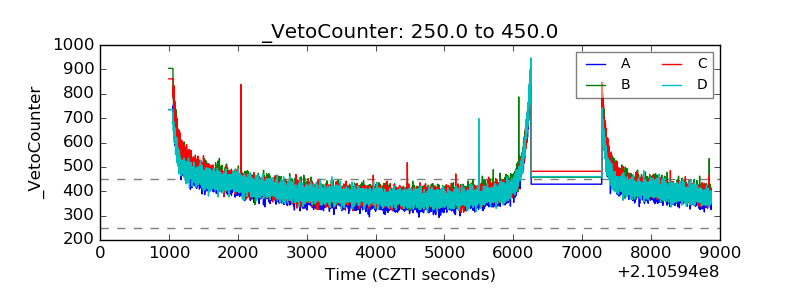 |