| Param | Original file | Final file |
|---|---|---|
| Filename | modeM0/AS1G05_218T04_9000000640_05055cztM0_level2.evt | modeM0/AS1G05_218T04_9000000640_05055cztM0_level2_quad_clean.evt |
| Size (bytes) | 645,151,680 | 65,603,520 |
| Size | 615.3 MB | 62.6 MB |
| Events in quadrant A | 3,832,728 | 380,935 |
| Events in quadrant B | 3,764,882 | 379,265 |
| Events in quadrant C | 4,414,693 | 371,700 |
| Events in quadrant D | 7,014,228 | 328,273 |
| Mode SS | |||
|---|---|---|---|
| Quadrant | BADHDUFLAG | Total packets | Discarded packets |
| A | 0 | 154 | 0 |
| B | 0 | 154 | 0 |
| C | 0 | 154 | 0 |
| D | 0 | 154 | 0 |
| Mode M9 | |||
|---|---|---|---|
| Quadrant | BADHDUFLAG | Total packets | Discarded packets |
| A | 0 | 11 | 0 |
| B | 0 | 11 | 0 |
| C | 0 | 11 | 0 |
| D | 0 | 11 | 0 |
| Mode M0 | |||
|---|---|---|---|
| Quadrant | BADHDUFLAG | Total packets | Discarded packets |
| A | 0 | 16463 | 3 |
| B | 0 | 16209 | 2 |
| C | 0 | 18124 | 2 |
| D | 0 | 26036 | 2 |
| Quadrant | Total seconds | Saturated seconds | Saturation percentage |
|---|---|---|---|
| A | 7559 | 239 | 3.161794% |
| B | 7559 | 183 | 2.420955% |
| C | 7559 | 158 | 2.090224% |
| D | 7559 | 1179 | 15.597301% |
Noise dominated data is calculated using 1-second bins in cleaned event files. If a bin has >2000 counts, and if more than 50% of those come from <1% of pixels, then it is considered to be noise-dominated and hence unusable.
| Quadrant | # 1 sec bins | Bins with >0 counts | Bins with >2000 counts | High rate bins dominated by noise | Noise dominated (total time) | Noise dominated (detector-on time) | Marked lightcurve |
|---|---|---|---|---|---|---|---|
| A | 8584 | 7561 | 67 | 67 | 0.78% | 0.89% | 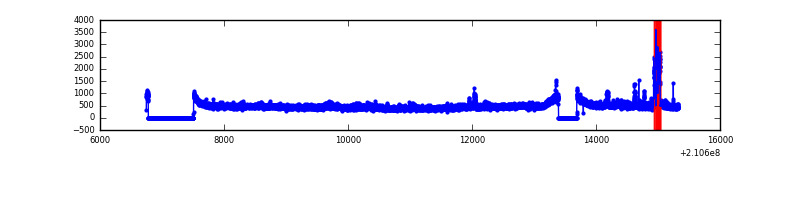 |
| B | 8584 | 7561 | 9 | 9 | 0.10% | 0.12% | 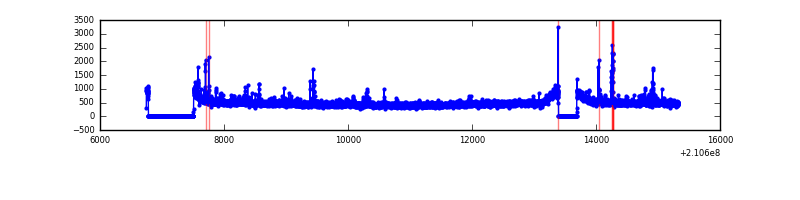 |
| C | 8584 | 7561 | 1 | 1 | 0.01% | 0.01% |  |
| D | 8584 | 7561 | 862 | 862 | 10.04% | 11.40% |  |
Top three noisy pixels from each quadrant. If the there are fewer than three noisy pixels in the level2.evt file, extra rows are filled as -1
| Pixel properties | Quadrant properties | ||||||
|---|---|---|---|---|---|---|---|
| Quadrant | DetID | PixID | Counts | Sigma | Mean | Median | Sigma |
| A | 15 | 174 | 210308 | 1135.14 | 901 | 882 | 184.5 |
| A | 13 | 251 | 129755 | 698.52 | 901 | 882 | 184.5 |
| A | 15 | 234 | 19832 | 102.71 | 901 | 882 | 184.5 |
| B | 0 | 219 | 80163 | 448.76 | 909 | 888 | 176.7 |
| B | 15 | 54 | 71626 | 400.43 | 909 | 888 | 176.7 |
| B | 15 | 204 | 40527 | 224.39 | 909 | 888 | 176.7 |
| C | 1 | 16 | 979355 | 4810.81 | 872 | 876 | 203.4 |
| C | 14 | 67 | 22742 | 107.51 | 872 | 876 | 203.4 |
| C | 13 | 61 | 7157 | 30.88 | 872 | 876 | 203.4 |
| D | 13 | 235 | 3508703 | 16933.82 | 836 | 810 | 207.2 |
| D | 7 | 237 | 193024 | 927.88 | 836 | 810 | 207.2 |
| D | 2 | 14 | 32860 | 154.72 | 836 | 810 | 207.2 |
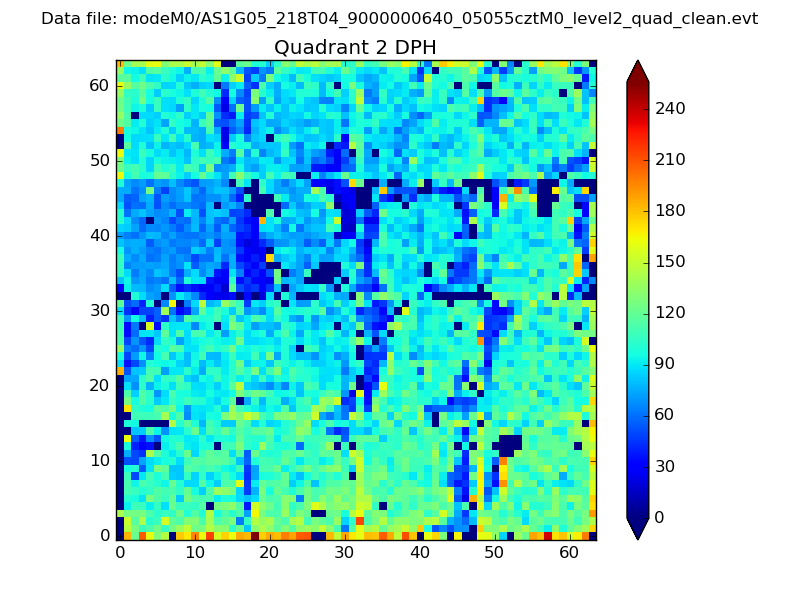
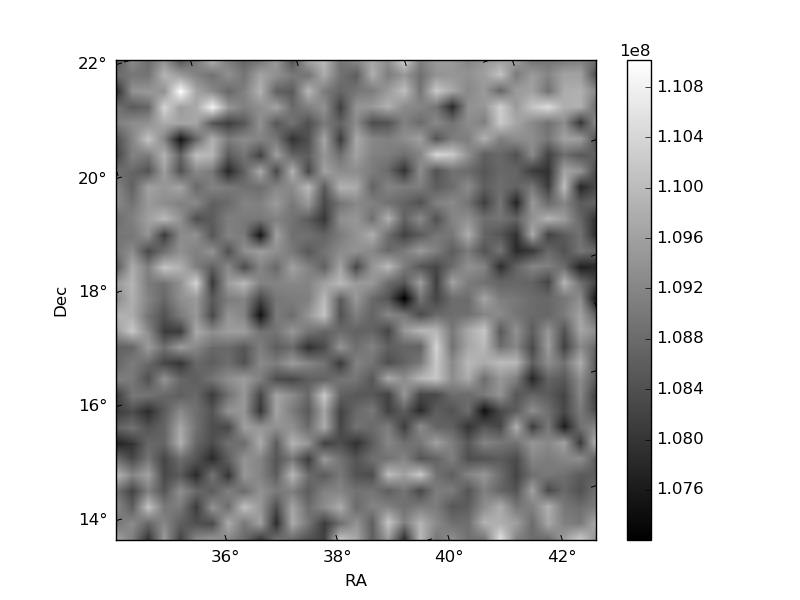
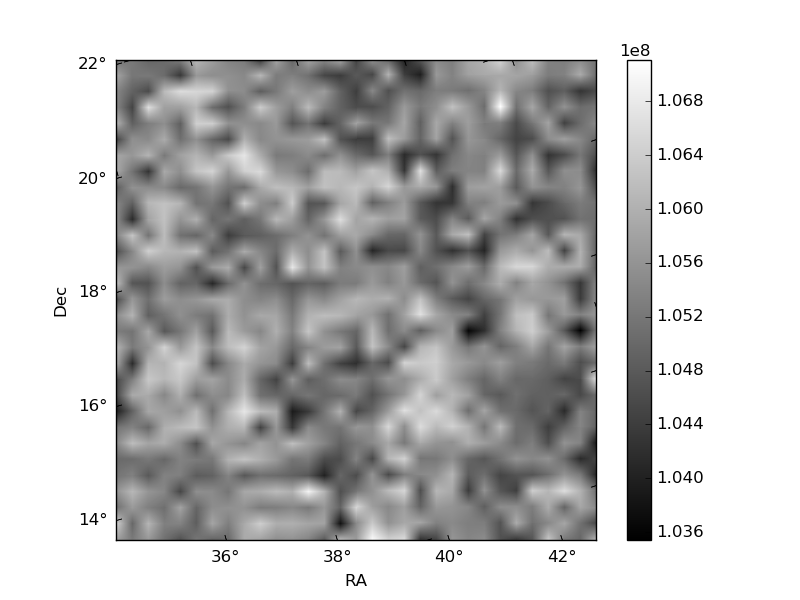
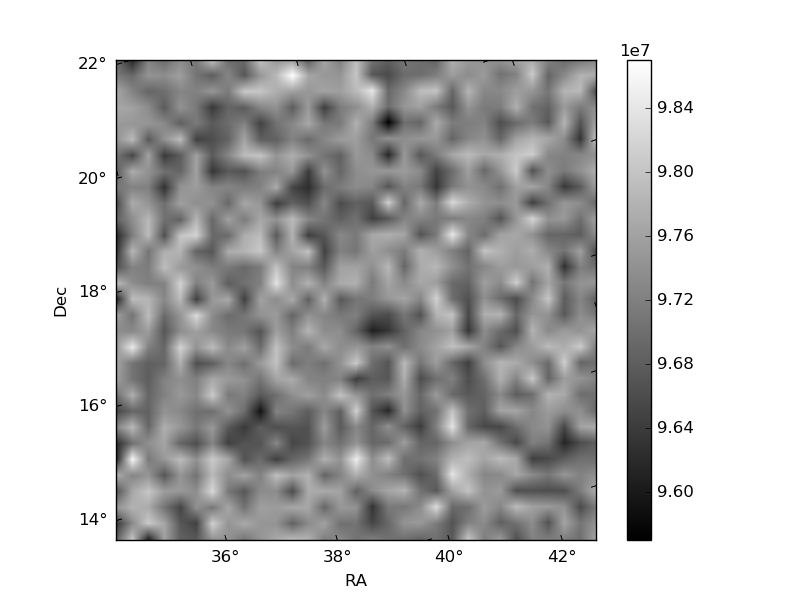
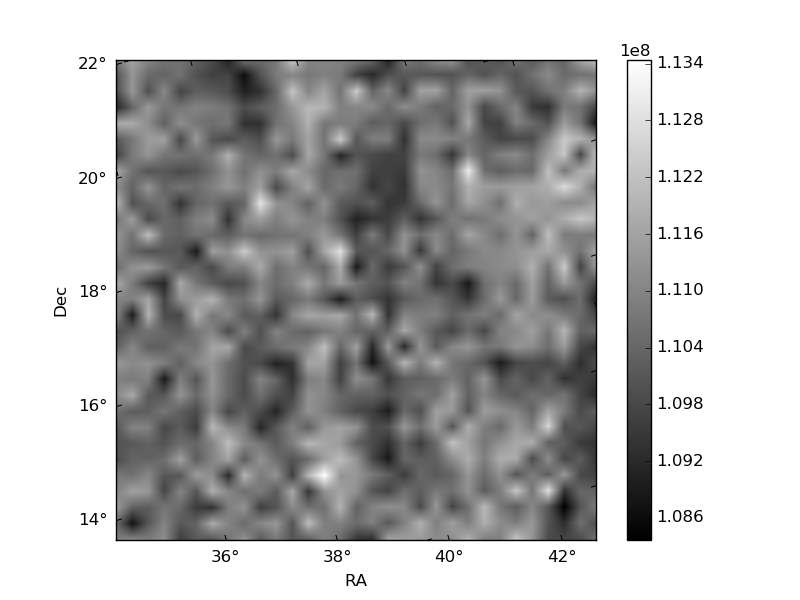
Histogram calculated using DETX and DETY for each event in the final _common_clean file
| Quadrant A | 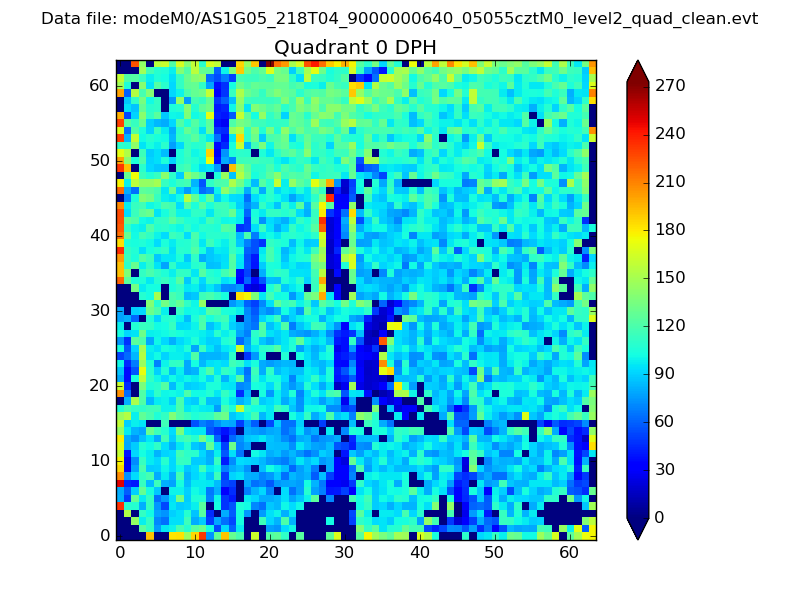 |
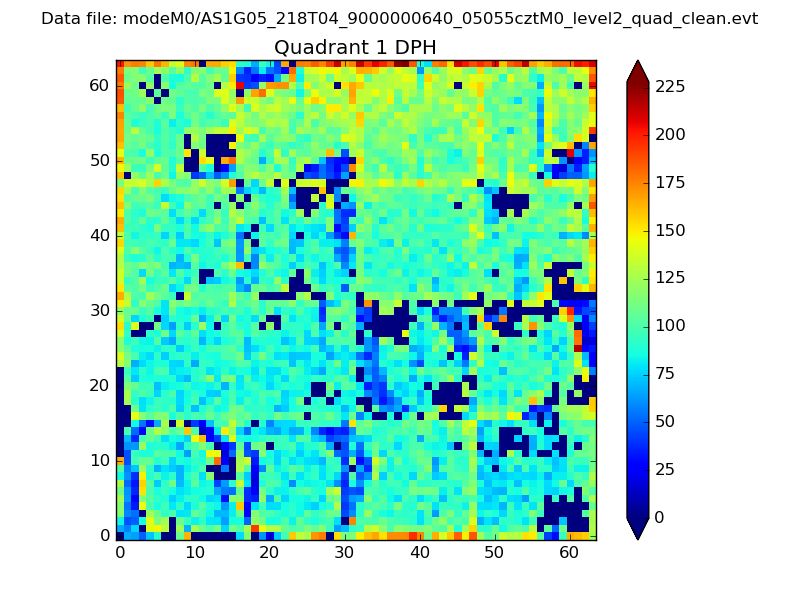 |
Quadrant B |
|---|---|---|---|
| Quadrant D | 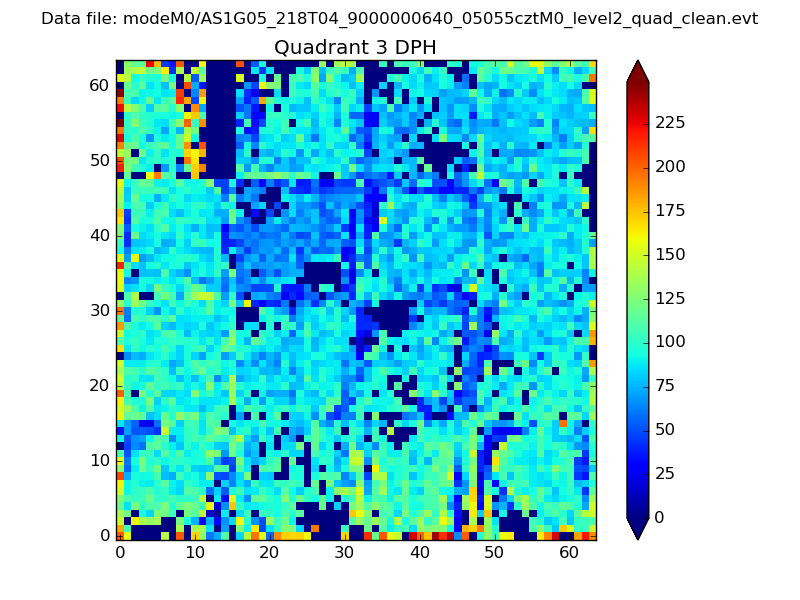 |
 |
Quadrant C |
| Plot type | Count rate plots | Images |
|---|---|---|
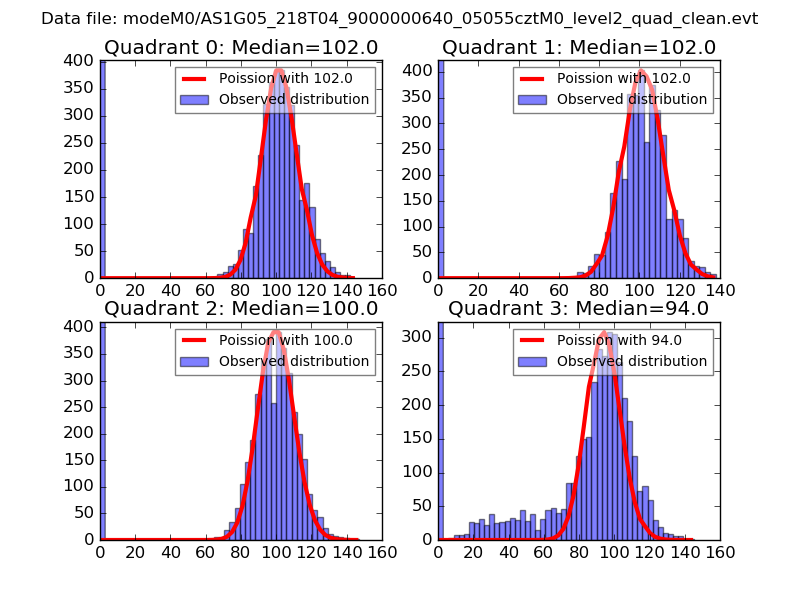
| Comparison with Poisson distribution Blue bars denote a histogram of data divided into 1 sec bins. Red curve is a Poisson curve with rate = median count rate of data. |
 |
 |
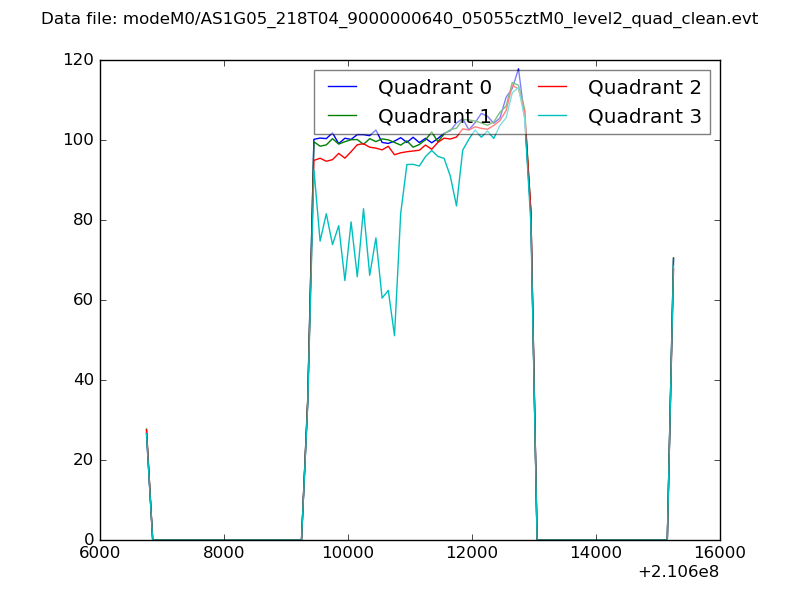
| Quadrant-wise count rates Data is divided into 100 sec bins |
 |
|
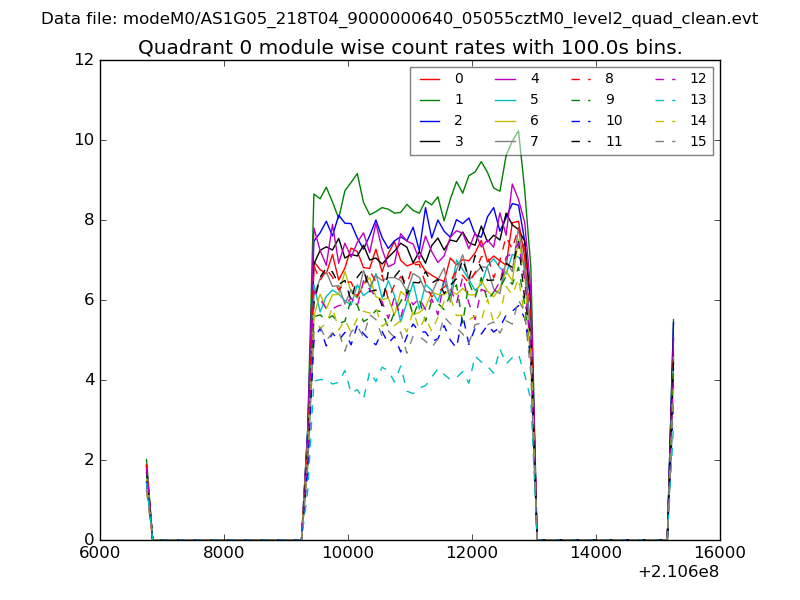
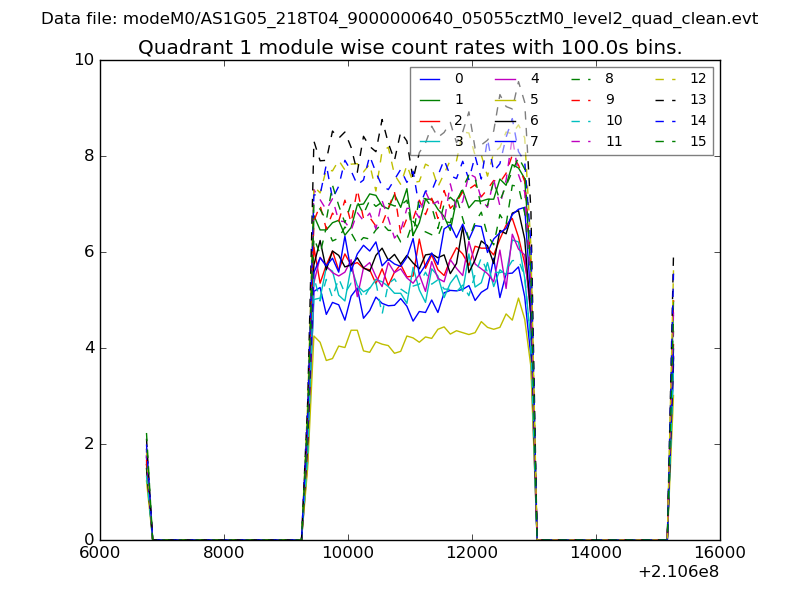
| Module-wise count rates for Quadrant A Data is divided into 100 sec bins |
 |
 |
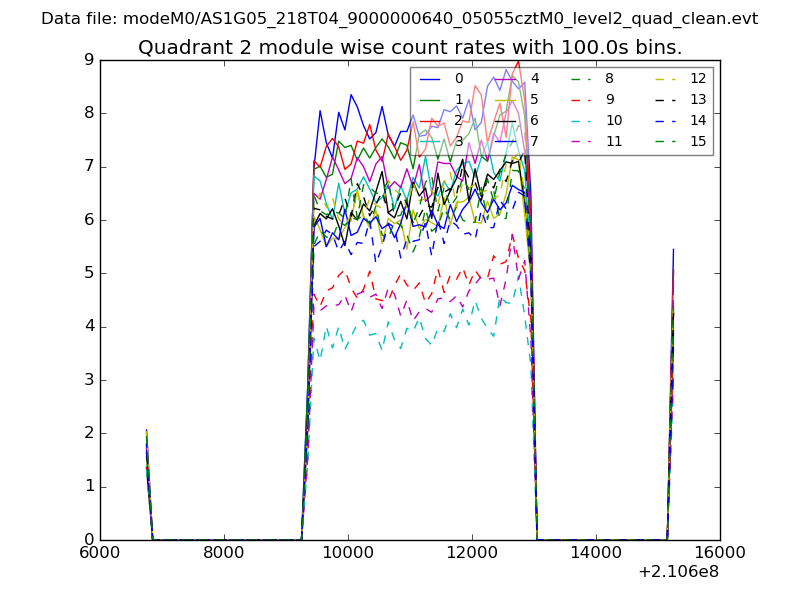
| Module-wise count rates for Quadrant B Data is divided into 100 sec bins |
 |
 |
| Module-wise count rates for Quadrant C Data is divided into 100 sec bins |
 |
 |
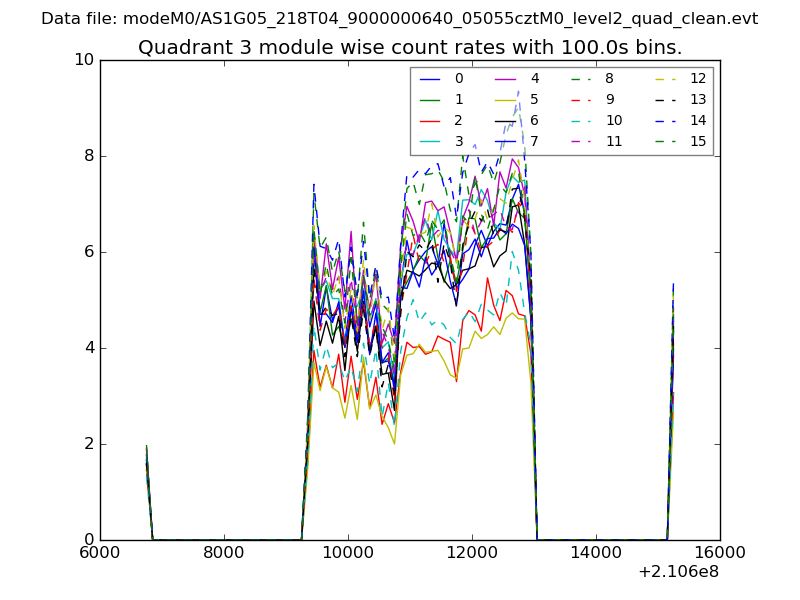
| Module-wise count rates for Quadrant D Data is divided into 100 sec bins |
 |
 |
| Parameter | Plot |
|---|---|
| CZT HV Monitor | 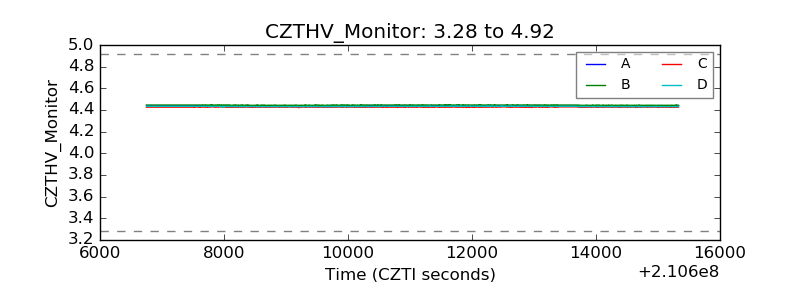 |
| D_VDD | 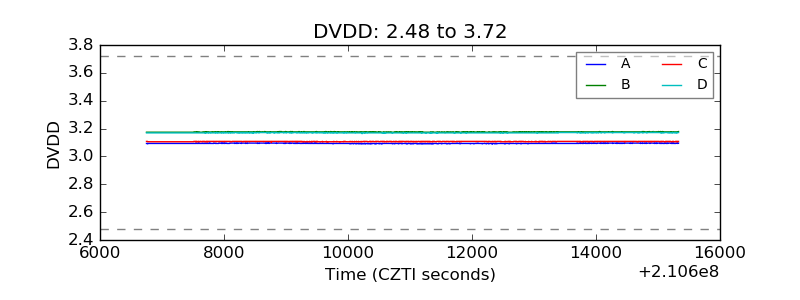 |
| Temperature 1 | 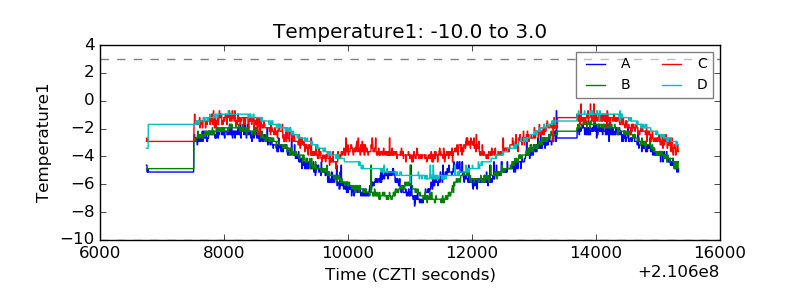 |
| Veto HV Monitor | 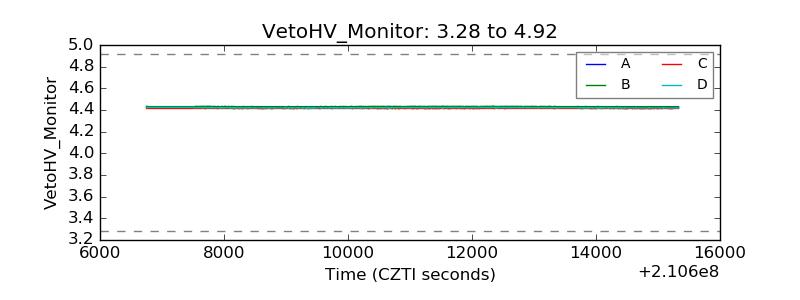 |
| Veto LLD | 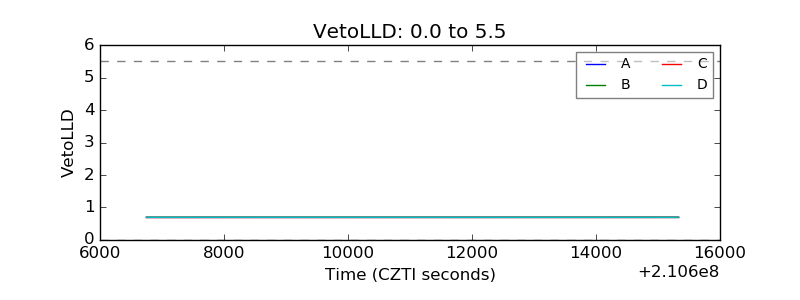 |
| Alpha Counter | 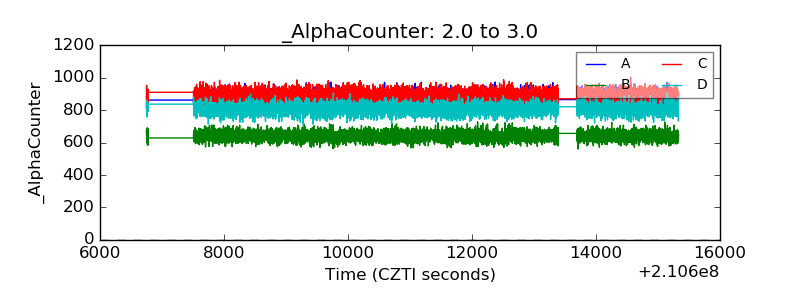 |
| _CPM_Rate | 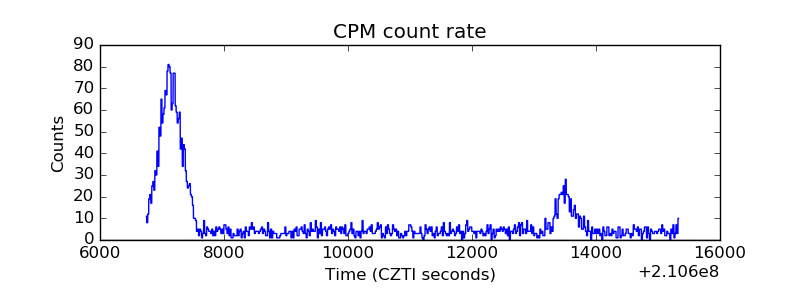 |
| CZT Counter | 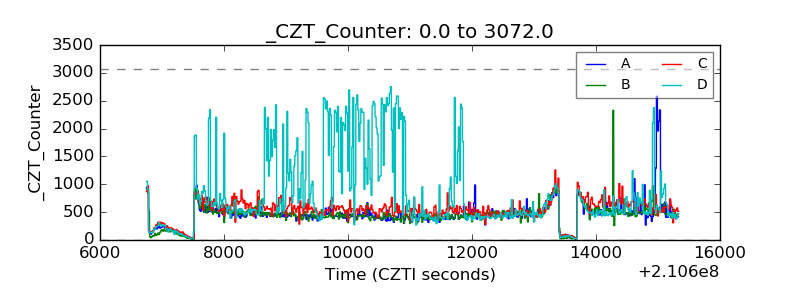 |
| +2.5 Volts monitor |  |
| +5 Volts monitor |  |
| _ROLL_ROT | 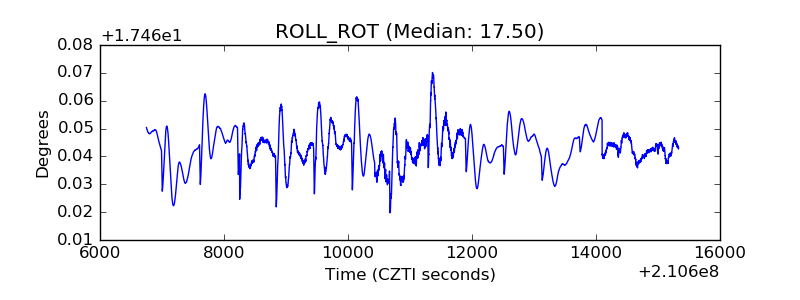 |
| _Roll_DEC | 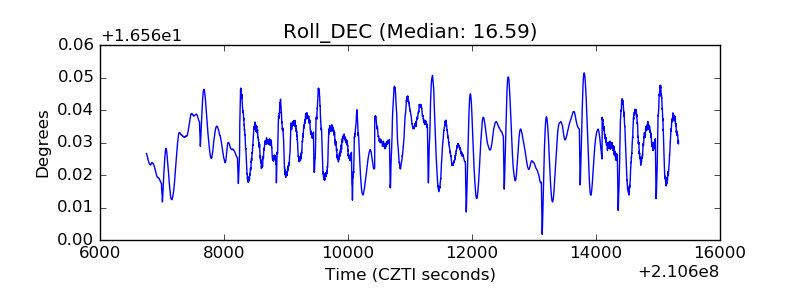 |
| _Roll_RA | 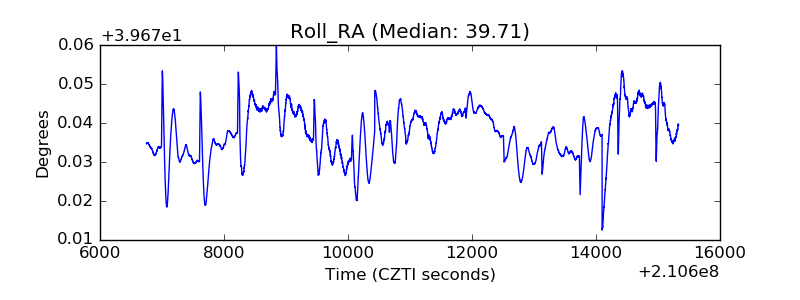 |
| Veto Counter | 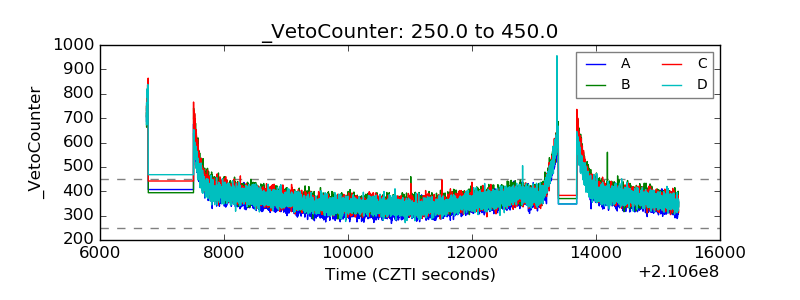 |