| Param | Original file | Final file |
|---|---|---|
| Filename | modeM0/AS1G05_218T04_9000000640_05056cztM0_level2.evt | modeM0/AS1G05_218T04_9000000640_05056cztM0_level2_quad_clean.evt |
| Size (bytes) | 679,331,520 | 73,497,600 |
| Size | 647.9 MB | 70.1 MB |
| Events in quadrant A | 4,491,564 | 426,631 |
| Events in quadrant B | 4,095,447 | 425,966 |
| Events in quadrant C | 4,205,421 | 418,029 |
| Events in quadrant D | 7,224,570 | 383,524 |
| Mode SS | |||
|---|---|---|---|
| Quadrant | BADHDUFLAG | Total packets | Discarded packets |
| A | 0 | 168 | 0 |
| B | 0 | 168 | 0 |
| C | 0 | 168 | 0 |
| D | 0 | 168 | 0 |
| Mode M9 | |||
|---|---|---|---|
| Quadrant | BADHDUFLAG | Total packets | Discarded packets |
| A | 0 | 6 | 0 |
| B | 0 | 6 | 0 |
| C | 0 | 6 | 0 |
| D | 0 | 6 | 0 |
| Mode M0 | |||
|---|---|---|---|
| Quadrant | BADHDUFLAG | Total packets | Discarded packets |
| A | 0 | 18972 | 3 |
| B | 0 | 17738 | 2 |
| C | 0 | 18279 | 5 |
| D | 0 | 27214 | 7 |
| Quadrant | Total seconds | Saturated seconds | Saturation percentage |
|---|---|---|---|
| A | 8225 | 275 | 3.343465% |
| B | 8225 | 212 | 2.577508% |
| C | 8224 | 159 | 1.933366% |
| D | 8224 | 1086 | 13.205253% |
Noise dominated data is calculated using 1-second bins in cleaned event files. If a bin has >2000 counts, and if more than 50% of those come from <1% of pixels, then it is considered to be noise-dominated and hence unusable.
| Quadrant | # 1 sec bins | Bins with >0 counts | Bins with >2000 counts | High rate bins dominated by noise | Noise dominated (total time) | Noise dominated (detector-on time) | Marked lightcurve |
|---|---|---|---|---|---|---|---|
| A | 8725 | 8228 | 92 | 92 | 1.05% | 1.12% | 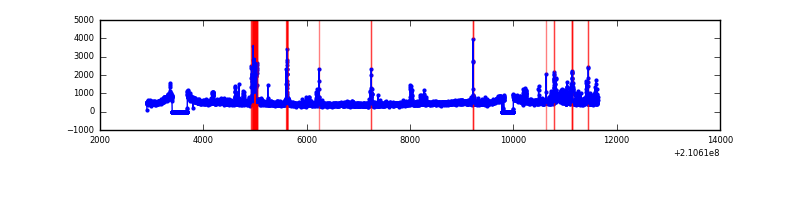 |
| B | 8725 | 8228 | 9 | 9 | 0.10% | 0.11% | 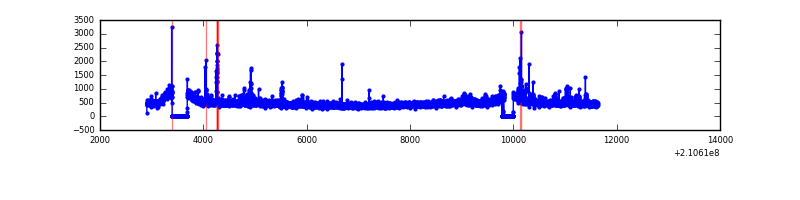 |
| C | 8725 | 8228 | 0 | 0 | 0.00% | 0.00% | 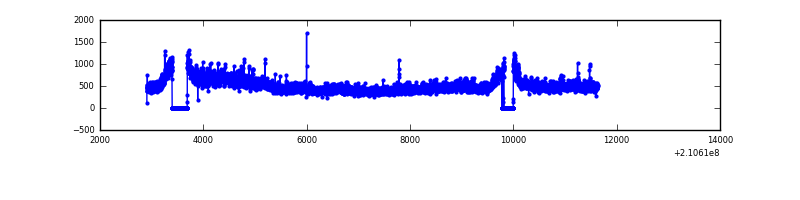 |
| D | 8725 | 8228 | 838 | 838 | 9.60% | 10.18% | 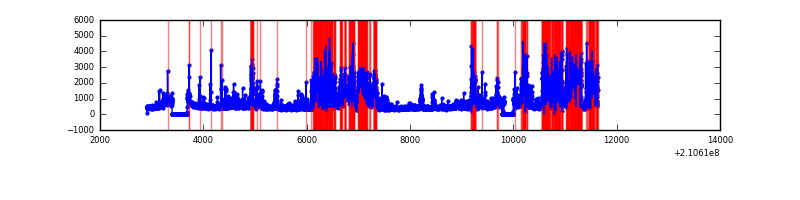 |
Top three noisy pixels from each quadrant. If the there are fewer than three noisy pixels in the level2.evt file, extra rows are filled as -1
| Pixel properties | Quadrant properties | ||||||
|---|---|---|---|---|---|---|---|
| Quadrant | DetID | PixID | Counts | Sigma | Mean | Median | Sigma |
| A | 15 | 174 | 455978 | 2240.41 | 984 | 962 | 203.1 |
| A | 13 | 251 | 213448 | 1046.24 | 984 | 962 | 203.1 |
| A | 0 | 50 | 32417 | 154.88 | 984 | 962 | 203.1 |
| B | 0 | 219 | 87800 | 449.95 | 994 | 970 | 193.0 |
| B | 15 | 204 | 49897 | 253.54 | 994 | 970 | 193.0 |
| B | 15 | 54 | 41224 | 208.6 | 994 | 970 | 193.0 |
| C | 1 | 16 | 446260 | 1989.19 | 952 | 956 | 223.9 |
| C | 14 | 67 | 31425 | 136.11 | 952 | 956 | 223.9 |
| C | 13 | 61 | 7737 | 30.29 | 952 | 956 | 223.9 |
| D | 13 | 235 | 3355061 | 14774.36 | 915 | 887 | 227.0 |
| D | 1 | 7 | 153225 | 671.01 | 915 | 887 | 227.0 |
| D | 13 | 239 | 76742 | 334.12 | 915 | 887 | 227.0 |
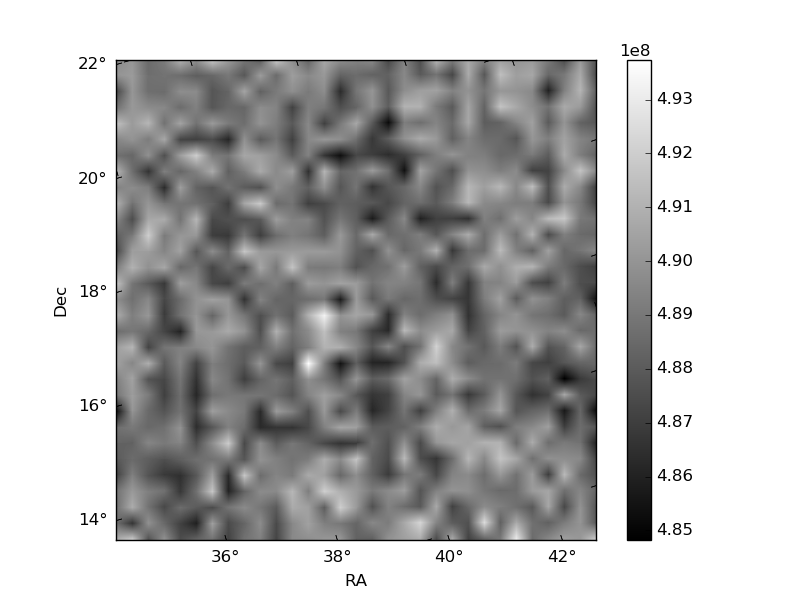
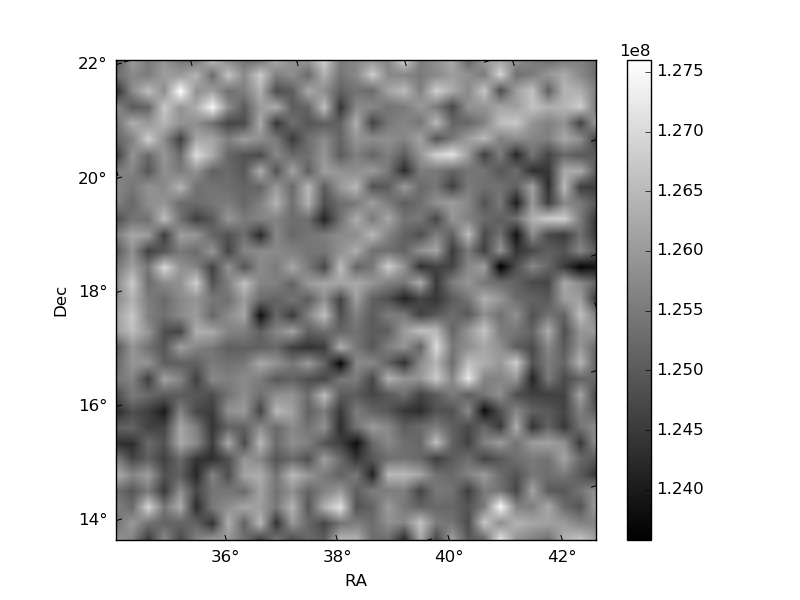
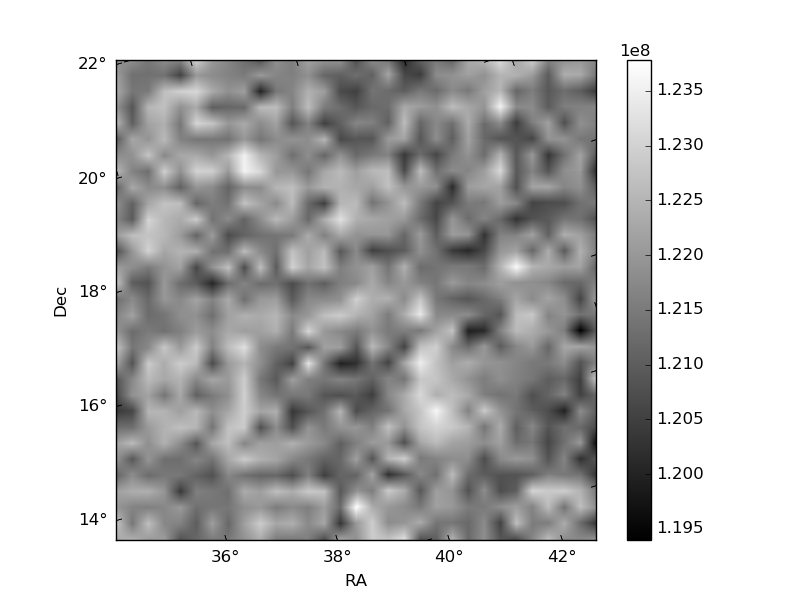
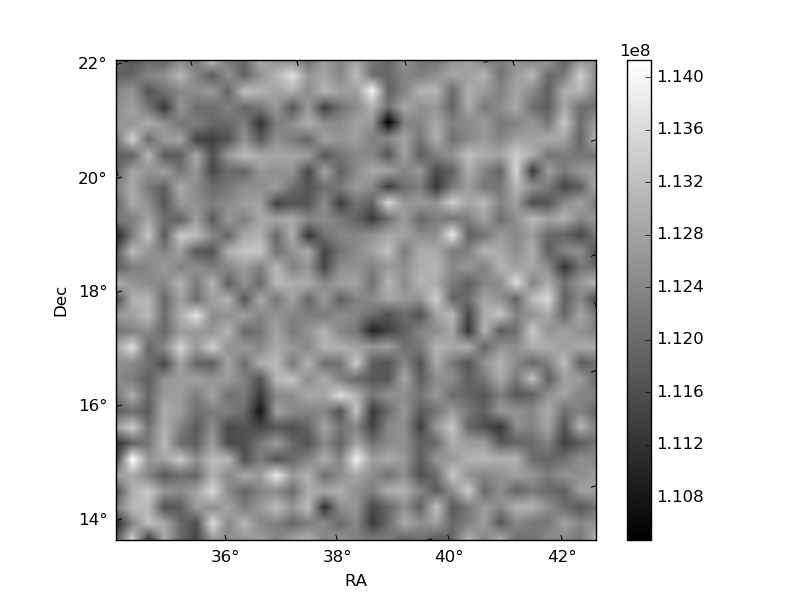
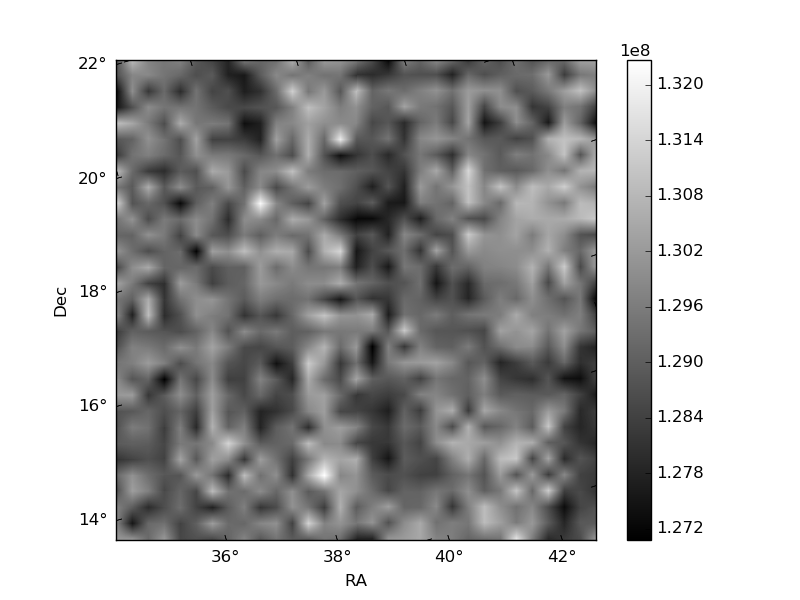
Histogram calculated using DETX and DETY for each event in the final _common_clean file
| Quadrant A | 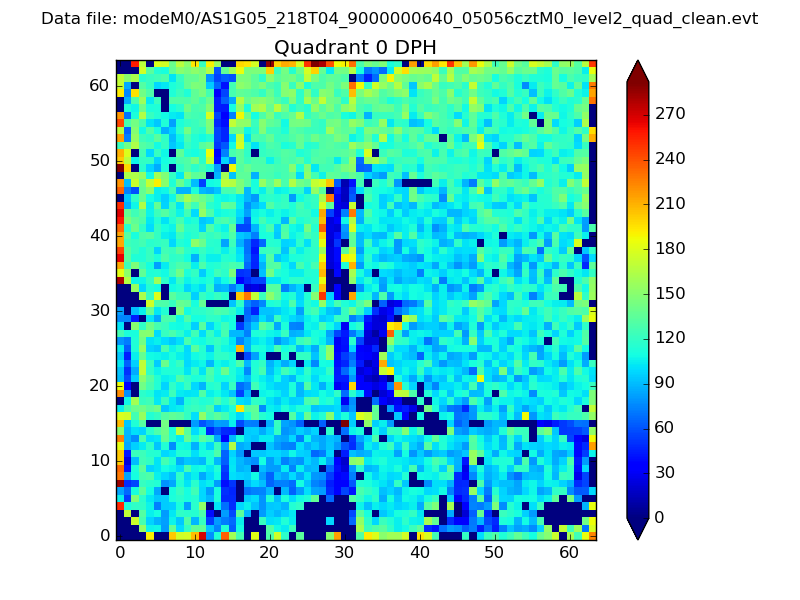 |
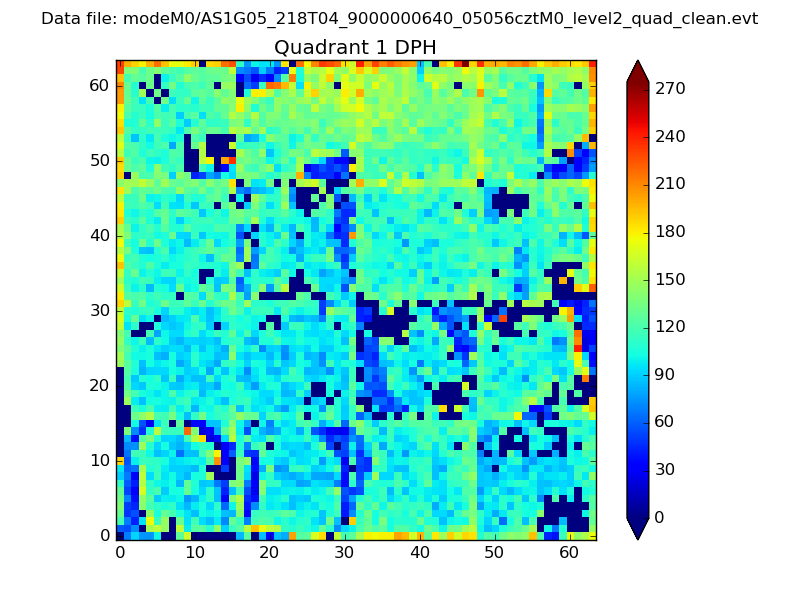 |
Quadrant B |
|---|---|---|---|
| Quadrant D | 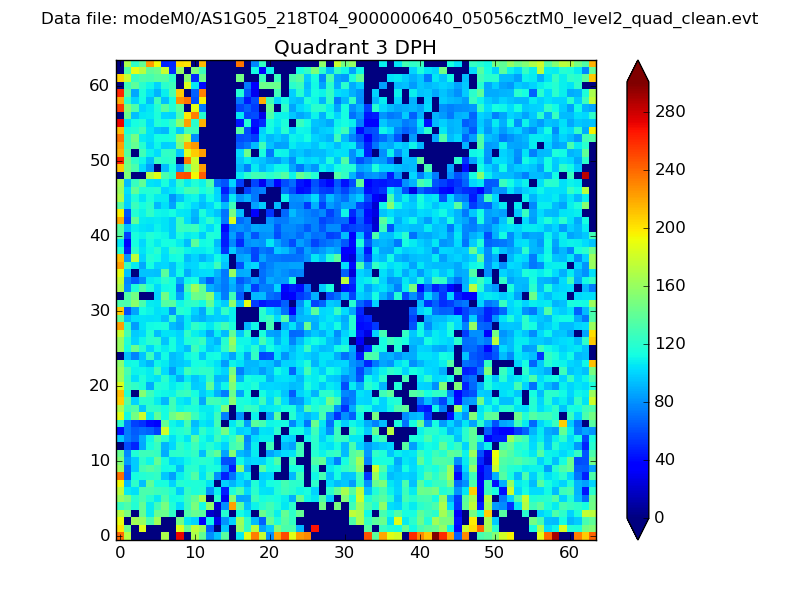 |
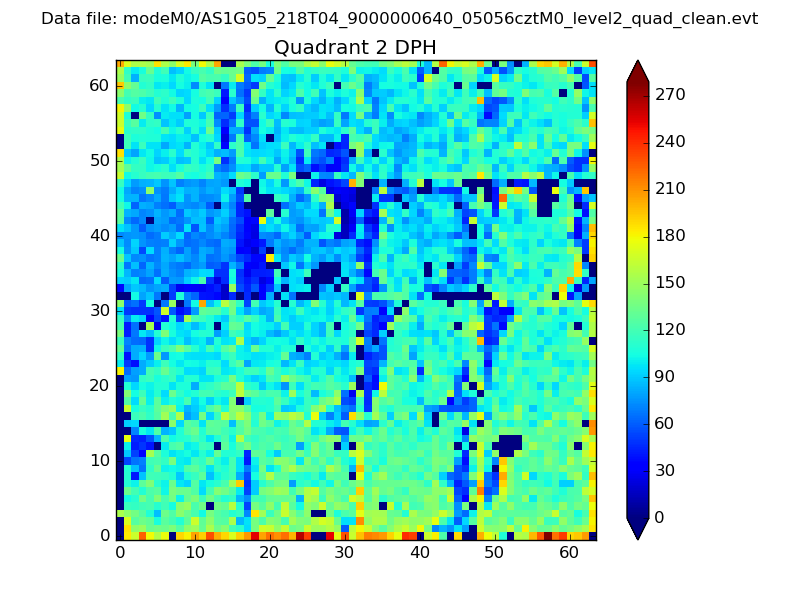 |
Quadrant C |
| Plot type | Count rate plots | Images |
|---|---|---|
| Comparison with Poisson distribution Blue bars denote a histogram of data divided into 1 sec bins. Red curve is a Poisson curve with rate = median count rate of data. |
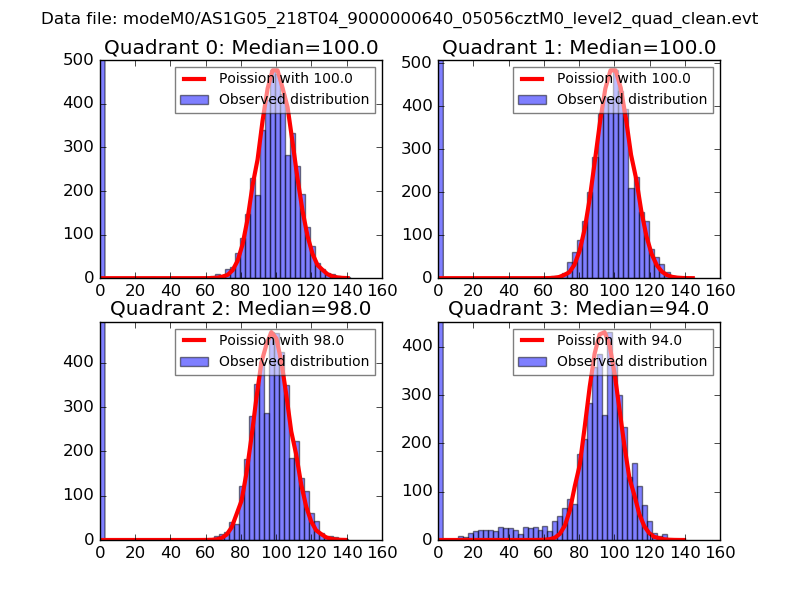 |
 |
| Quadrant-wise count rates Data is divided into 100 sec bins |
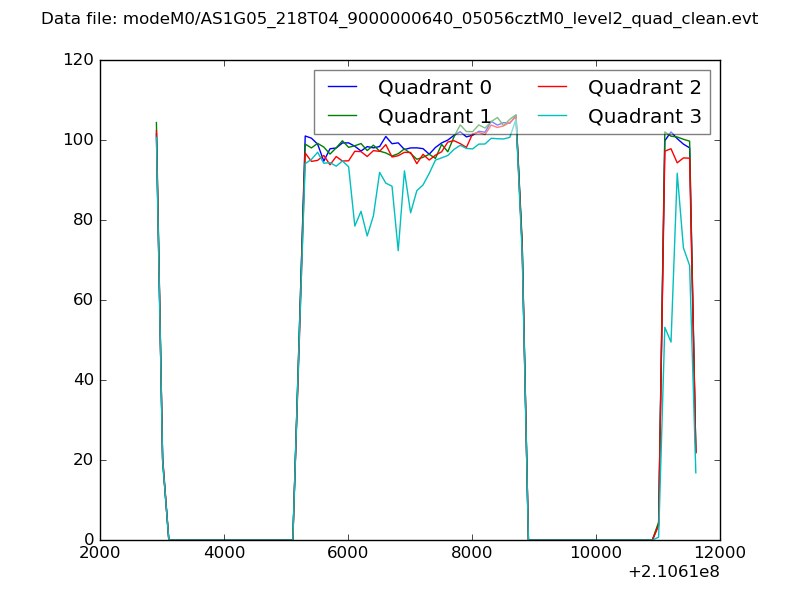 |
|
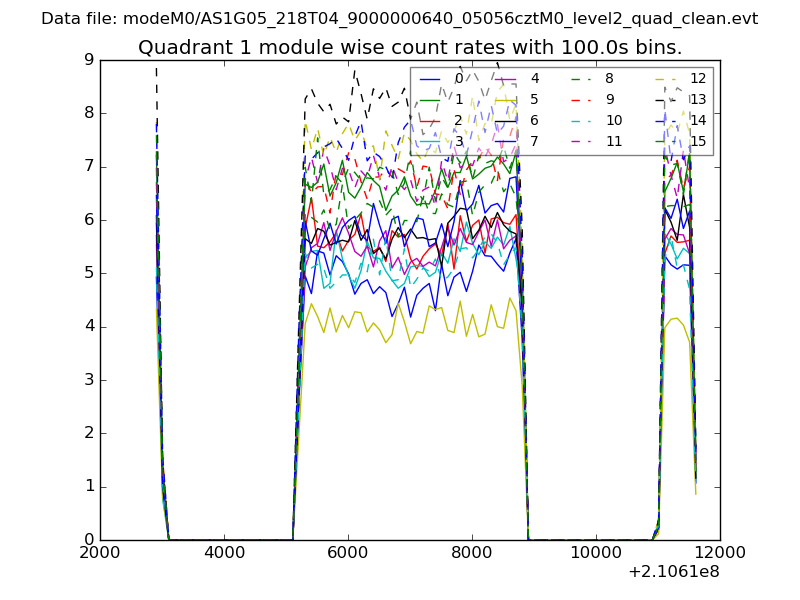
| Module-wise count rates for Quadrant A Data is divided into 100 sec bins |
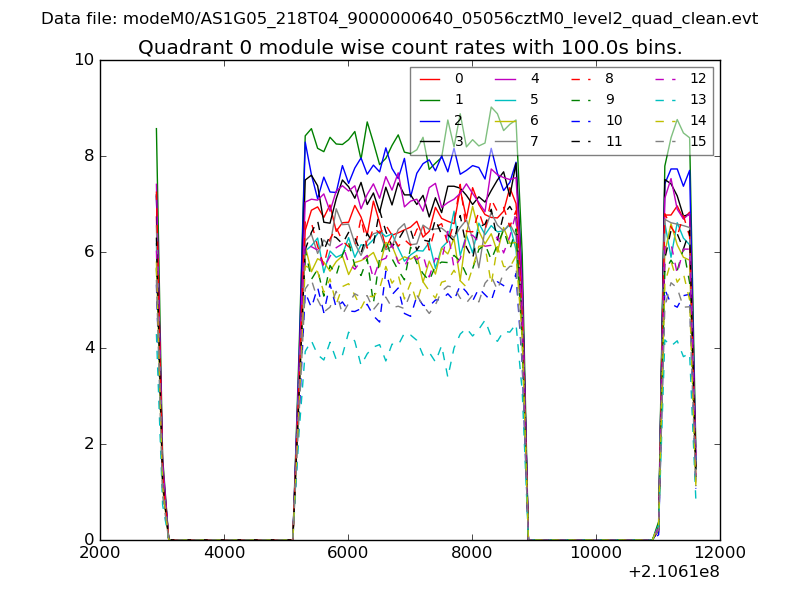 |
 |
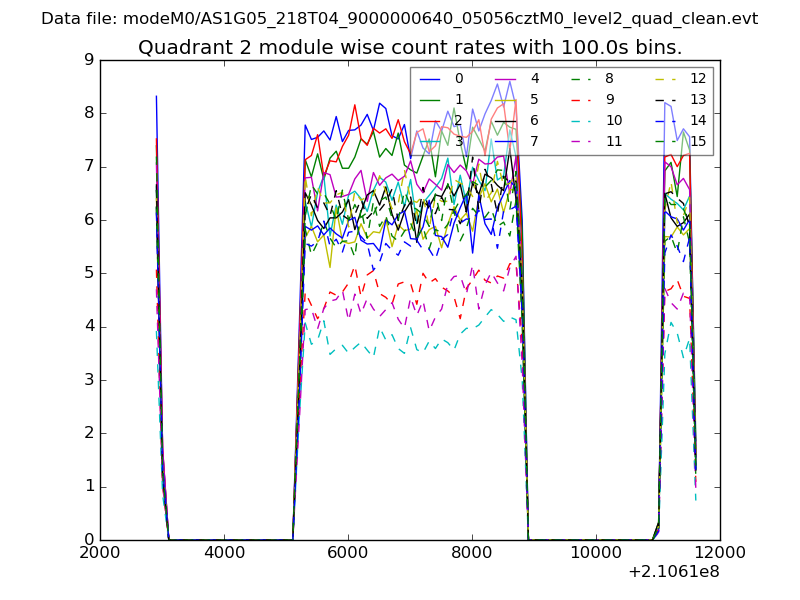
| Module-wise count rates for Quadrant B Data is divided into 100 sec bins |
 |
 |
| Module-wise count rates for Quadrant C Data is divided into 100 sec bins |
 |
 |
| Module-wise count rates for Quadrant D Data is divided into 100 sec bins |
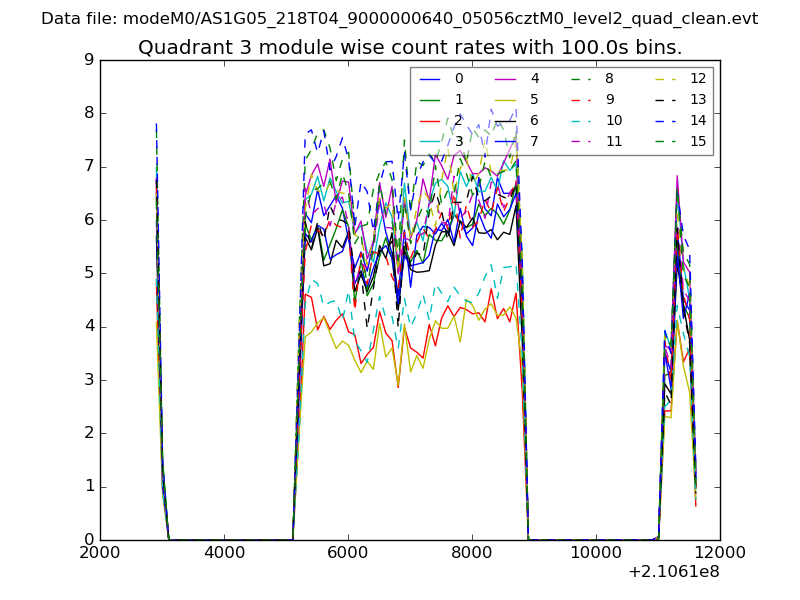 |
 |
| Parameter | Plot |
|---|---|
| CZT HV Monitor | 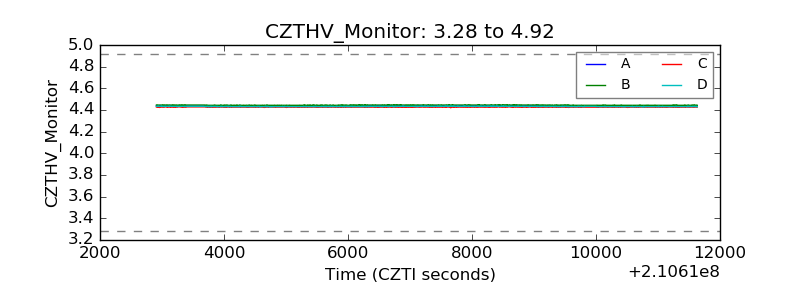 |
| D_VDD | 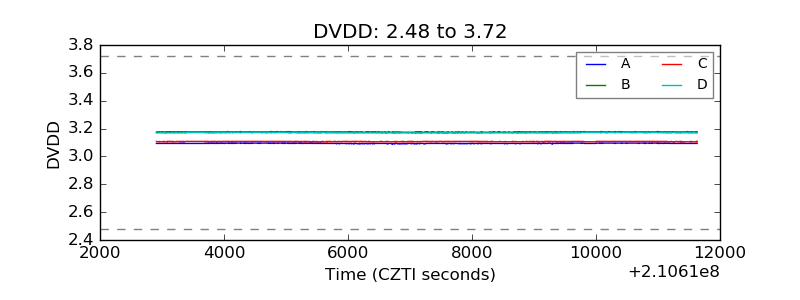 |
| Temperature 1 | 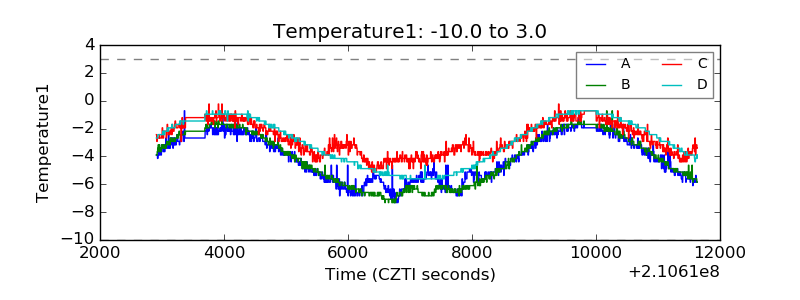 |
| Veto HV Monitor | 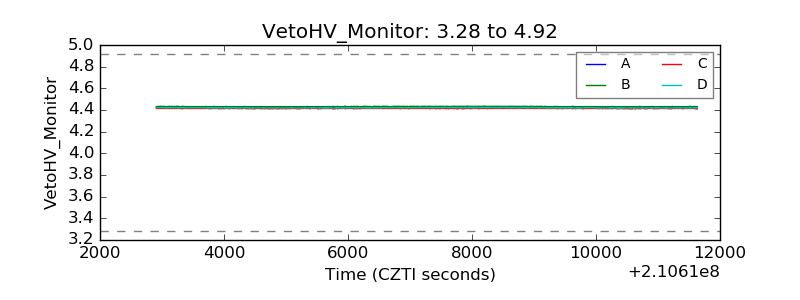 |
| Veto LLD | 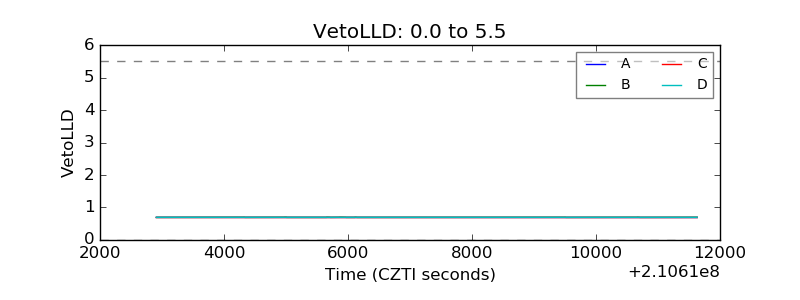 |
| Alpha Counter | 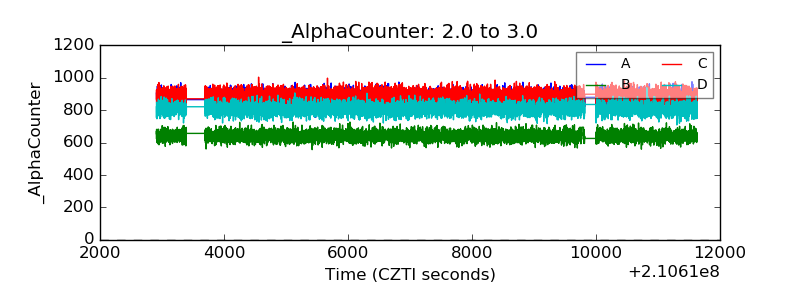 |
| _CPM_Rate | 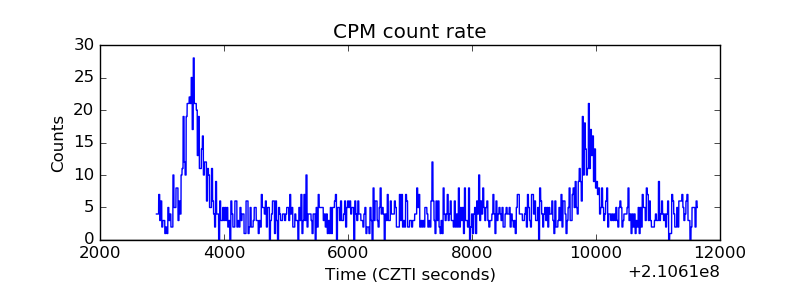 |
| CZT Counter | 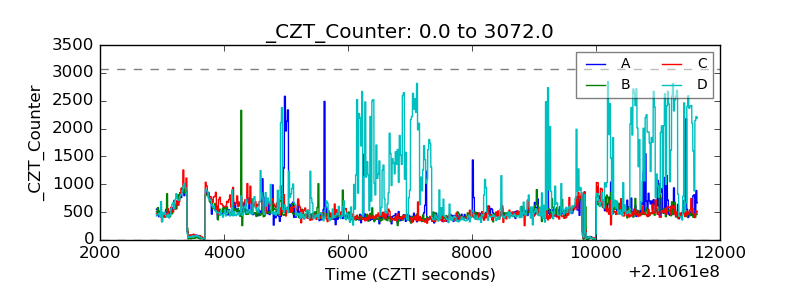 |
| +2.5 Volts monitor |  |
| +5 Volts monitor |  |
| _ROLL_ROT | 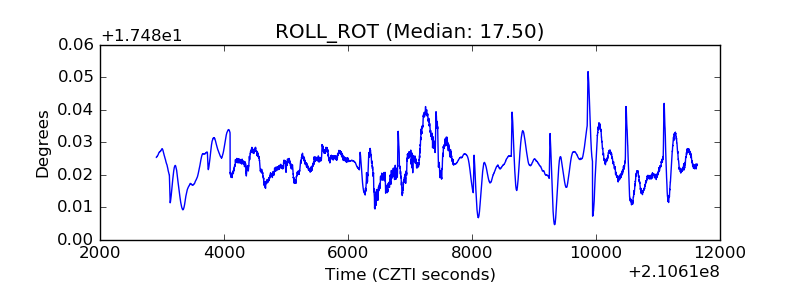 |
| _Roll_DEC | 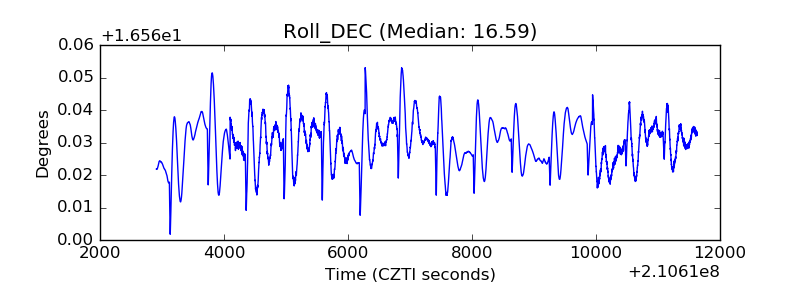 |
| _Roll_RA | 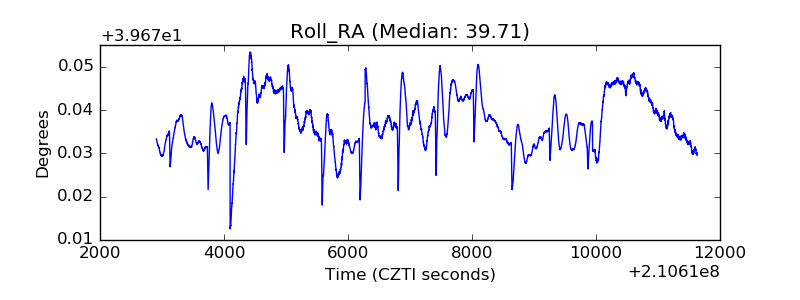 |
| Veto Counter | 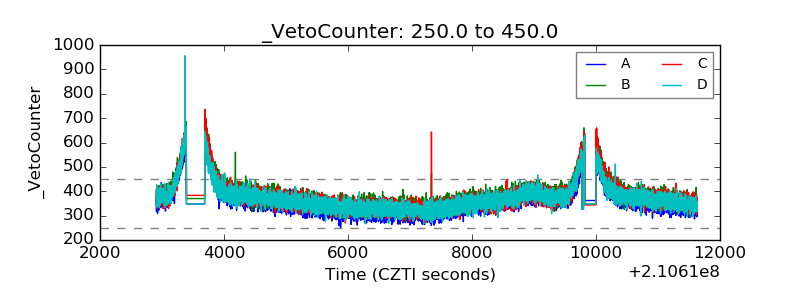 |