| Param | Original file | Final file |
|---|---|---|
| Filename | modeM0/AS1G05_218T04_9000000640_05059cztM0_level2.evt | modeM0/AS1G05_218T04_9000000640_05059cztM0_level2_quad_clean.evt |
| Size (bytes) | 464,791,680 | 60,978,240 |
| Size | 443.3 MB | 58.2 MB |
| Events in quadrant A | 3,424,386 | 352,158 |
| Events in quadrant B | 3,190,440 | 352,750 |
| Events in quadrant C | 3,387,407 | 347,706 |
| Events in quadrant D | 3,630,120 | 337,994 |
| Mode SS | |||
|---|---|---|---|
| Quadrant | BADHDUFLAG | Total packets | Discarded packets |
| A | 0 | 132 | 0 |
| B | 0 | 132 | 0 |
| C | 0 | 132 | 0 |
| D | 0 | 132 | 0 |
| Mode M9 | |||
|---|---|---|---|
| Quadrant | BADHDUFLAG | Total packets | Discarded packets |
| A | 0 | 4 | 0 |
| B | 0 | 4 | 0 |
| C | 0 | 4 | 0 |
| D | 0 | 4 | 0 |
| Mode M0 | |||
|---|---|---|---|
| Quadrant | BADHDUFLAG | Total packets | Discarded packets |
| A | 0 | 14886 | 4 |
| B | 0 | 13888 | 4 |
| C | 0 | 14434 | 3 |
| D | 0 | 15585 | 3 |
| Quadrant | Total seconds | Saturated seconds | Saturation percentage |
|---|---|---|---|
| A | 6532 | 139 | 2.127985% |
| B | 6532 | 53 | 0.811390% |
| C | 6532 | 55 | 0.842009% |
| D | 6532 | 181 | 2.770974% |
Noise dominated data is calculated using 1-second bins in cleaned event files. If a bin has >2000 counts, and if more than 50% of those come from <1% of pixels, then it is considered to be noise-dominated and hence unusable.
| Quadrant | # 1 sec bins | Bins with >0 counts | Bins with >2000 counts | High rate bins dominated by noise | Noise dominated (total time) | Noise dominated (detector-on time) | Marked lightcurve |
|---|---|---|---|---|---|---|---|
| A | 6883 | 6534 | 45 | 45 | 0.65% | 0.69% | 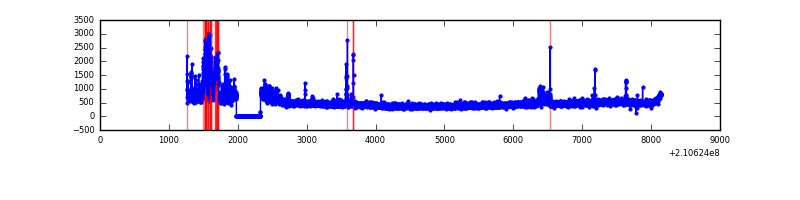 |
| B | 6883 | 6534 | 1 | 1 | 0.01% | 0.02% | 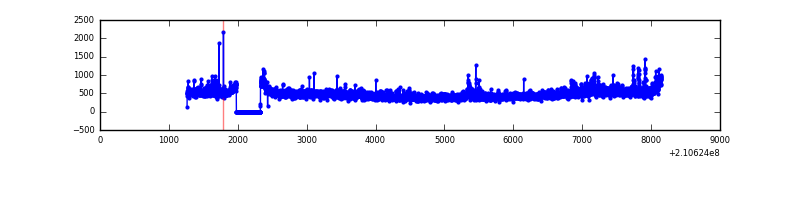 |
| C | 6883 | 6534 | 0 | 0 | 0.00% | 0.00% | 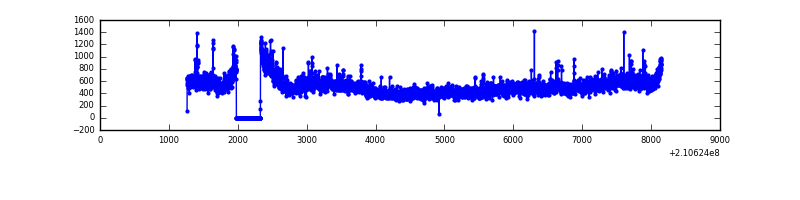 |
| D | 6883 | 6534 | 99 | 99 | 1.44% | 1.52% | 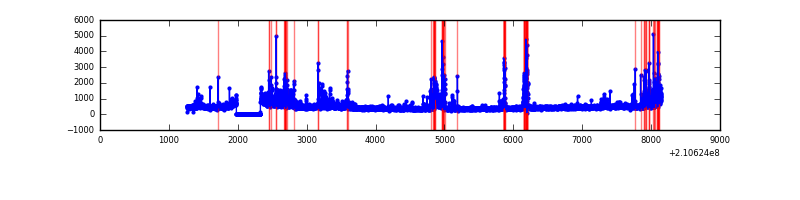 |
Top three noisy pixels from each quadrant. If the there are fewer than three noisy pixels in the level2.evt file, extra rows are filled as -1
| Pixel properties | Quadrant properties | ||||||
|---|---|---|---|---|---|---|---|
| Quadrant | DetID | PixID | Counts | Sigma | Mean | Median | Sigma |
| A | 13 | 251 | 456588 | 2935.5 | 758 | 740 | 155.3 |
| A | 0 | 50 | 32188 | 202.51 | 758 | 740 | 155.3 |
| A | 15 | 174 | 12958 | 78.68 | 758 | 740 | 155.3 |
| B | 15 | 204 | 103937 | 689.34 | 765 | 746 | 149.7 |
| B | 4 | 48 | 70220 | 464.1 | 765 | 746 | 149.7 |
| B | 0 | 219 | 32694 | 213.42 | 765 | 746 | 149.7 |
| C | 1 | 16 | 508092 | 2955.28 | 731 | 733 | 171.7 |
| C | 14 | 67 | 16966 | 94.55 | 731 | 733 | 171.7 |
| C | 9 | 54 | 7108 | 37.13 | 731 | 733 | 171.7 |
| D | 13 | 239 | 310918 | 1706.2 | 728 | 703 | 181.8 |
| D | 2 | 33 | 258011 | 1415.21 | 728 | 703 | 181.8 |
| D | 13 | 235 | 137552 | 752.68 | 728 | 703 | 181.8 |
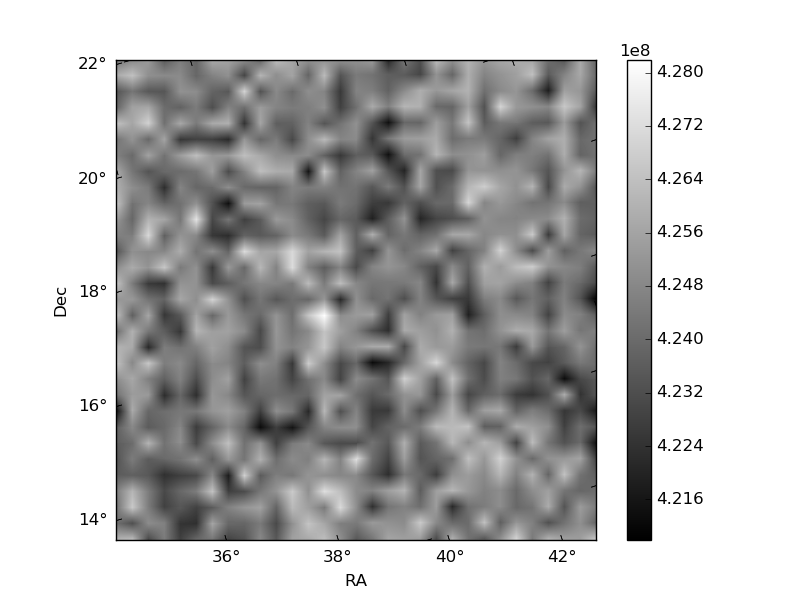
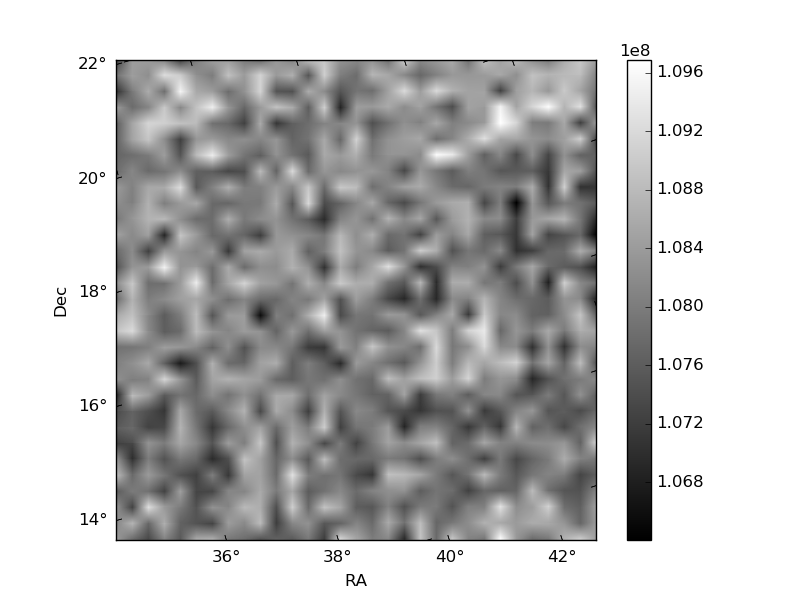
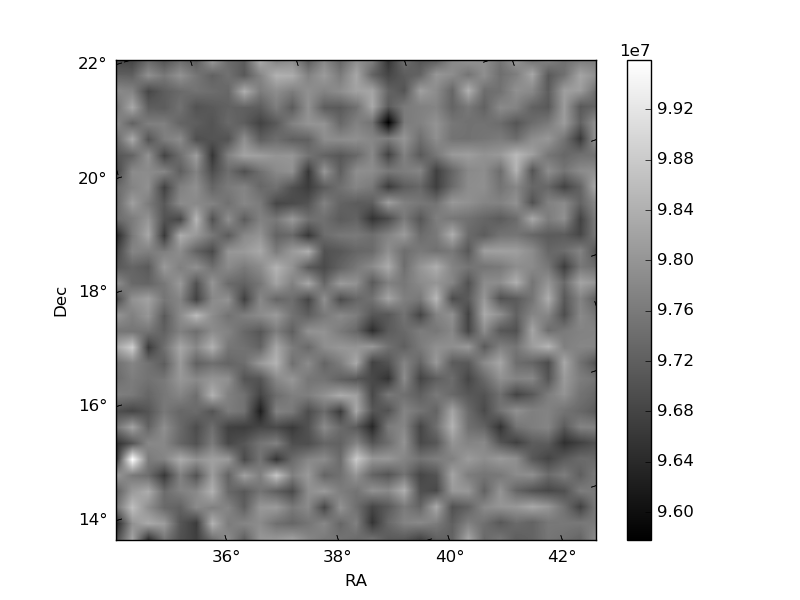
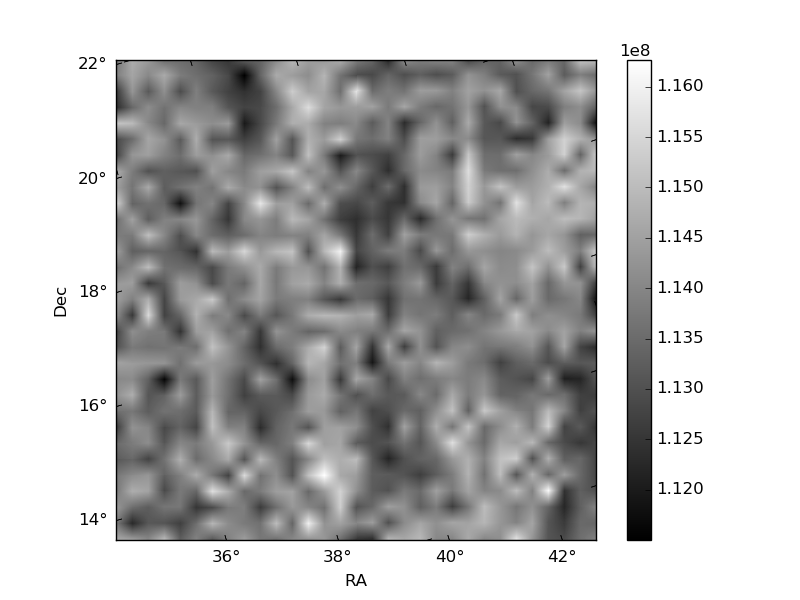
Histogram calculated using DETX and DETY for each event in the final _common_clean file
| Quadrant A | 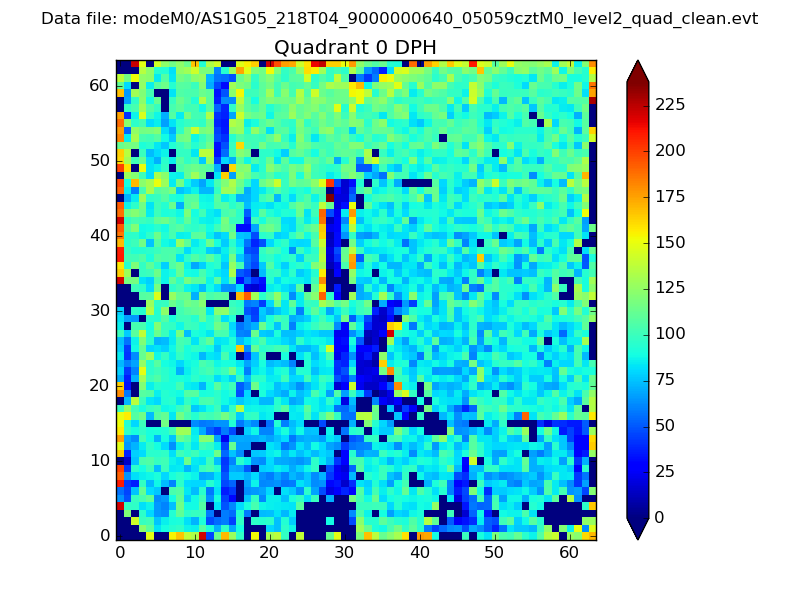 |
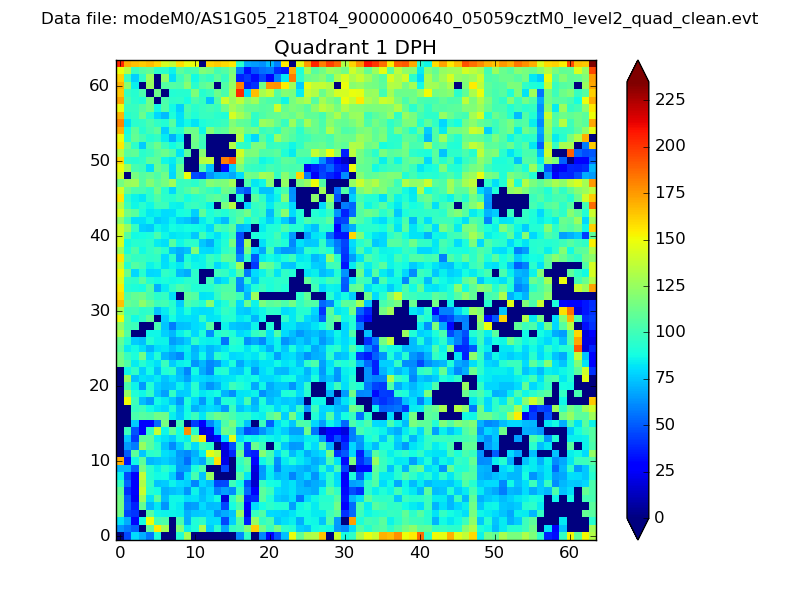 |
Quadrant B |
|---|---|---|---|
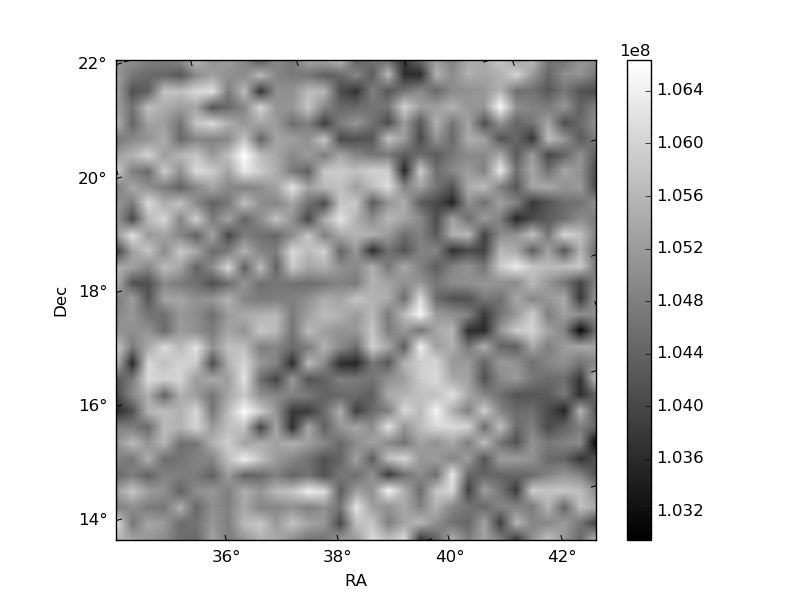
| Quadrant D | 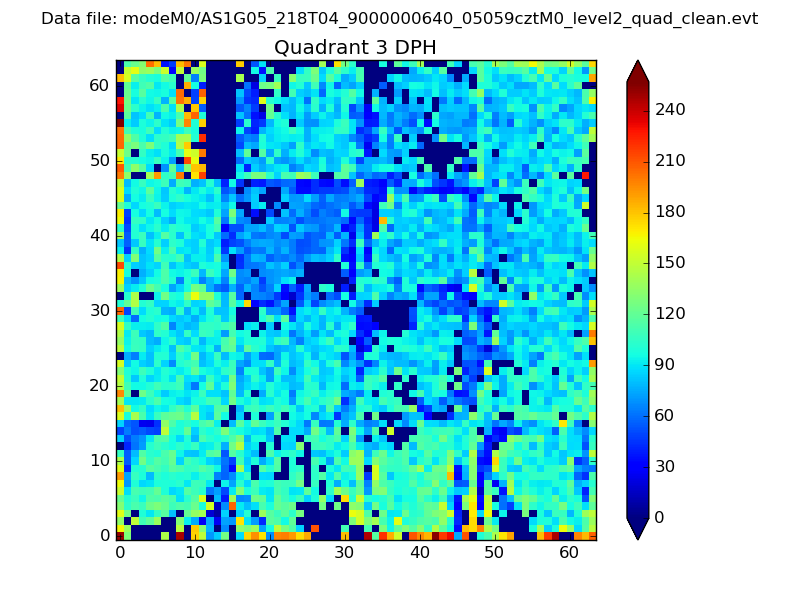 |
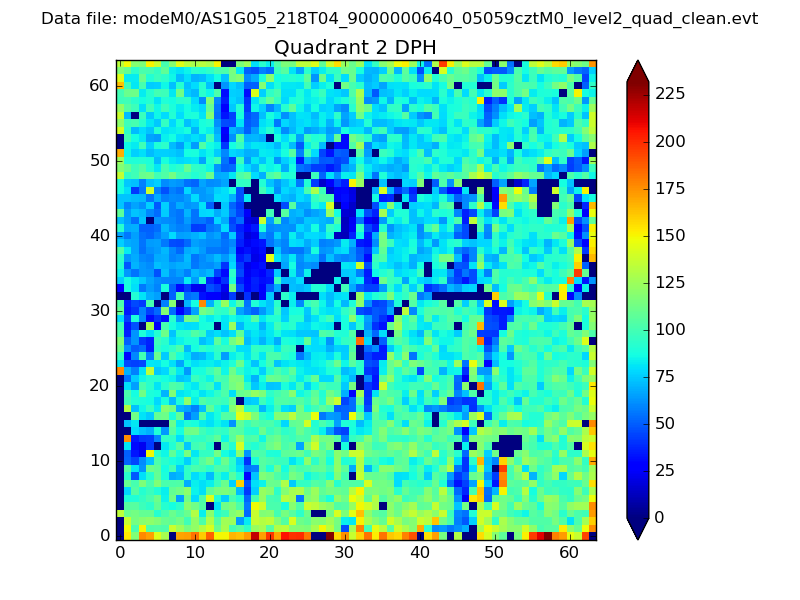 |
Quadrant C |
| Plot type | Count rate plots | Images |
|---|---|---|
| Comparison with Poisson distribution Blue bars denote a histogram of data divided into 1 sec bins. Red curve is a Poisson curve with rate = median count rate of data. |
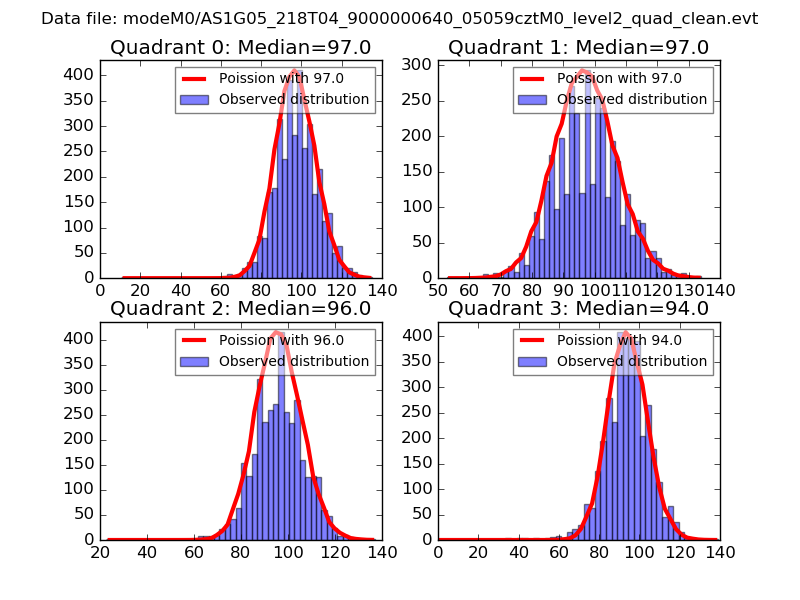 |
 |
| Quadrant-wise count rates Data is divided into 100 sec bins |
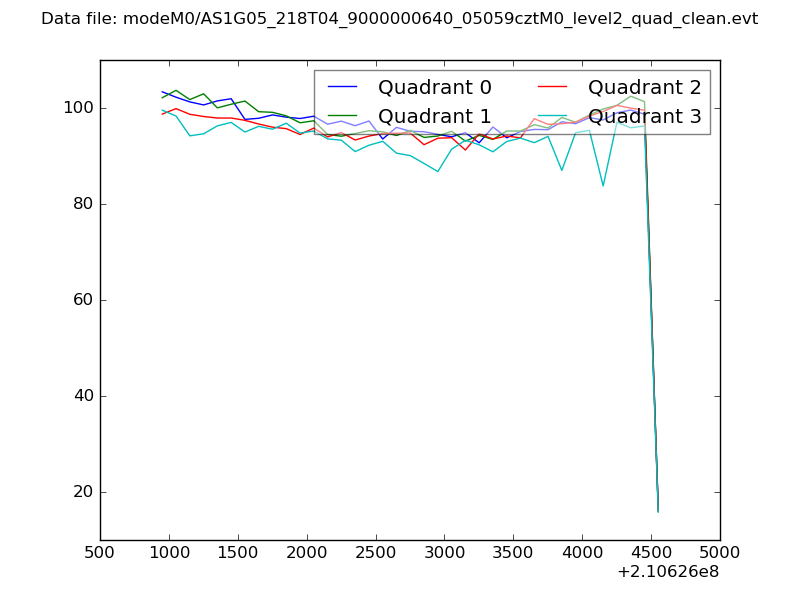 |
|
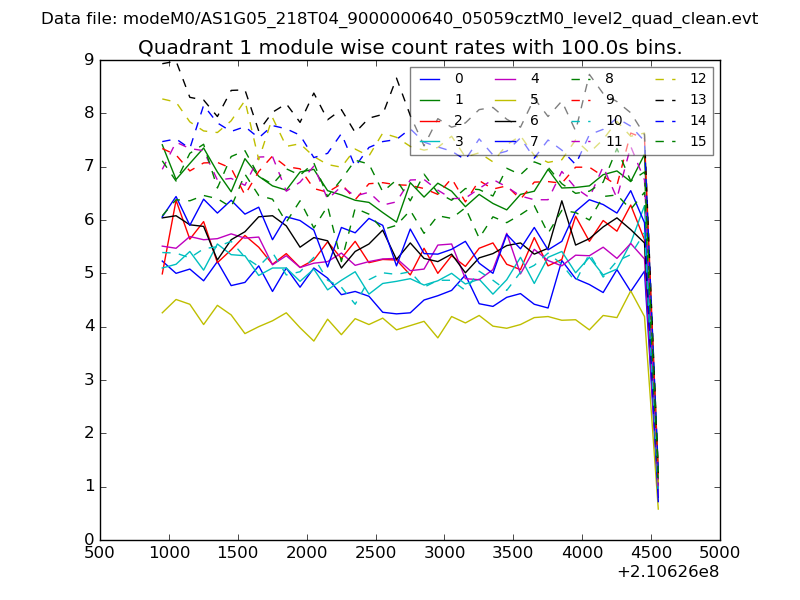
| Module-wise count rates for Quadrant A Data is divided into 100 sec bins |
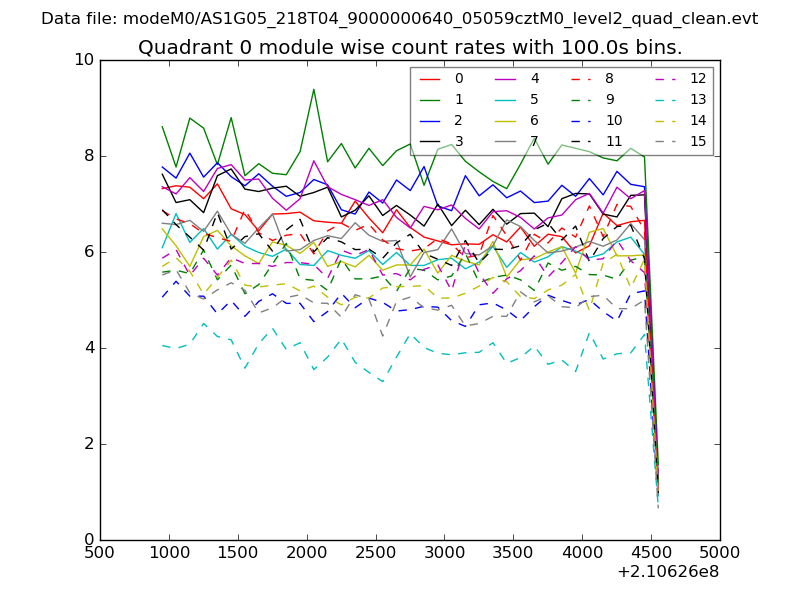 |
 |
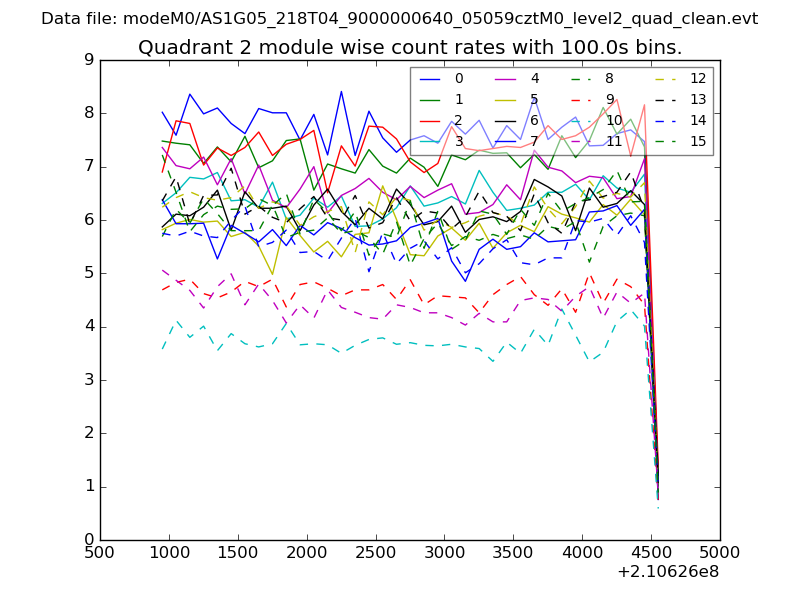
| Module-wise count rates for Quadrant B Data is divided into 100 sec bins |
 |
 |
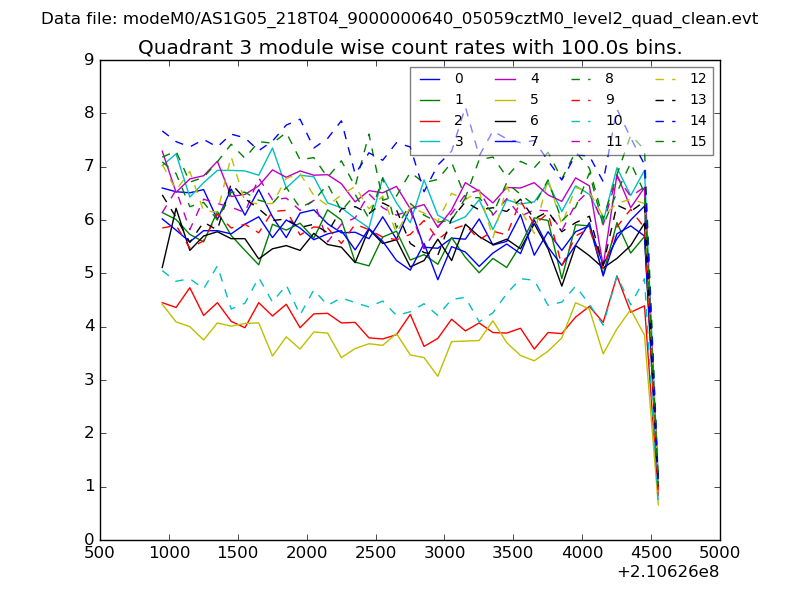
| Module-wise count rates for Quadrant C Data is divided into 100 sec bins |
 |
 |
| Module-wise count rates for Quadrant D Data is divided into 100 sec bins |
 |
 |
| Parameter | Plot |
|---|---|
| CZT HV Monitor | 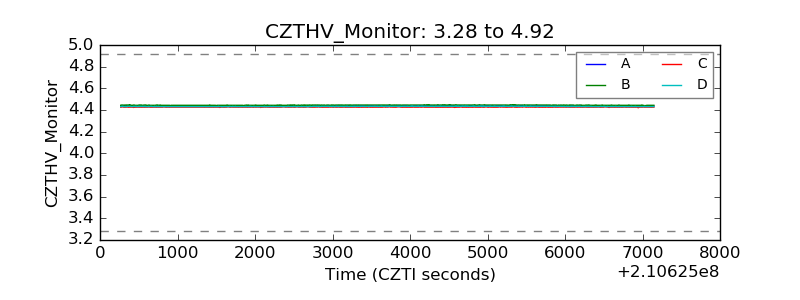 |
| D_VDD | 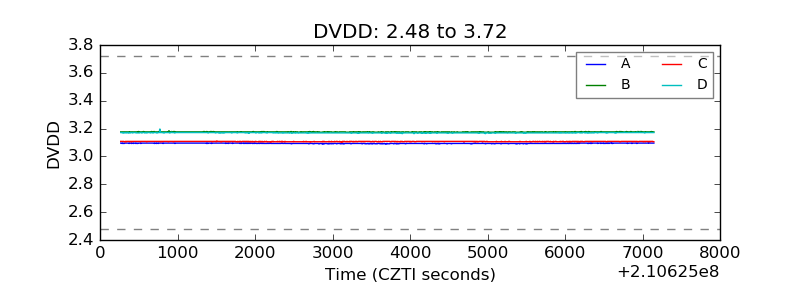 |
| Temperature 1 | 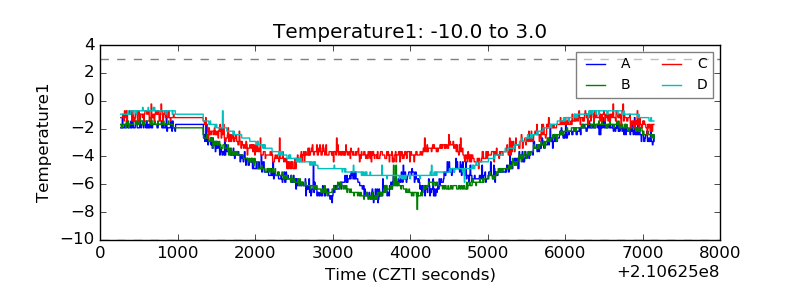 |
| Veto HV Monitor | 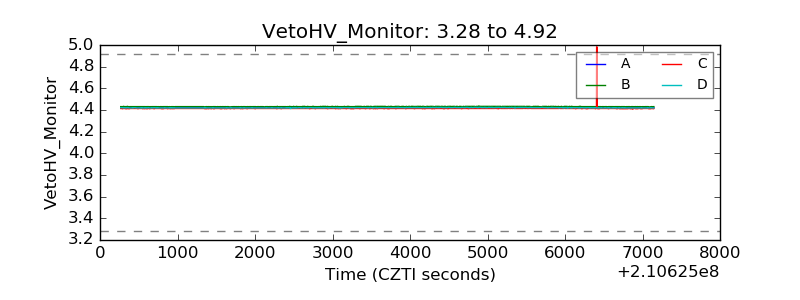 |
| Veto LLD | 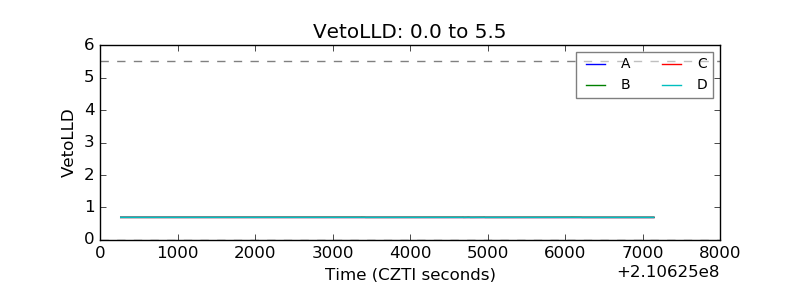 |
| Alpha Counter | 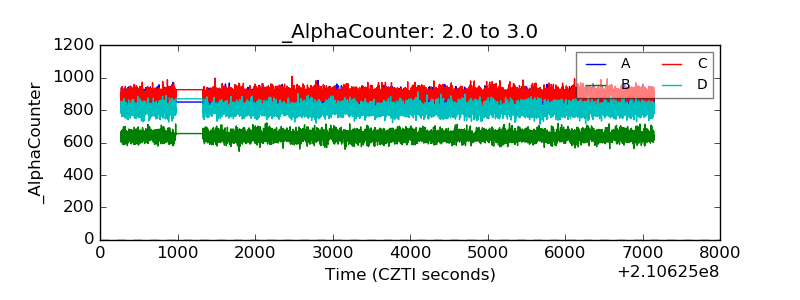 |
| _CPM_Rate |  |
| CZT Counter | 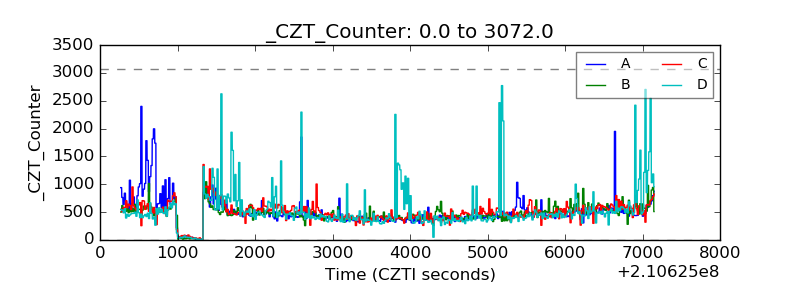 |
| +2.5 Volts monitor |  |
| +5 Volts monitor |  |
| _ROLL_ROT | 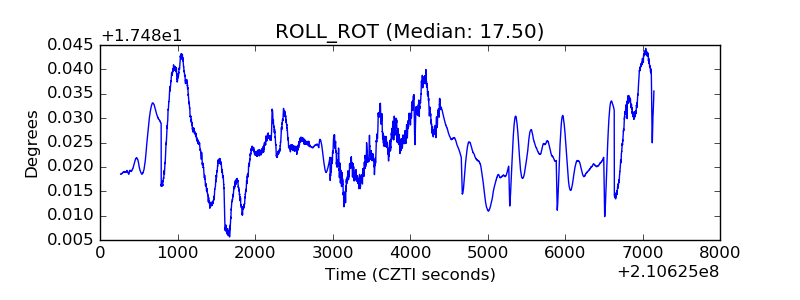 |
| _Roll_DEC | 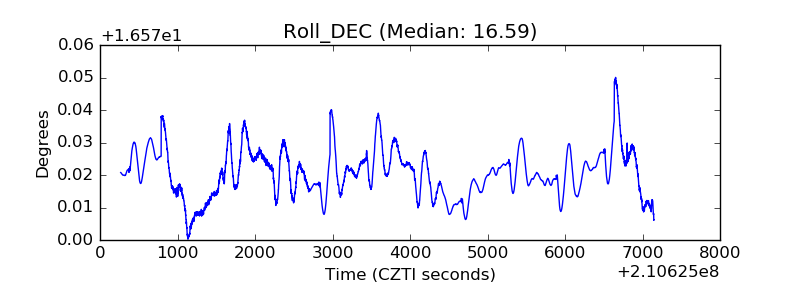 |
| _Roll_RA | 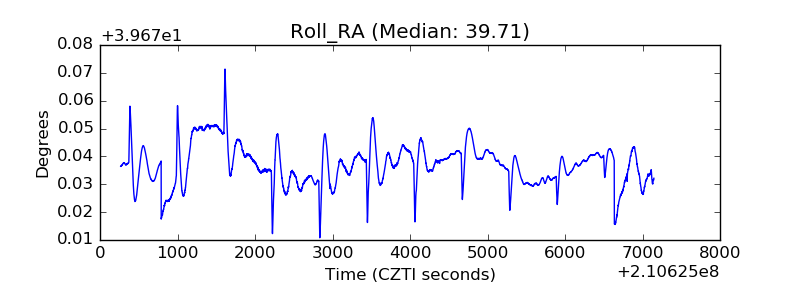 |
| Veto Counter | 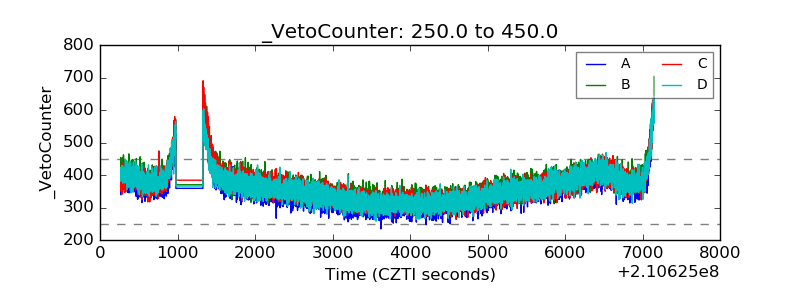 |