| Param | Original file | Final file |
|---|---|---|
| Filename | modeM0/AS1G05_218T04_9000000640_05064cztM0_level2.evt | modeM0/AS1G05_218T04_9000000640_05064cztM0_level2_quad_clean.evt |
| Size (bytes) | 391,573,440 | 68,483,520 |
| Size | 373.4 MB | 65.3 MB |
| Events in quadrant A | 2,835,640 | 420,582 |
| Events in quadrant B | 2,862,226 | 422,800 |
| Events in quadrant C | 2,741,174 | 412,285 |
| Events in quadrant D | 3,013,717 | 401,114 |
| Mode SS | |||
|---|---|---|---|
| Quadrant | BADHDUFLAG | Total packets | Discarded packets |
| A | 0 | 122 | 0 |
| B | 0 | 122 | 0 |
| C | 0 | 122 | 0 |
| D | 0 | 122 | 0 |
| Mode M9 | |||
|---|---|---|---|
| Quadrant | BADHDUFLAG | Total packets | Discarded packets |
| A | 0 | 12 | 0 |
| B | 0 | 12 | 0 |
| C | 0 | 12 | 0 |
| D | 0 | 12 | 0 |
| Mode M0 | |||
|---|---|---|---|
| Quadrant | BADHDUFLAG | Total packets | Discarded packets |
| A | 0 | 12307 | 2 |
| B | 0 | 12320 | 1 |
| C | 0 | 12232 | 1 |
| D | 0 | 13098 | 1 |
| Quadrant | Total seconds | Saturated seconds | Saturation percentage |
|---|---|---|---|
| A | 5962 | 47 | 0.788326% |
| B | 5962 | 46 | 0.771553% |
| C | 5962 | 22 | 0.369004% |
| D | 5962 | 109 | 1.828246% |
Noise dominated data is calculated using 1-second bins in cleaned event files. If a bin has >2000 counts, and if more than 50% of those come from <1% of pixels, then it is considered to be noise-dominated and hence unusable.
| Quadrant | # 1 sec bins | Bins with >0 counts | Bins with >2000 counts | High rate bins dominated by noise | Noise dominated (total time) | Noise dominated (detector-on time) | Marked lightcurve |
|---|---|---|---|---|---|---|---|
| A | 7167 | 5963 | 1 | 1 | 0.01% | 0.02% | 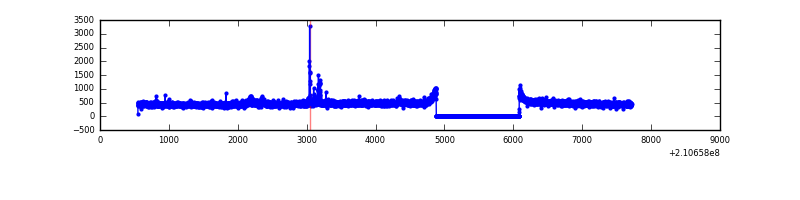 |
| B | 7167 | 5963 | 0 | 0 | 0.00% | 0.00% | 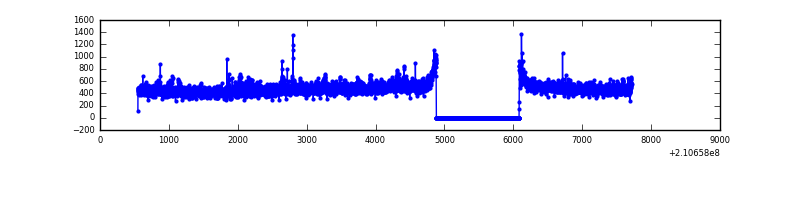 |
| C | 7167 | 5963 | 0 | 0 | 0.00% | 0.00% | 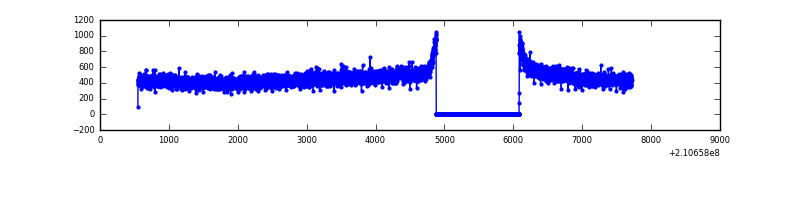 |
| D | 7167 | 5963 | 67 | 67 | 0.93% | 1.12% | 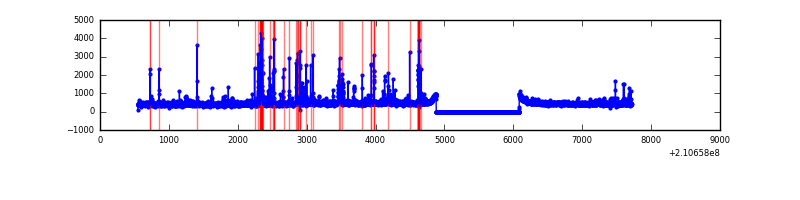 |
Top three noisy pixels from each quadrant. If the there are fewer than three noisy pixels in the level2.evt file, extra rows are filled as -1
| Pixel properties | Quadrant properties | ||||||
|---|---|---|---|---|---|---|---|
| Quadrant | DetID | PixID | Counts | Sigma | Mean | Median | Sigma |
| A | 14 | 111 | 41363 | 280.6 | 712 | 697 | 144.9 |
| A | 0 | 50 | 35595 | 240.8 | 712 | 697 | 144.9 |
| A | 13 | 251 | 18447 | 122.48 | 712 | 697 | 144.9 |
| B | 15 | 204 | 81905 | 591.89 | 711 | 695 | 137.2 |
| B | 0 | 219 | 23303 | 164.78 | 711 | 695 | 137.2 |
| B | 12 | 111 | 12351 | 84.95 | 711 | 695 | 137.2 |
| C | 1 | 16 | 87727 | 551.67 | 678 | 682 | 157.8 |
| C | 13 | 61 | 5515 | 30.63 | 678 | 682 | 157.8 |
| C | 14 | 67 | 3482 | 17.75 | 678 | 682 | 157.8 |
| D | 13 | 235 | 196931 | 1165.1 | 685 | 666 | 168.5 |
| D | 10 | 15 | 89454 | 527.08 | 685 | 666 | 168.5 |
| D | 2 | 136 | 43299 | 253.08 | 685 | 666 | 168.5 |
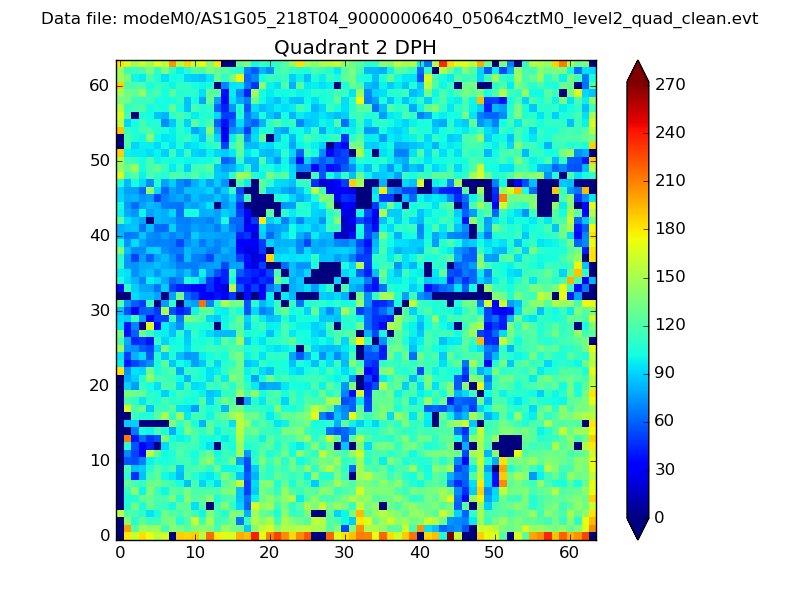
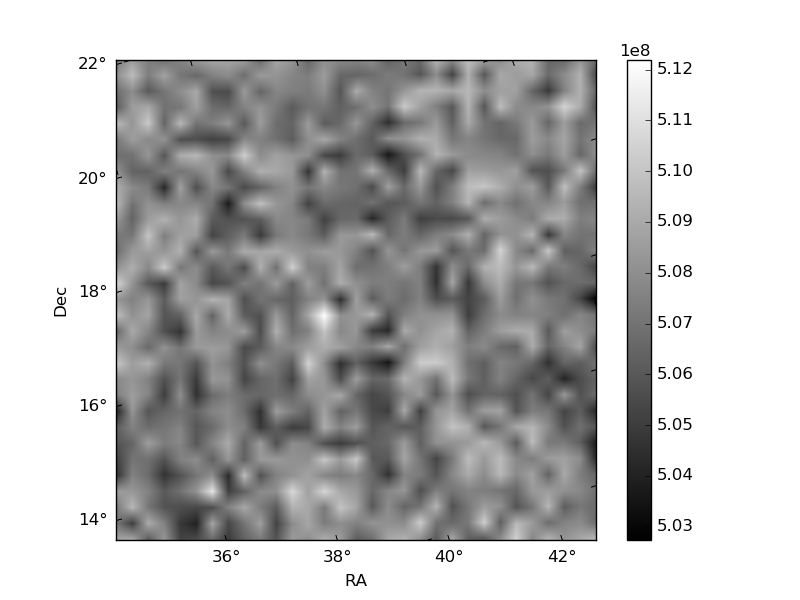
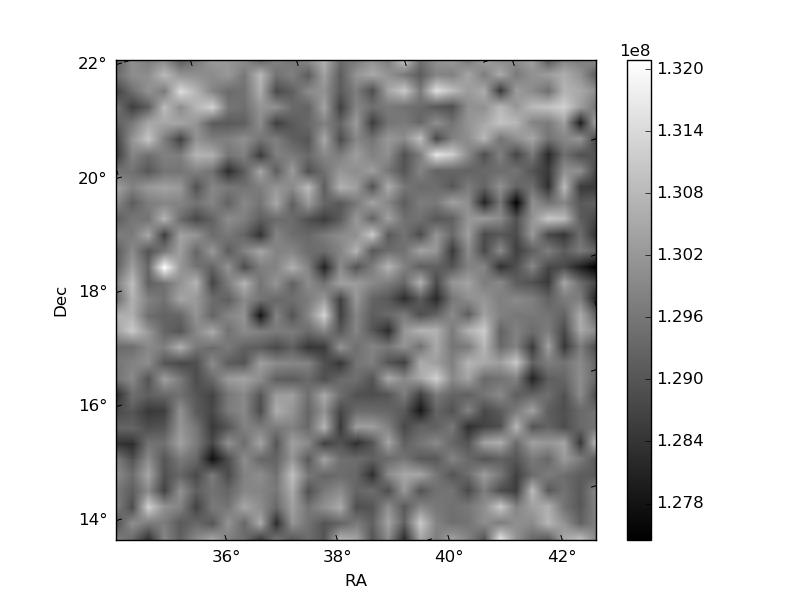
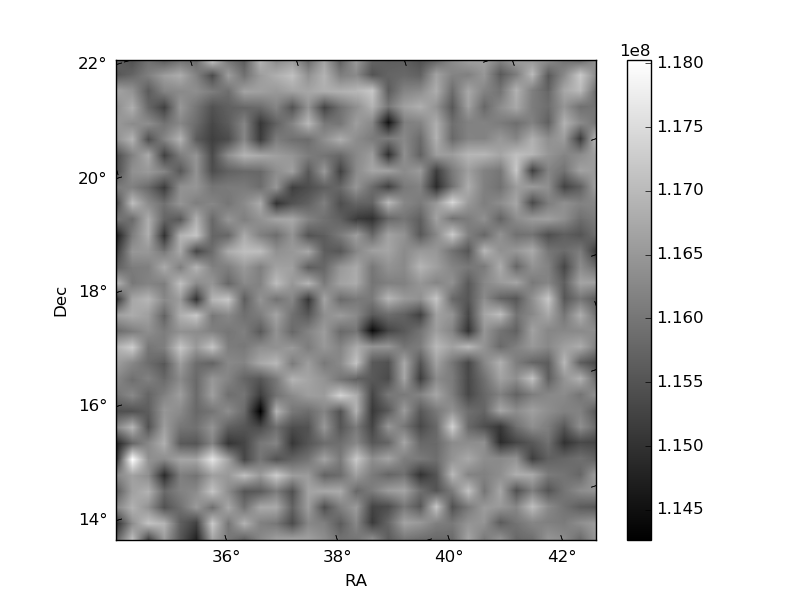
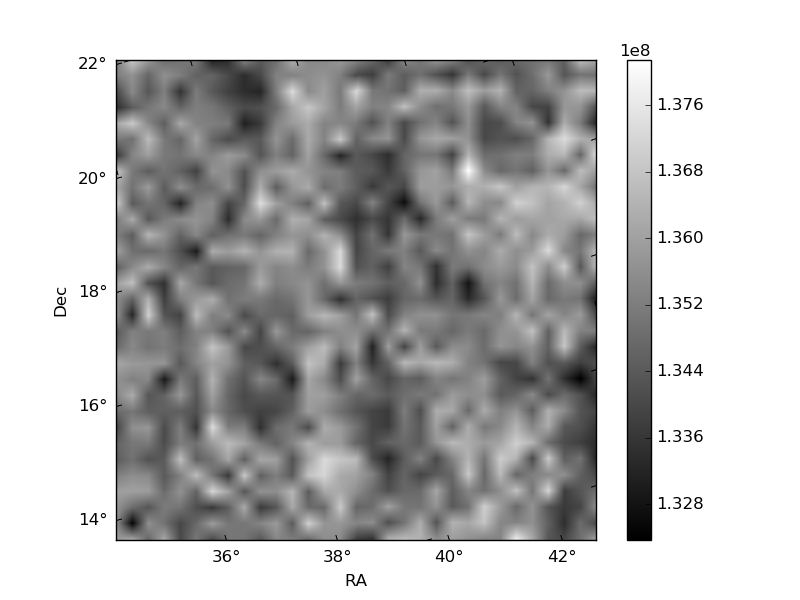
Histogram calculated using DETX and DETY for each event in the final _common_clean file
| Quadrant A | 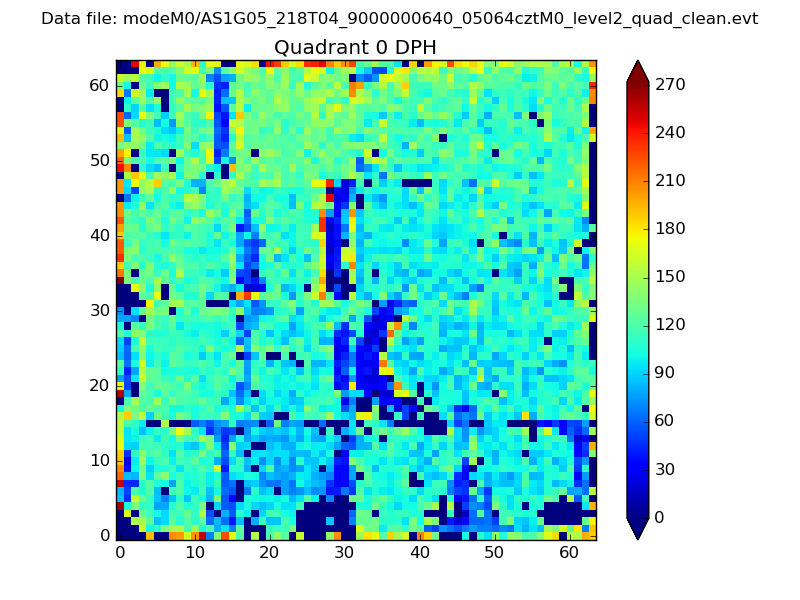 |
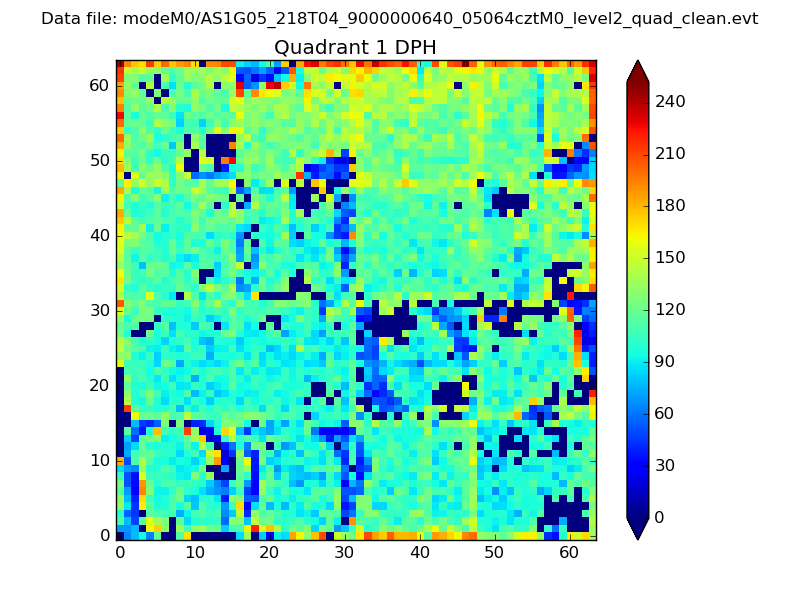 |
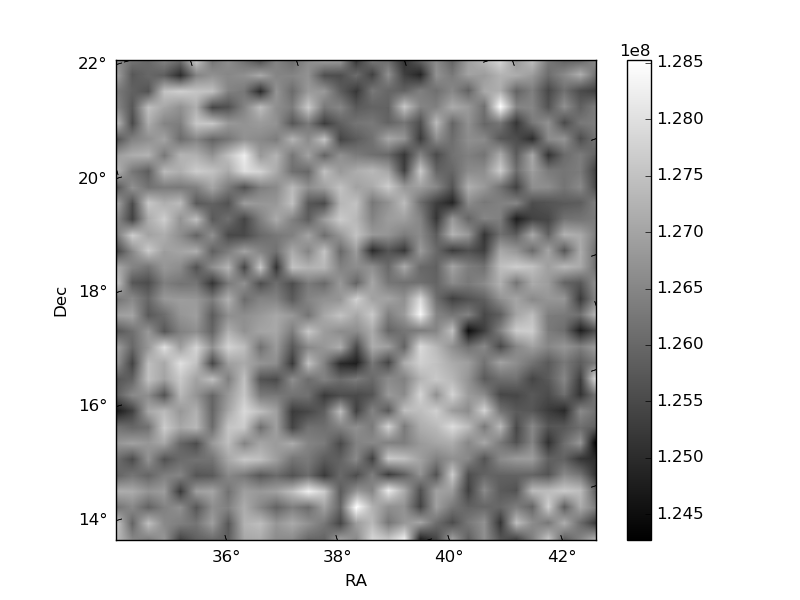
Quadrant B |
|---|---|---|---|
| Quadrant D | 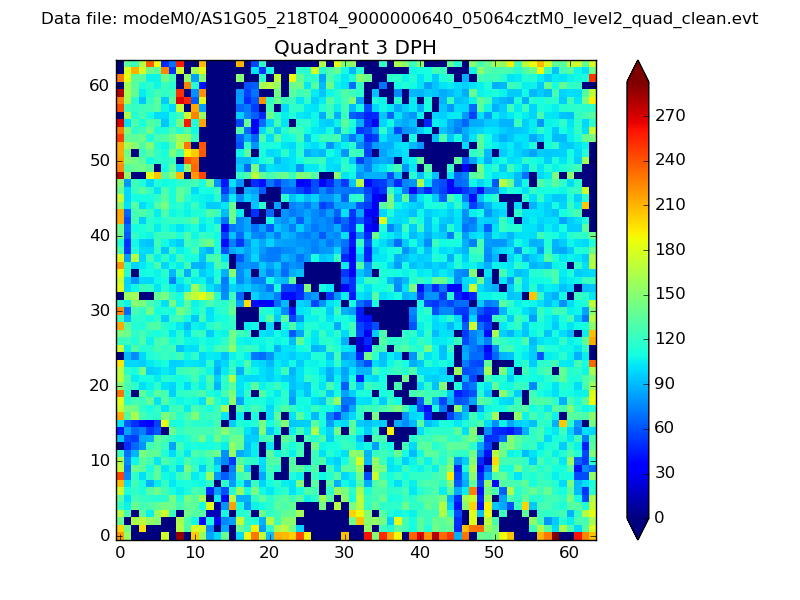 |
 |
Quadrant C |
| Plot type | Count rate plots | Images |
|---|---|---|
| Comparison with Poisson distribution Blue bars denote a histogram of data divided into 1 sec bins. Red curve is a Poisson curve with rate = median count rate of data. |
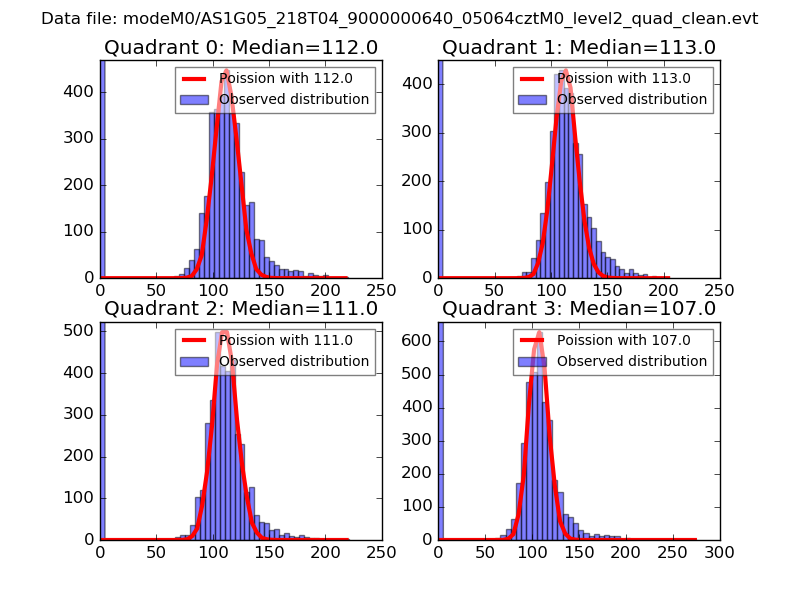 |
 |
| Quadrant-wise count rates Data is divided into 100 sec bins |
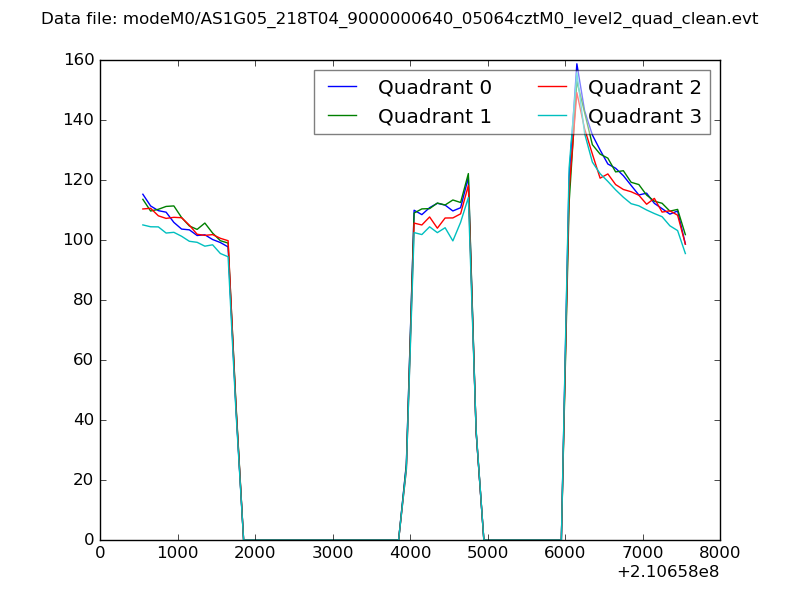 |
|
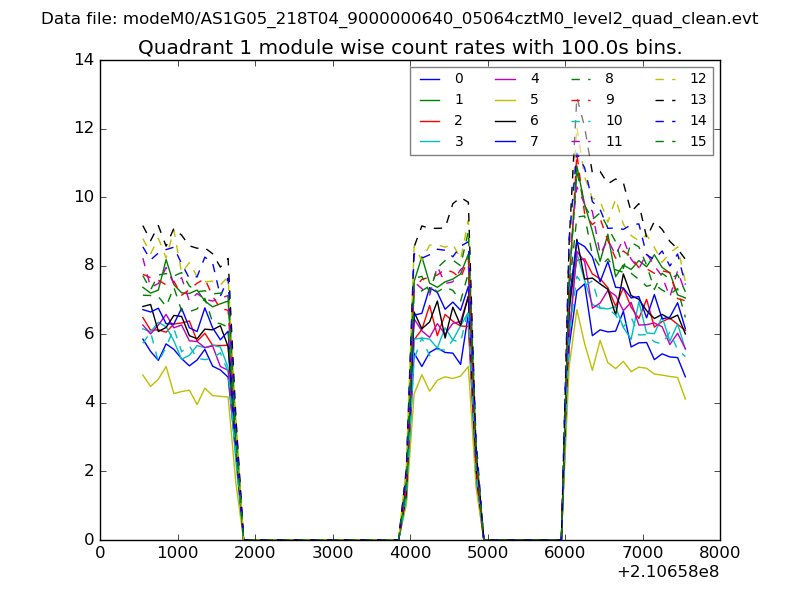
| Module-wise count rates for Quadrant A Data is divided into 100 sec bins |
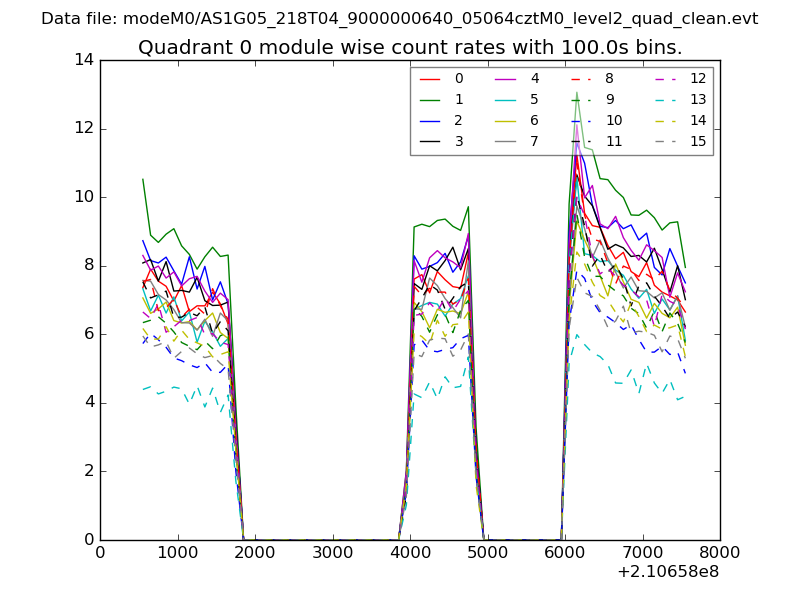 |
 |
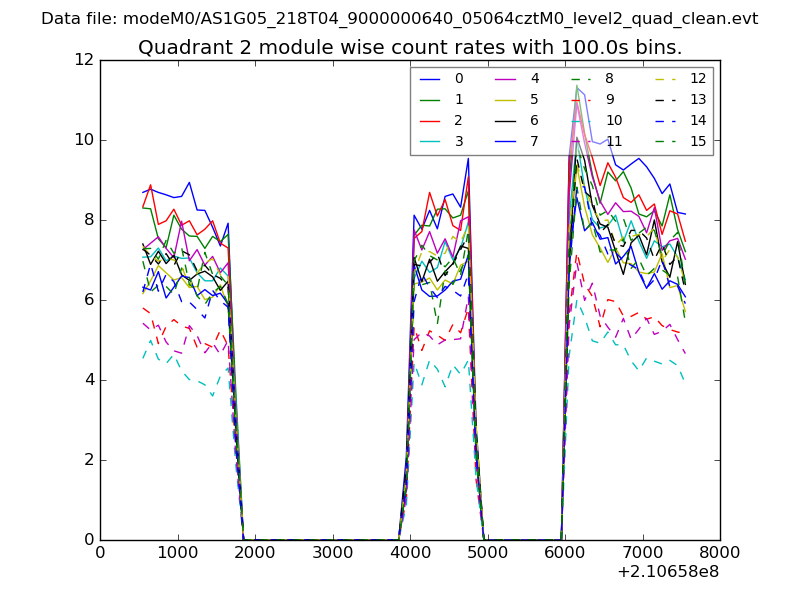
| Module-wise count rates for Quadrant B Data is divided into 100 sec bins |
 |
 |
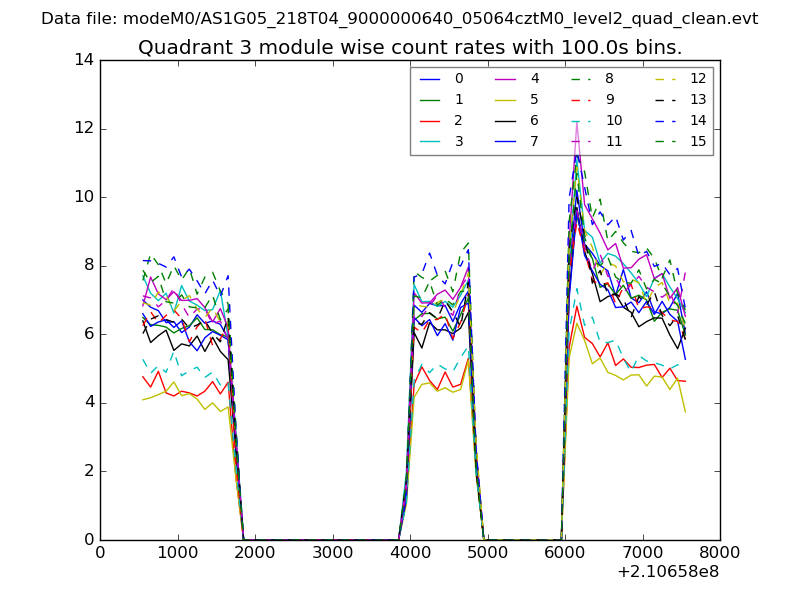
| Module-wise count rates for Quadrant C Data is divided into 100 sec bins |
 |
 |
| Module-wise count rates for Quadrant D Data is divided into 100 sec bins |
 |
 |
| Parameter | Plot |
|---|---|
| CZT HV Monitor | 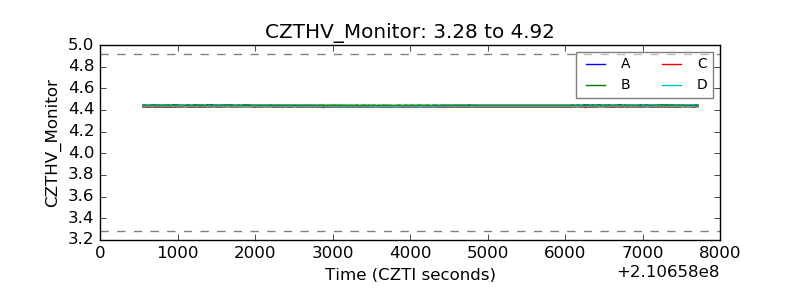 |
| D_VDD | 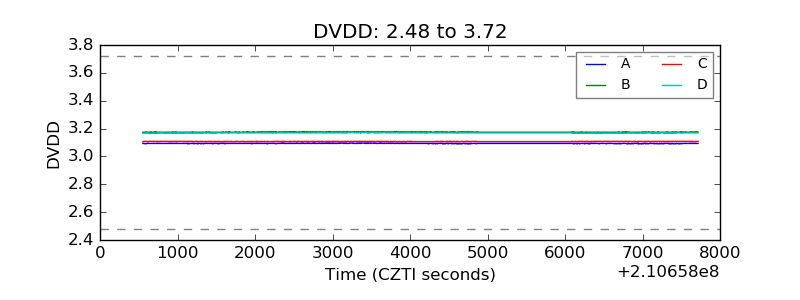 |
| Temperature 1 | 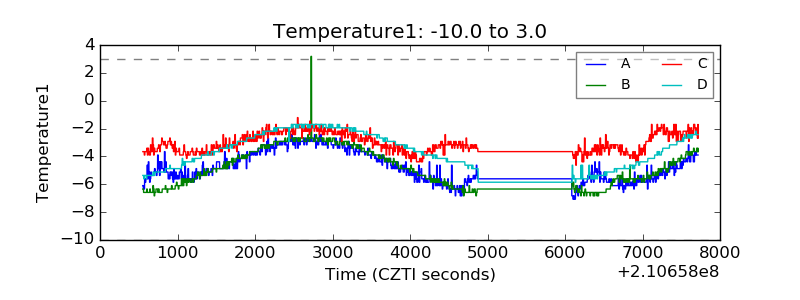 |
| Veto HV Monitor | 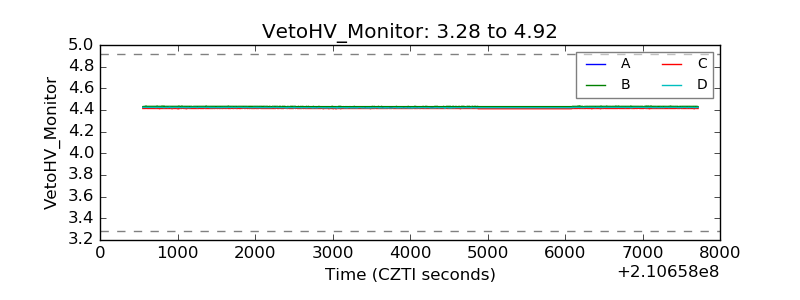 |
| Veto LLD | 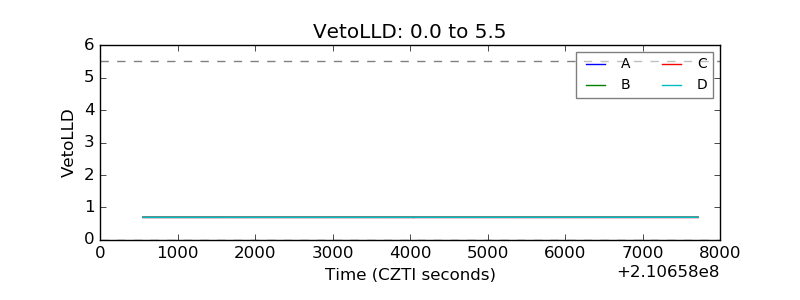 |
| Alpha Counter | 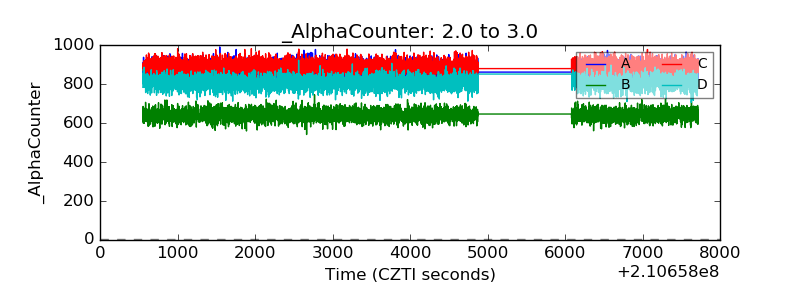 |
| _CPM_Rate | 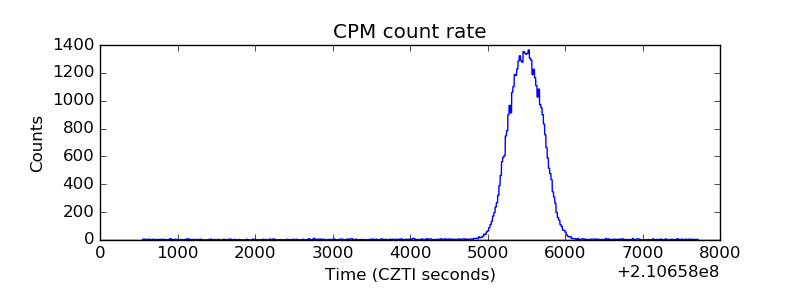 |
| CZT Counter | 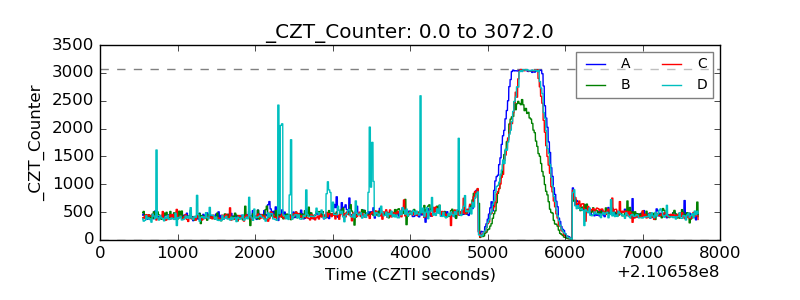 |
| +2.5 Volts monitor |  |
| +5 Volts monitor |  |
| _ROLL_ROT | 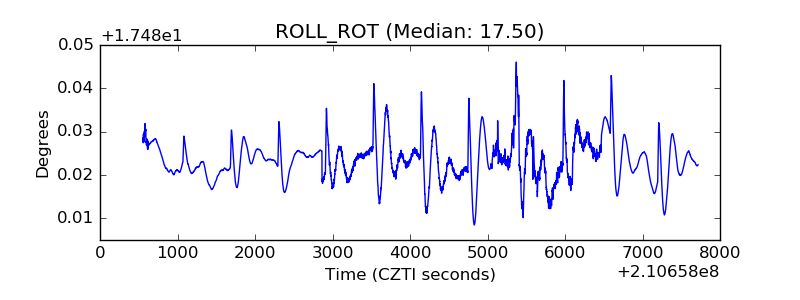 |
| _Roll_DEC | 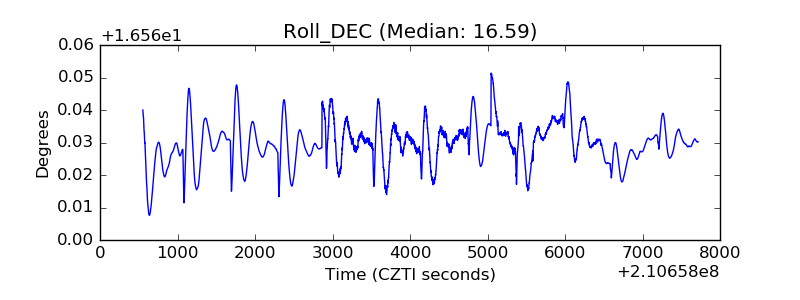 |
| _Roll_RA | 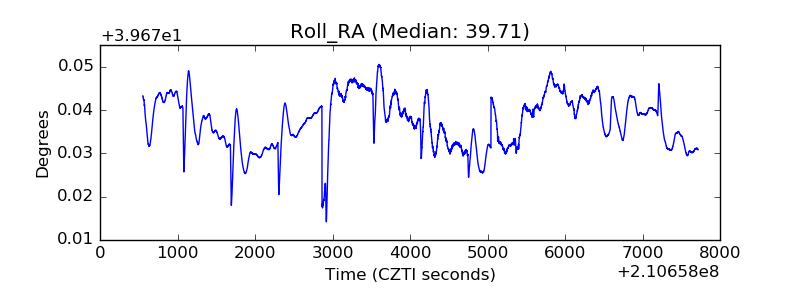 |
| Veto Counter | 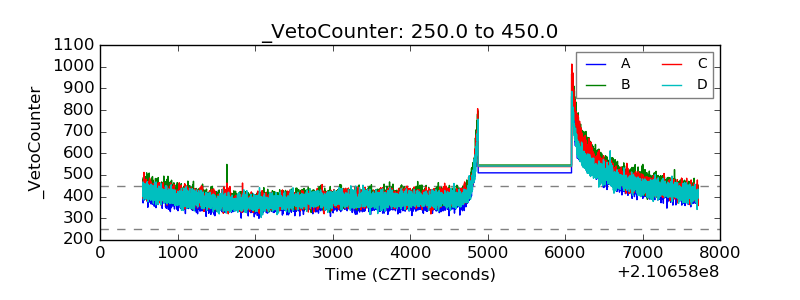 |