| Param | Original file | Final file |
|---|---|---|
| Filename | modeM0/AS1G05_218T04_9000000640_05066cztM0_level2.evt | modeM0/AS1G05_218T04_9000000640_05066cztM0_level2_quad_clean.evt |
| Size (bytes) | 1,657,140,480 | 239,791,680 |
| Size | 1.5 GB | 228.7 MB |
| Events in quadrant A | 10,743,078 | 1,468,661 |
| Events in quadrant B | 11,203,414 | 1,472,159 |
| Events in quadrant C | 11,823,919 | 1,442,941 |
| Events in quadrant D | 14,845,723 | 1,278,366 |
| Mode SS | |||
|---|---|---|---|
| Quadrant | BADHDUFLAG | Total packets | Discarded packets |
| A | 0 | 474 | 0 |
| B | 0 | 474 | 0 |
| C | 0 | 474 | 0 |
| D | 0 | 474 | 0 |
| Mode M9 | |||
|---|---|---|---|
| Quadrant | BADHDUFLAG | Total packets | Discarded packets |
| A | 0 | 32 | 0 |
| B | 0 | 32 | 0 |
| C | 0 | 32 | 0 |
| D | 0 | 32 | 0 |
| Mode M0 | |||
|---|---|---|---|
| Quadrant | BADHDUFLAG | Total packets | Discarded packets |
| A | 0 | 48116 | 5 |
| B | 0 | 48815 | 4 |
| C | 0 | 50547 | 4 |
| D | 0 | 61089 | 7 |
| Quadrant | Total seconds | Saturated seconds | Saturation percentage |
|---|---|---|---|
| A | 23237 | 203 | 0.873607% |
| B | 23237 | 218 | 0.938159% |
| C | 23237 | 192 | 0.826268% |
| D | 23236 | 1746 | 7.514202% |
Noise dominated data is calculated using 1-second bins in cleaned event files. If a bin has >2000 counts, and if more than 50% of those come from <1% of pixels, then it is considered to be noise-dominated and hence unusable.
| Quadrant | # 1 sec bins | Bins with >0 counts | Bins with >2000 counts | High rate bins dominated by noise | Noise dominated (total time) | Noise dominated (detector-on time) | Marked lightcurve |
|---|---|---|---|---|---|---|---|
| A | 51288 | 23242 | 11 | 11 | 0.02% | 0.05% | 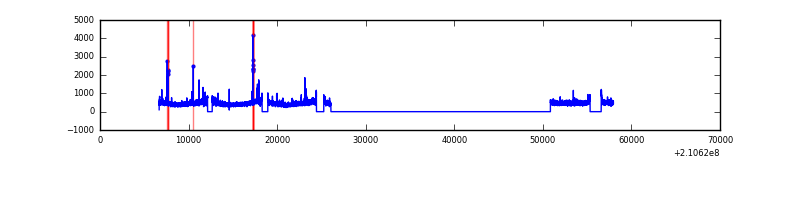 |
| B | 51288 | 23242 | 5 | 5 | 0.01% | 0.02% | 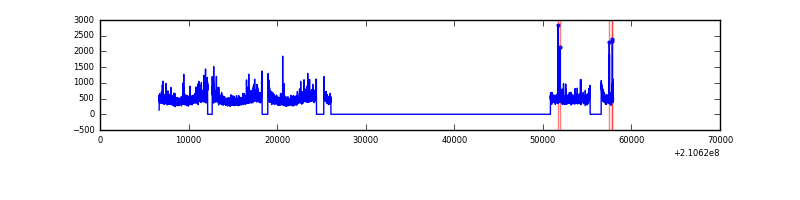 |
| C | 51288 | 23242 | 0 | 0 | 0.00% | 0.00% | 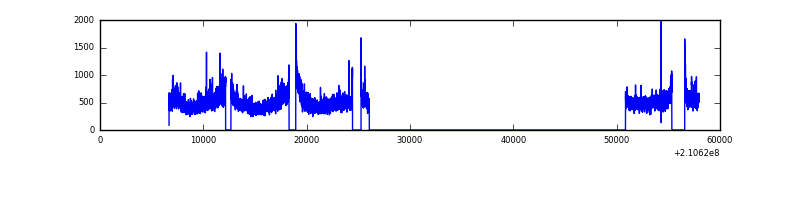 |
| D | 51288 | 23241 | 1326 | 1326 | 2.59% | 5.71% | 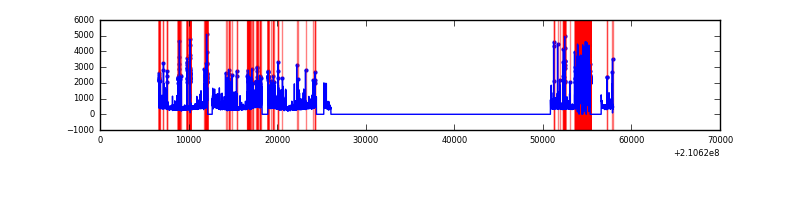 |
Top three noisy pixels from each quadrant. If the there are fewer than three noisy pixels in the level2.evt file, extra rows are filled as -1
| Pixel properties | Quadrant properties | ||||||
|---|---|---|---|---|---|---|---|
| Quadrant | DetID | PixID | Counts | Sigma | Mean | Median | Sigma |
| A | 13 | 251 | 165255 | 294.51 | 2716 | 2661 | 552.1 |
| A | 0 | 50 | 85191 | 149.49 | 2716 | 2661 | 552.1 |
| A | 15 | 174 | 47476 | 81.17 | 2716 | 2661 | 552.1 |
| B | 15 | 204 | 310136 | 590.11 | 2728 | 2668 | 521.0 |
| B | 0 | 219 | 137097 | 258.0 | 2728 | 2668 | 521.0 |
| B | 4 | 48 | 88759 | 165.23 | 2728 | 2668 | 521.0 |
| C | 1 | 16 | 1563072 | 2591.74 | 2612 | 2623 | 602.1 |
| C | 14 | 67 | 29853 | 45.23 | 2612 | 2623 | 602.1 |
| C | 13 | 61 | 21386 | 31.16 | 2612 | 2623 | 602.1 |
| D | 13 | 235 | 4108573 | 6754.35 | 2486 | 2413 | 607.9 |
| D | 13 | 239 | 476564 | 779.94 | 2486 | 2413 | 607.9 |
| D | 2 | 33 | 275120 | 448.58 | 2486 | 2413 | 607.9 |
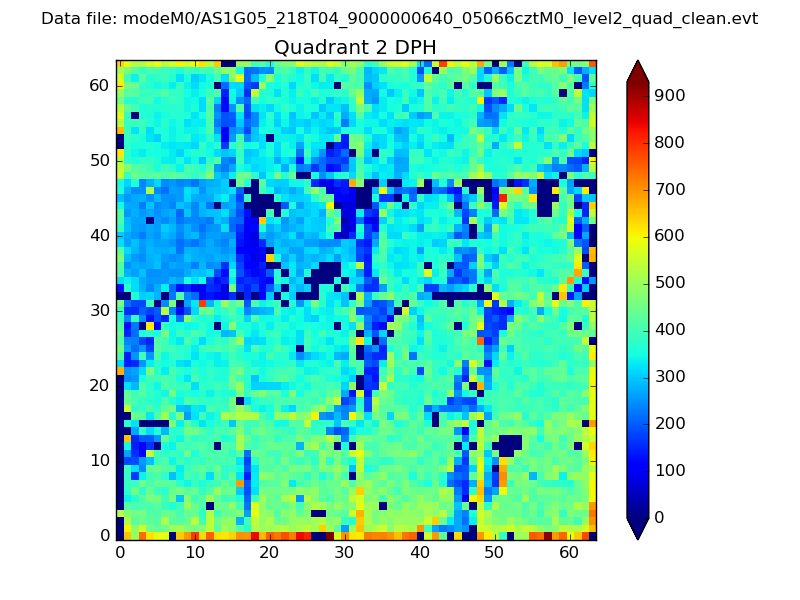
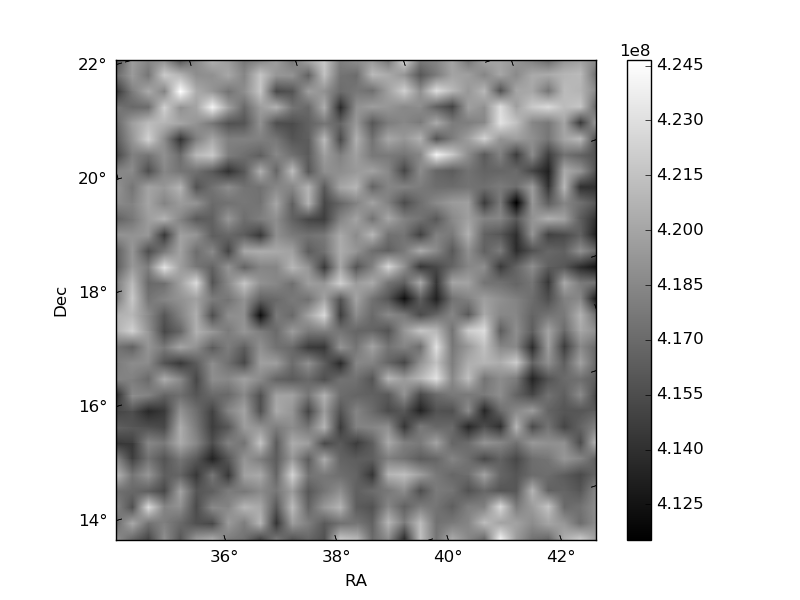
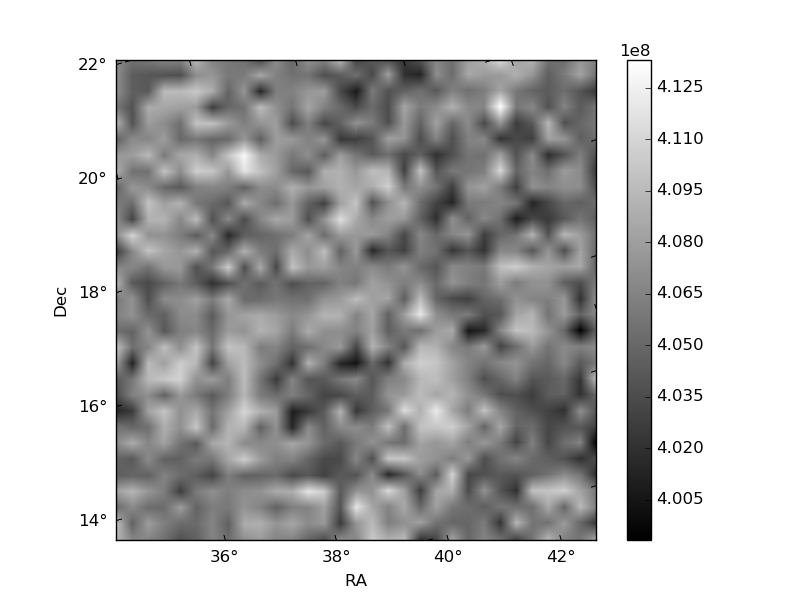
Histogram calculated using DETX and DETY for each event in the final _common_clean file
| Quadrant A | 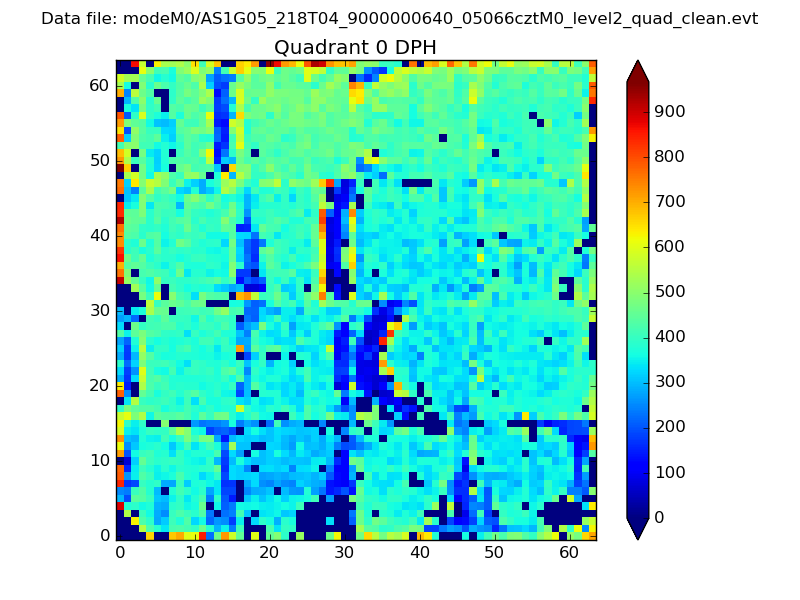 |
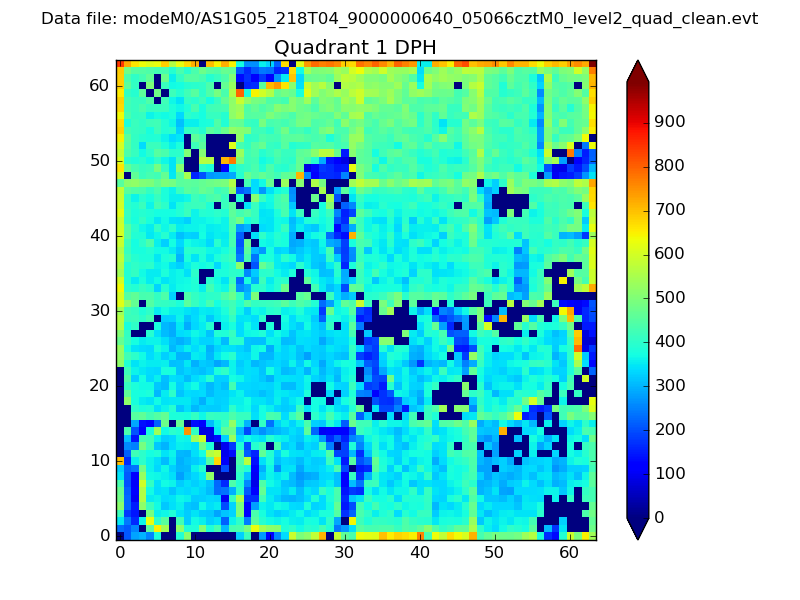 |
Quadrant B |
|---|---|---|---|
| Quadrant D | 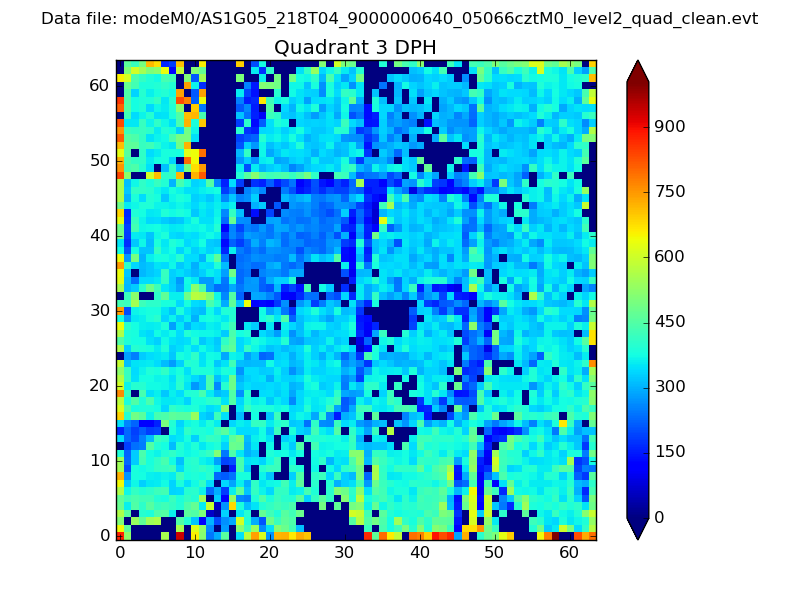 |
 |
Quadrant C |
| Plot type | Count rate plots | Images |
|---|---|---|
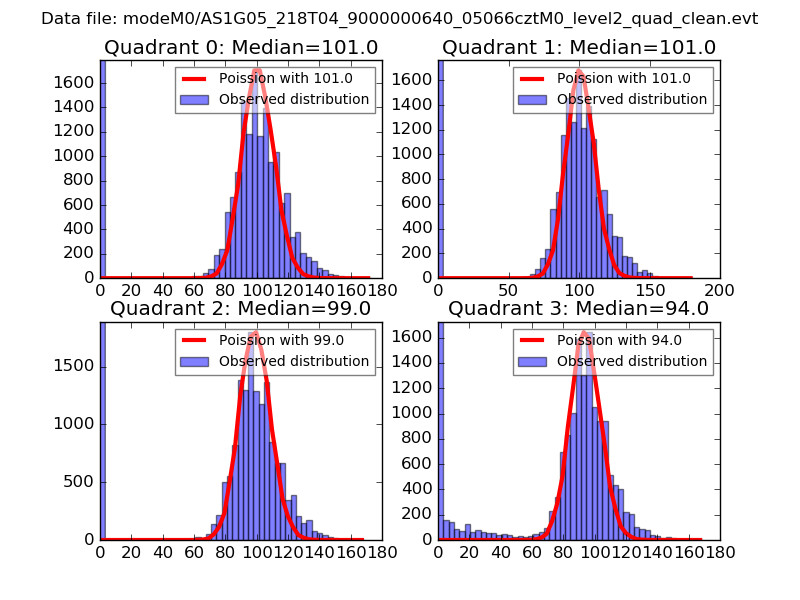
| Comparison with Poisson distribution Blue bars denote a histogram of data divided into 1 sec bins. Red curve is a Poisson curve with rate = median count rate of data. |
 |
 |
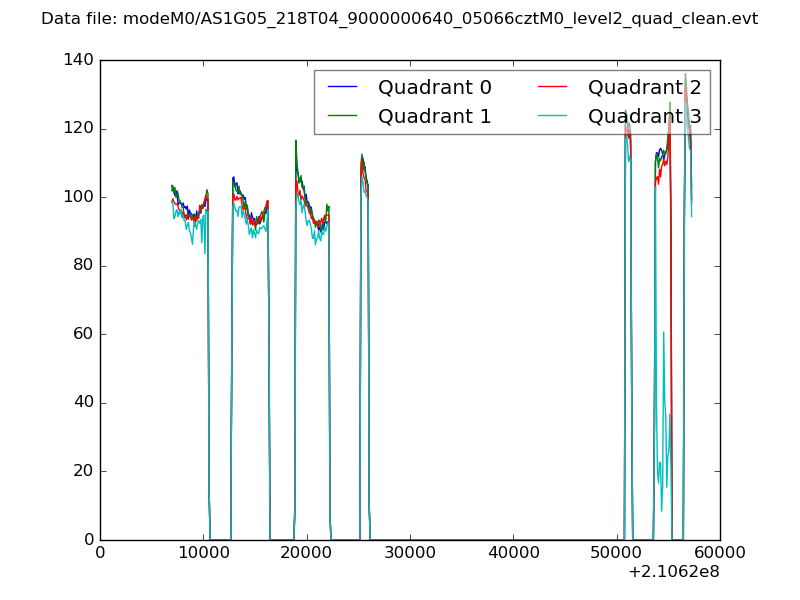
| Quadrant-wise count rates Data is divided into 100 sec bins |
 |
|
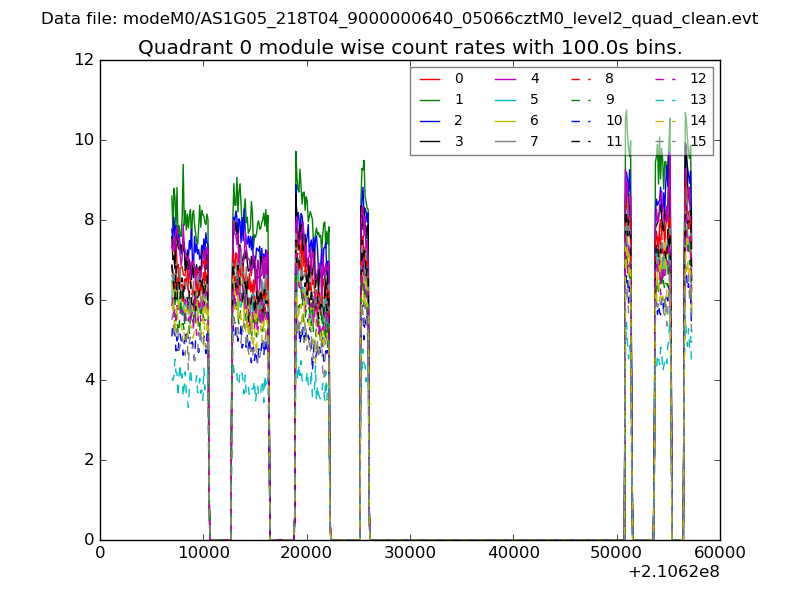
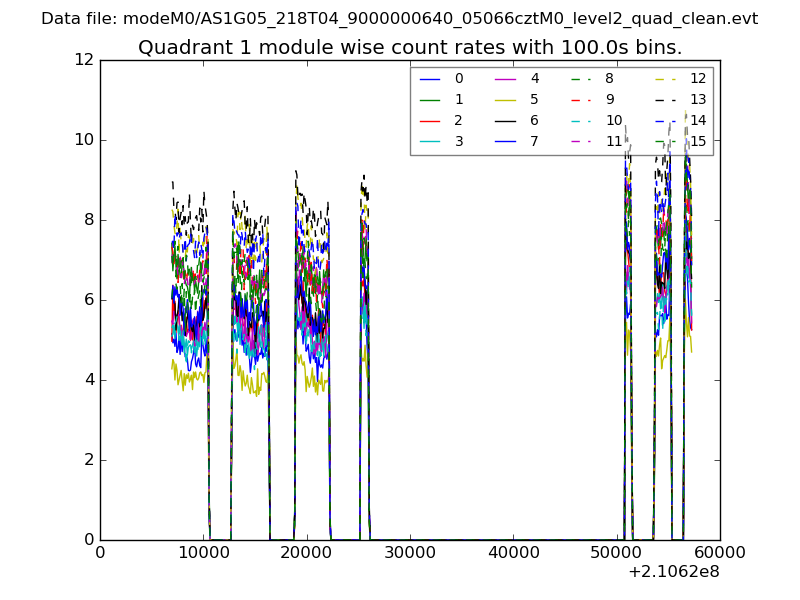
| Module-wise count rates for Quadrant A Data is divided into 100 sec bins |
 |
 |
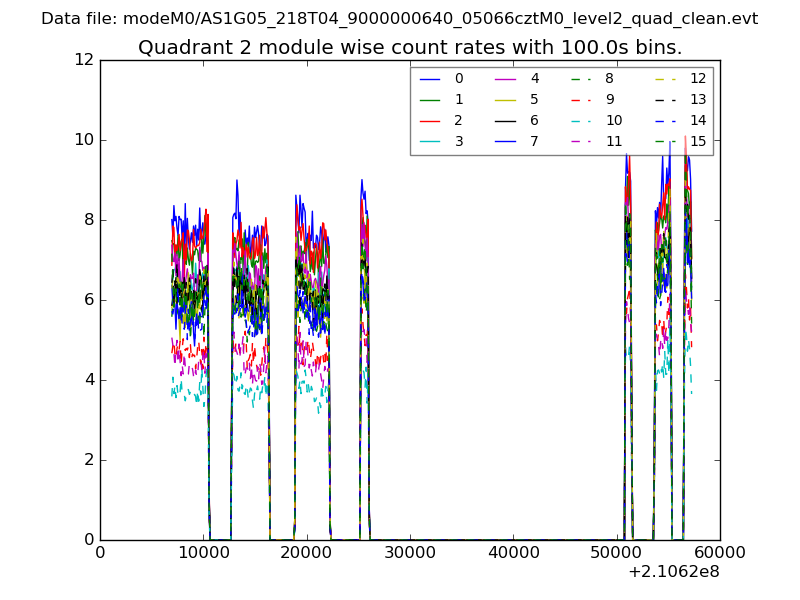
| Module-wise count rates for Quadrant B Data is divided into 100 sec bins |
 |
 |
| Module-wise count rates for Quadrant C Data is divided into 100 sec bins |
 |
 |
| Module-wise count rates for Quadrant D Data is divided into 100 sec bins |
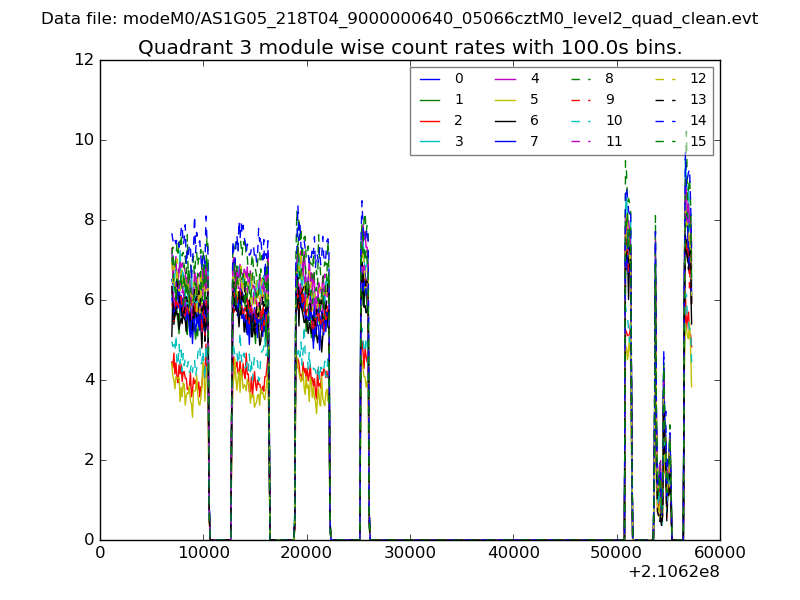 |
 |
| Parameter | Plot |
|---|---|
| CZT HV Monitor | 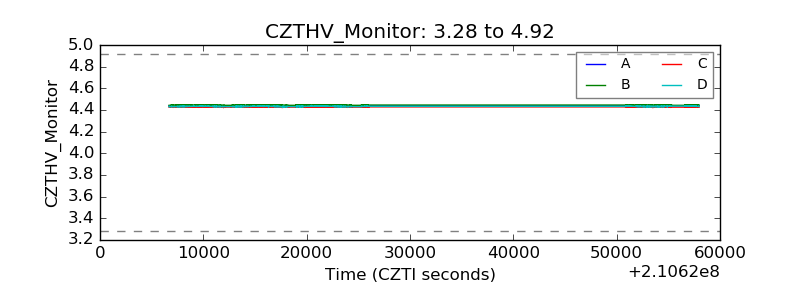 |
| D_VDD | 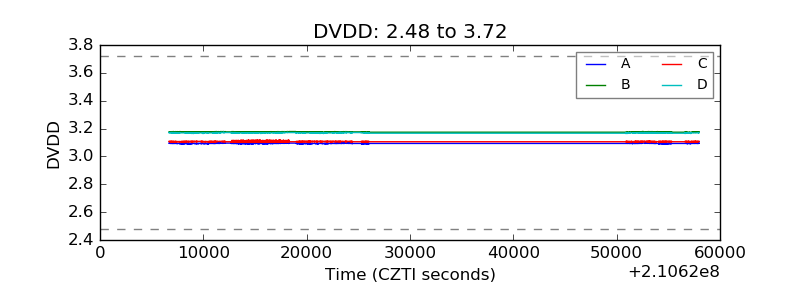 |
| Temperature 1 | 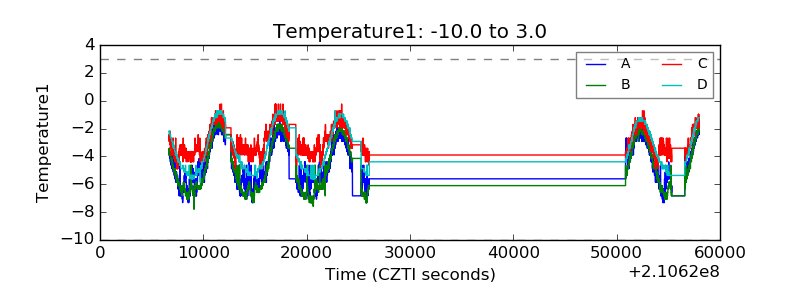 |
| Veto HV Monitor | 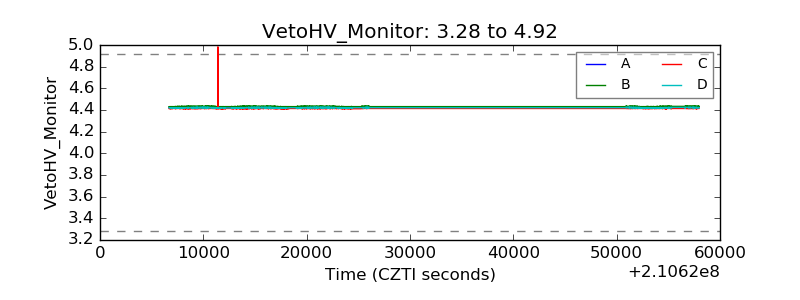 |
| Veto LLD | 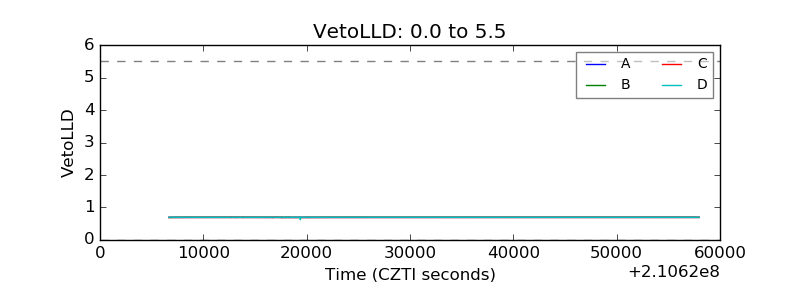 |
| Alpha Counter | 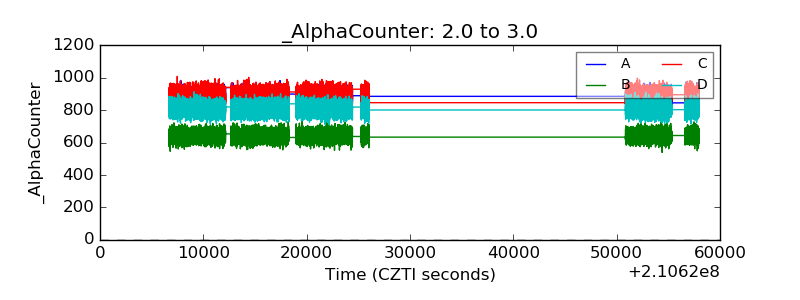 |
| _CPM_Rate | 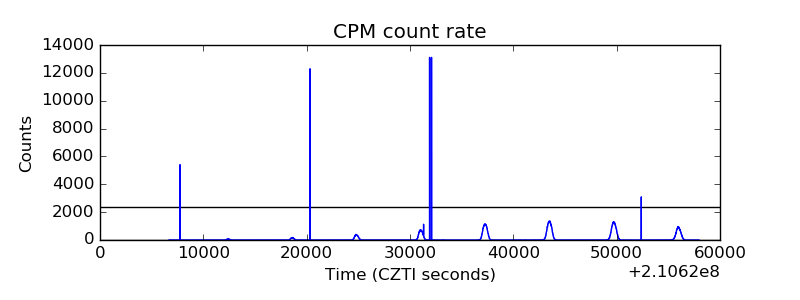 |
| CZT Counter | 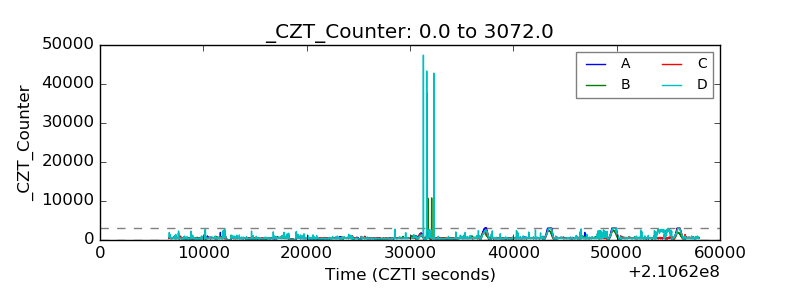 |
| +2.5 Volts monitor |  |
| +5 Volts monitor |  |
| _ROLL_ROT | 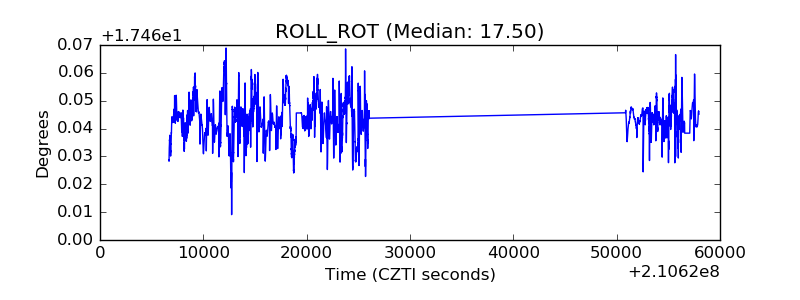 |
| _Roll_DEC | 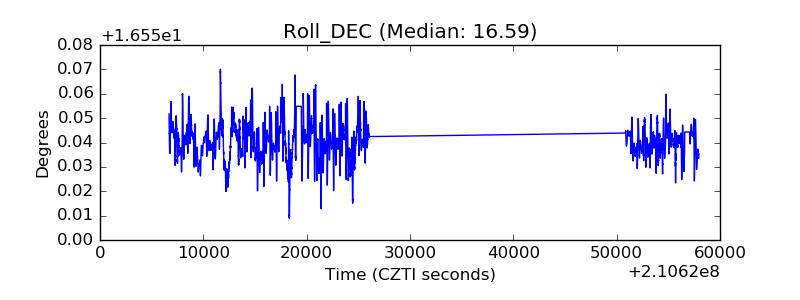 |
| _Roll_RA | 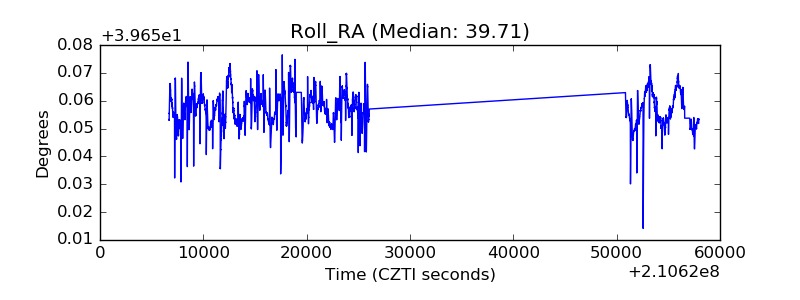 |
| Veto Counter | 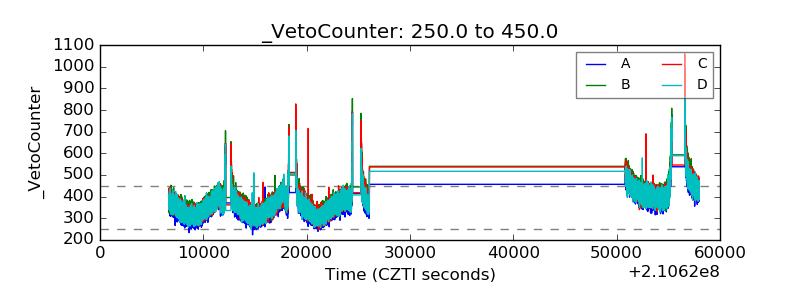 |