| Param | Original file | Final file |
|---|---|---|
| Filename | modeM0/AS1G05_218T04_9000000640_05067cztM0_level2.evt | modeM0/AS1G05_218T04_9000000640_05067cztM0_level2_quad_clean.evt |
| Size (bytes) | 493,047,360 | 64,065,600 |
| Size | 470.2 MB | 61.1 MB |
| Events in quadrant A | 3,362,452 | 372,940 |
| Events in quadrant B | 3,380,402 | 377,597 |
| Events in quadrant C | 3,923,163 | 364,856 |
| Events in quadrant D | 3,808,535 | 354,580 |
| Mode SS | |||
|---|---|---|---|
| Quadrant | BADHDUFLAG | Total packets | Discarded packets |
| A | 0 | 138 | 0 |
| B | 0 | 138 | 0 |
| C | 0 | 138 | 0 |
| D | 0 | 138 | 0 |
| Mode M9 | |||
|---|---|---|---|
| Quadrant | BADHDUFLAG | Total packets | Discarded packets |
| A | 0 | 15 | 0 |
| B | 0 | 15 | 0 |
| C | 0 | 15 | 0 |
| D | 0 | 16 | 0 |
| Mode M0 | |||
|---|---|---|---|
| Quadrant | BADHDUFLAG | Total packets | Discarded packets |
| A | 0 | 14181 | 3 |
| B | 0 | 14188 | 2 |
| C | 0 | 15787 | 2 |
| D | 0 | 15798 | 2 |
| Quadrant | Total seconds | Saturated seconds | Saturation percentage |
|---|---|---|---|
| A | 6730 | 188 | 2.793462% |
| B | 6730 | 164 | 2.436850% |
| C | 6730 | 145 | 2.154532% |
| D | 6730 | 250 | 3.714710% |
Noise dominated data is calculated using 1-second bins in cleaned event files. If a bin has >2000 counts, and if more than 50% of those come from <1% of pixels, then it is considered to be noise-dominated and hence unusable.
| Quadrant | # 1 sec bins | Bins with >0 counts | Bins with >2000 counts | High rate bins dominated by noise | Noise dominated (total time) | Noise dominated (detector-on time) | Marked lightcurve |
|---|---|---|---|---|---|---|---|
| A | 7845 | 6731 | 12 | 12 | 0.15% | 0.18% | 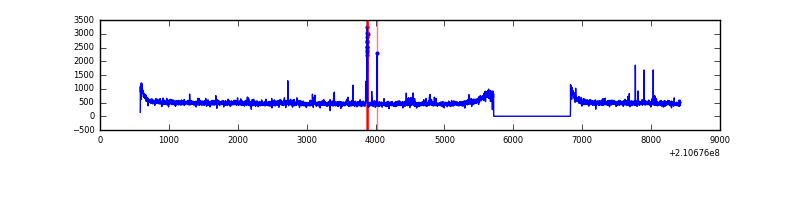 |
| B | 7845 | 6731 | 4 | 4 | 0.05% | 0.06% | 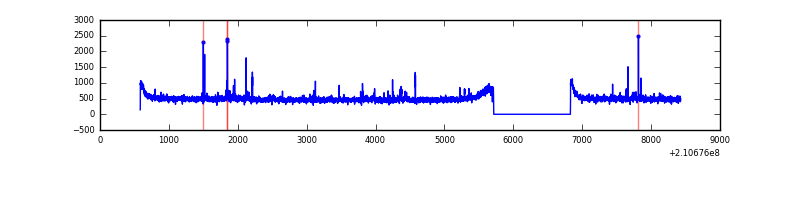 |
| C | 7845 | 6731 | 0 | 0 | 0.00% | 0.00% | 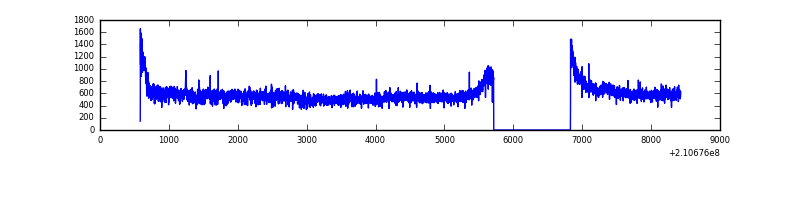 |
| D | 7845 | 6731 | 78 | 78 | 0.99% | 1.16% | 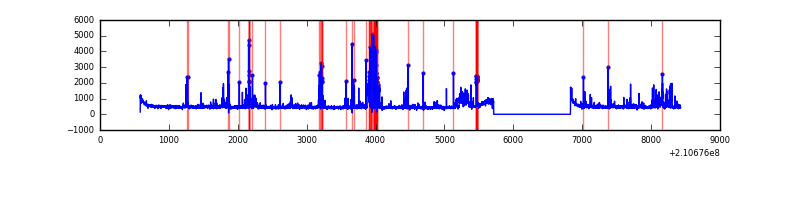 |
Top three noisy pixels from each quadrant. If the there are fewer than three noisy pixels in the level2.evt file, extra rows are filled as -1
| Pixel properties | Quadrant properties | ||||||
|---|---|---|---|---|---|---|---|
| Quadrant | DetID | PixID | Counts | Sigma | Mean | Median | Sigma |
| A | 0 | 50 | 52370 | 296.83 | 842 | 825 | 173.6 |
| A | 13 | 251 | 51444 | 291.5 | 842 | 825 | 173.6 |
| A | 0 | 247 | 15239 | 83.01 | 842 | 825 | 173.6 |
| B | 15 | 54 | 38593 | 233.91 | 841 | 823 | 161.5 |
| B | 0 | 219 | 26326 | 157.94 | 841 | 823 | 161.5 |
| B | 12 | 111 | 14563 | 85.09 | 841 | 823 | 161.5 |
| C | 1 | 16 | 770510 | 4135.66 | 804 | 806 | 186.1 |
| C | 8 | 128 | 7207 | 34.39 | 804 | 806 | 186.1 |
| C | 13 | 61 | 6446 | 30.3 | 804 | 806 | 186.1 |
| D | 13 | 235 | 329048 | 1648.8 | 811 | 786 | 199.1 |
| D | 2 | 136 | 169231 | 846.07 | 811 | 786 | 199.1 |
| D | 13 | 239 | 127432 | 636.12 | 811 | 786 | 199.1 |
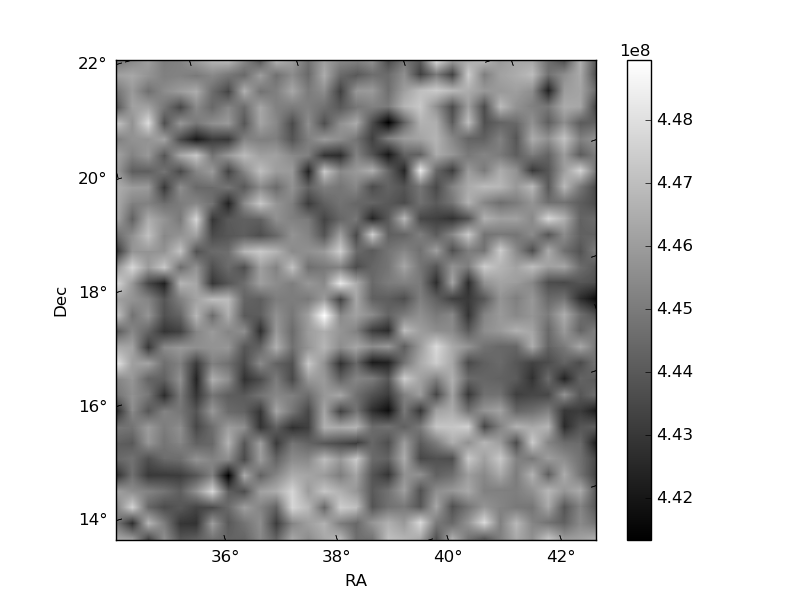
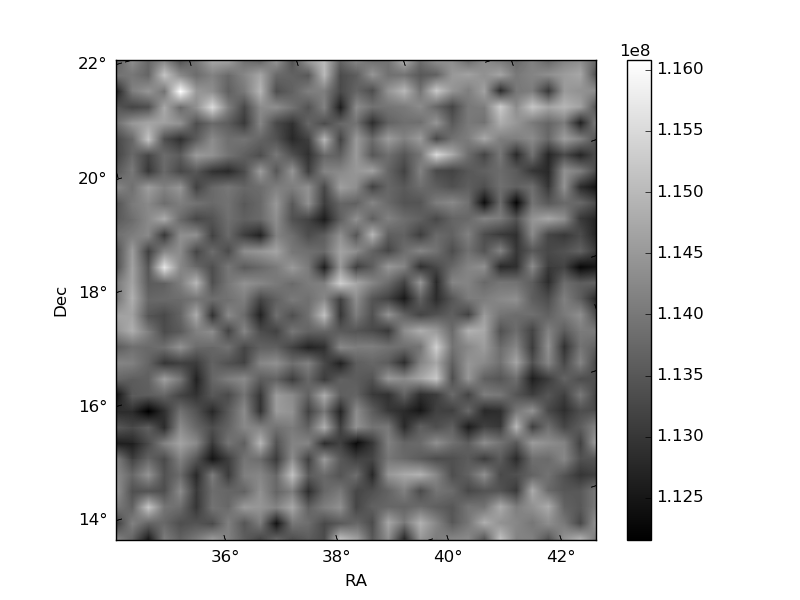
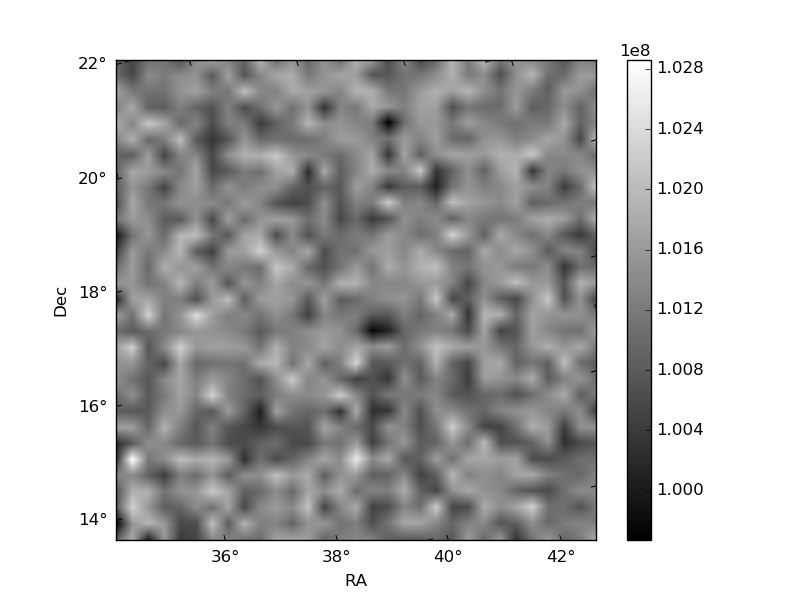
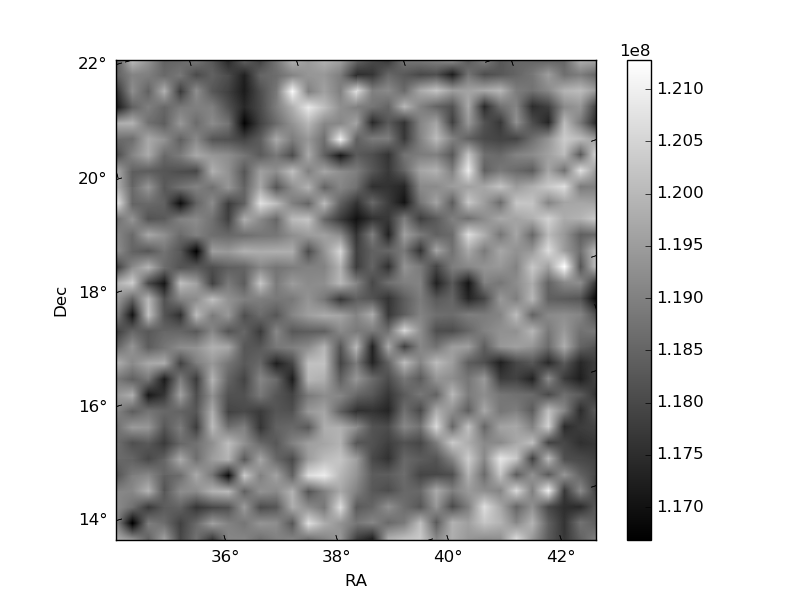
Histogram calculated using DETX and DETY for each event in the final _common_clean file
| Quadrant A | 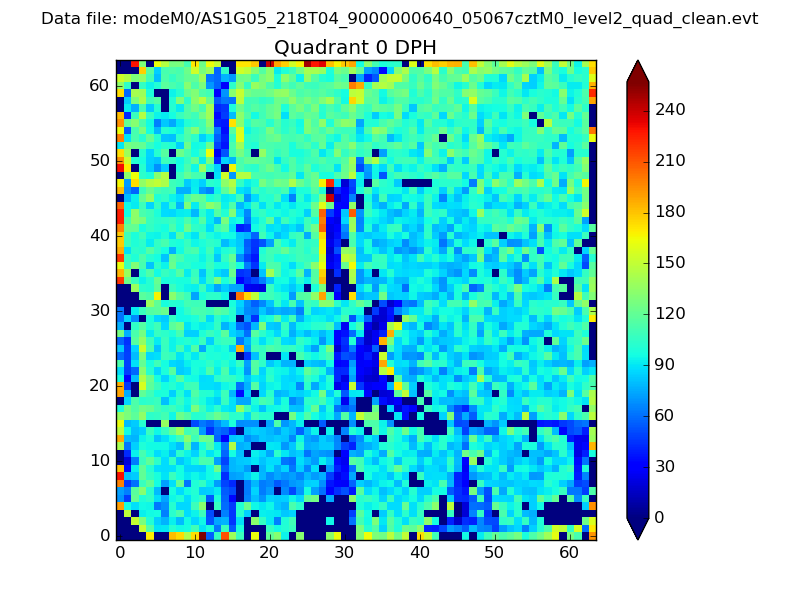 |
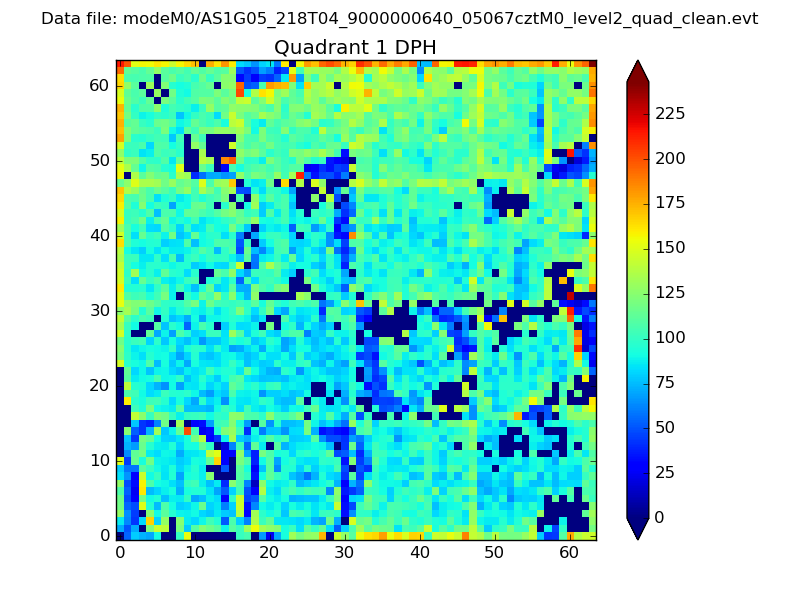 |
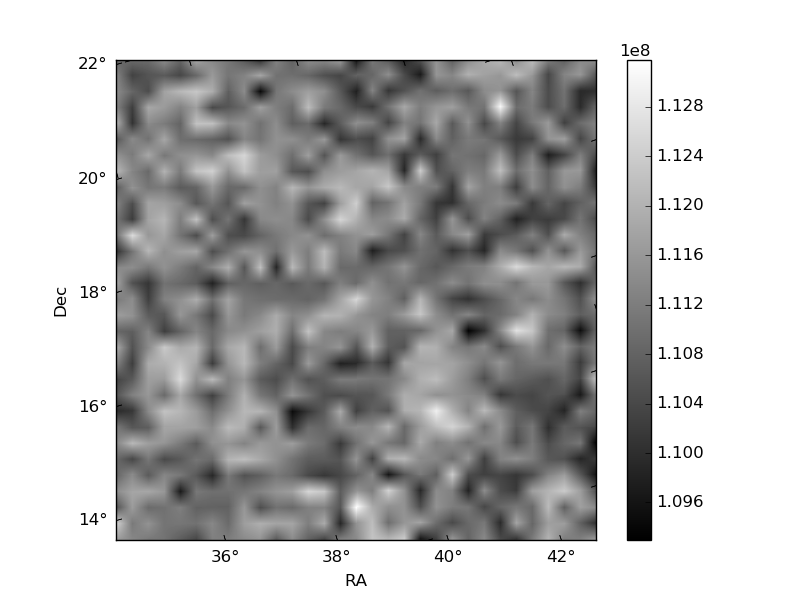
Quadrant B |
|---|---|---|---|
| Quadrant D | 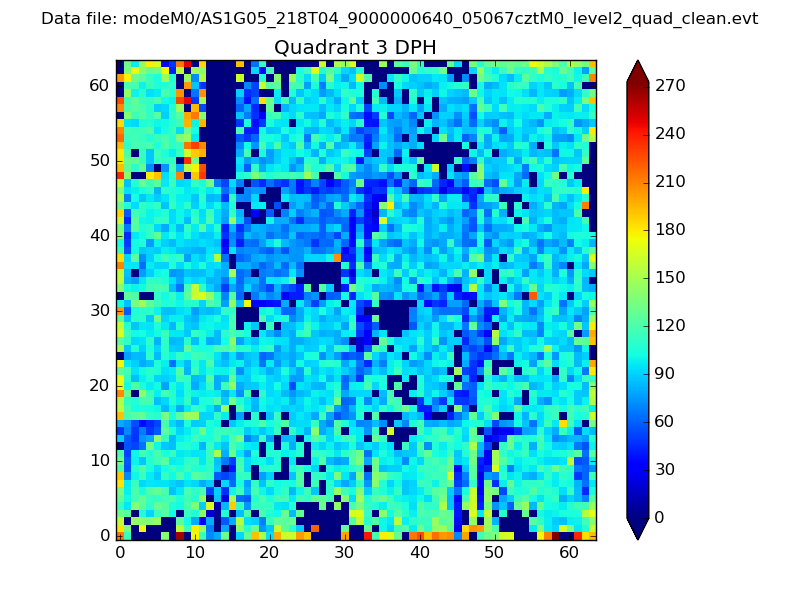 |
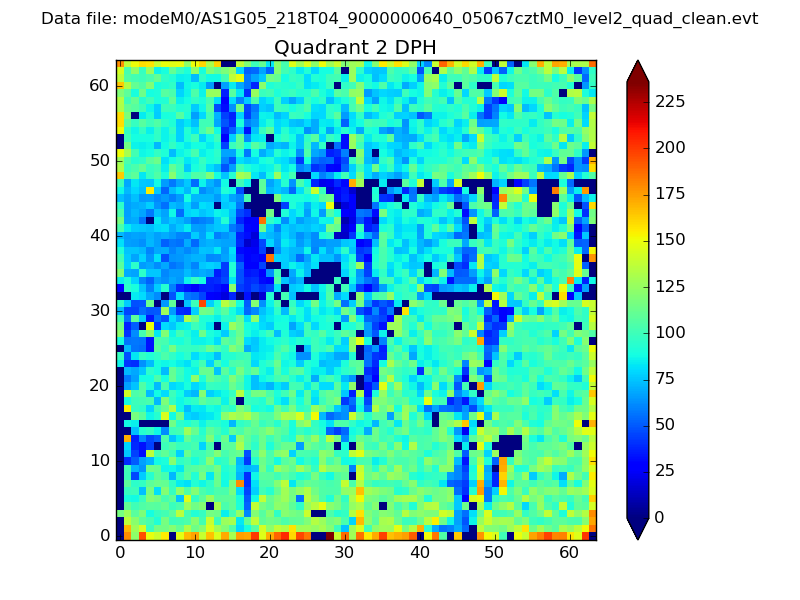 |
Quadrant C |
| Plot type | Count rate plots | Images |
|---|---|---|
| Comparison with Poisson distribution Blue bars denote a histogram of data divided into 1 sec bins. Red curve is a Poisson curve with rate = median count rate of data. |
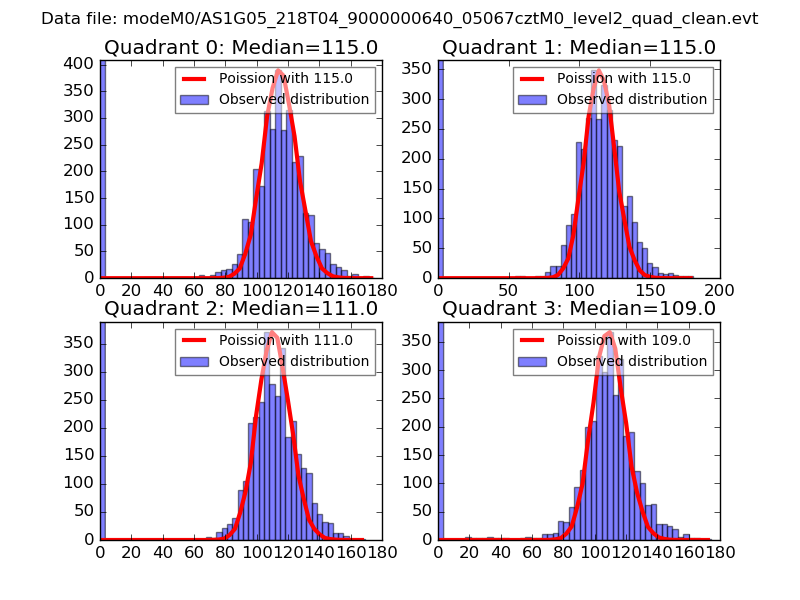 |
 |
| Quadrant-wise count rates Data is divided into 100 sec bins |
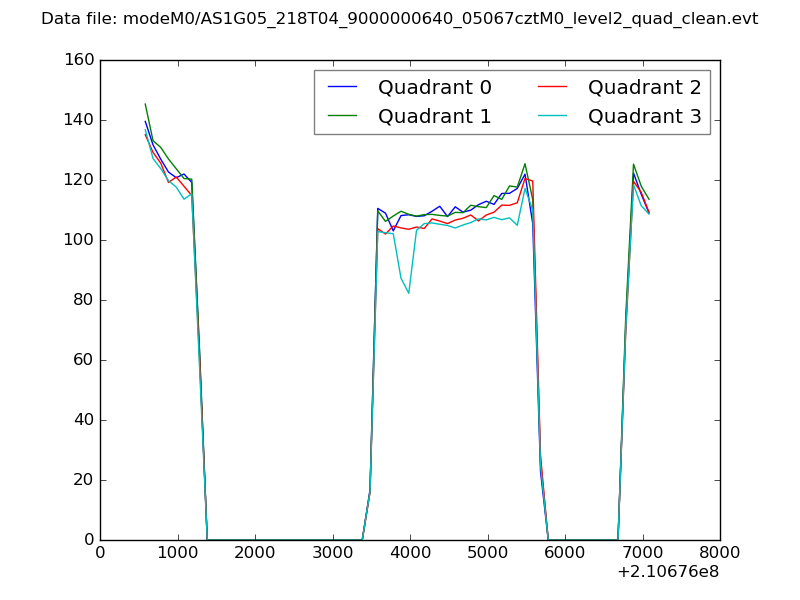 |
|
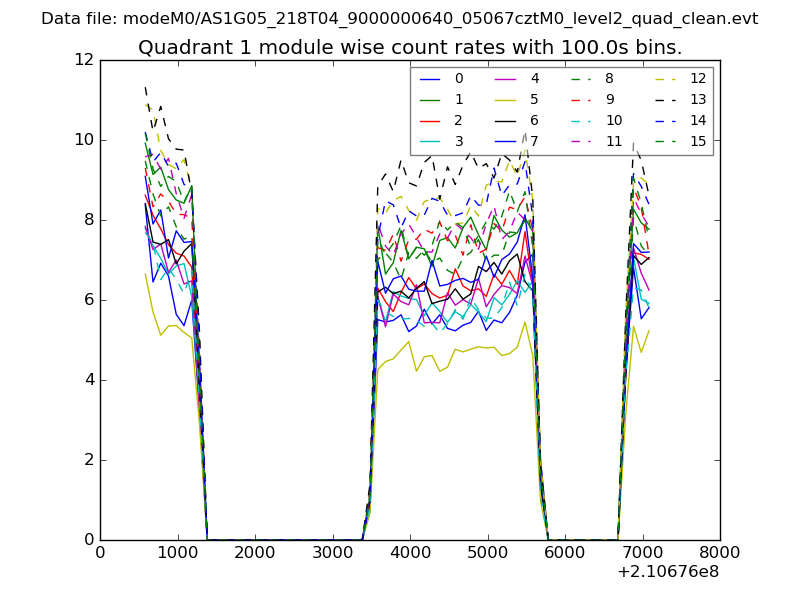
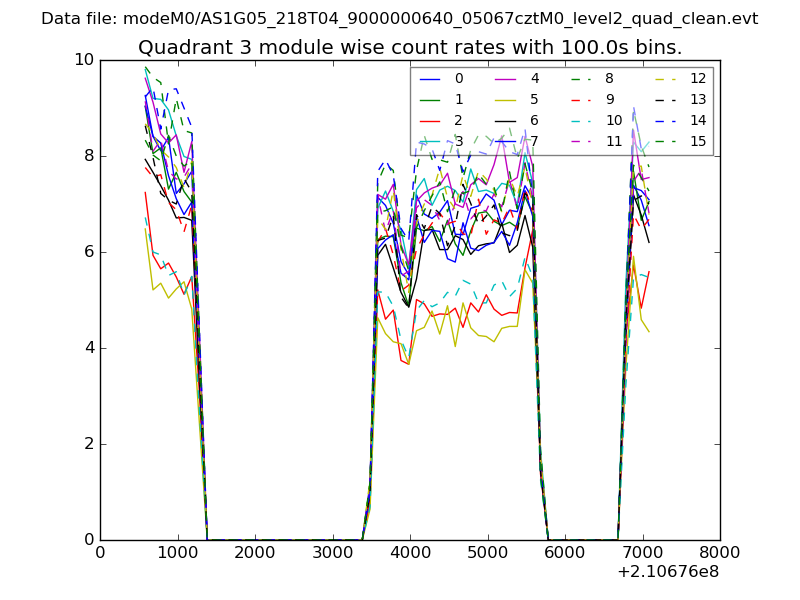
| Module-wise count rates for Quadrant A Data is divided into 100 sec bins |
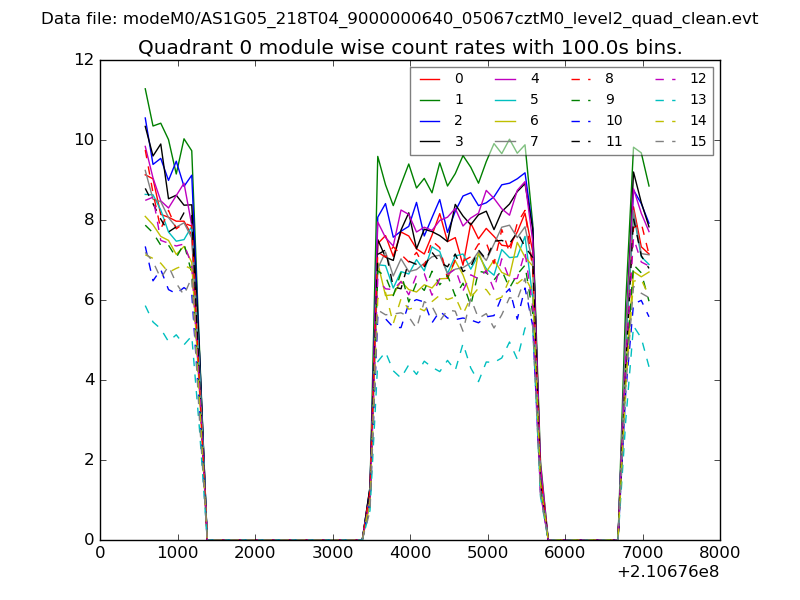 |
 |
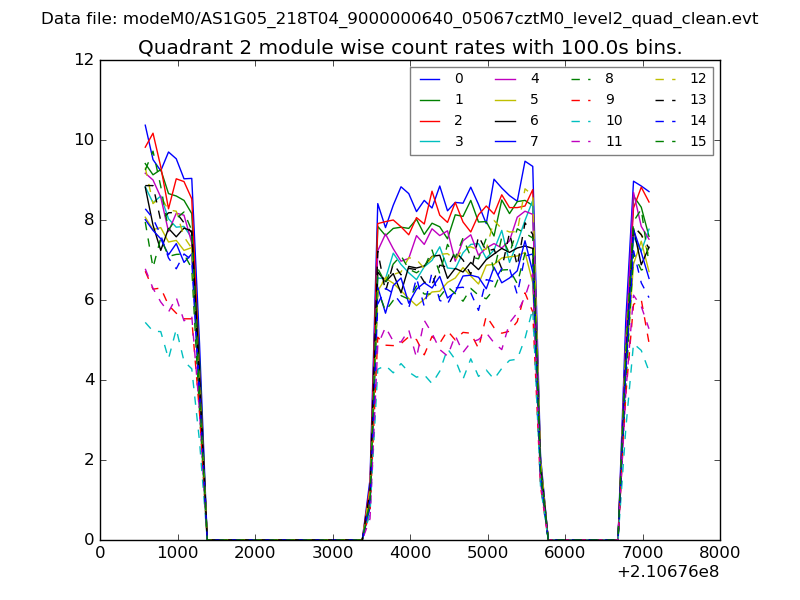
| Module-wise count rates for Quadrant B Data is divided into 100 sec bins |
 |
 |
| Module-wise count rates for Quadrant C Data is divided into 100 sec bins |
 |
 |
| Module-wise count rates for Quadrant D Data is divided into 100 sec bins |
 |
 |
| Parameter | Plot |
|---|---|
| CZT HV Monitor | 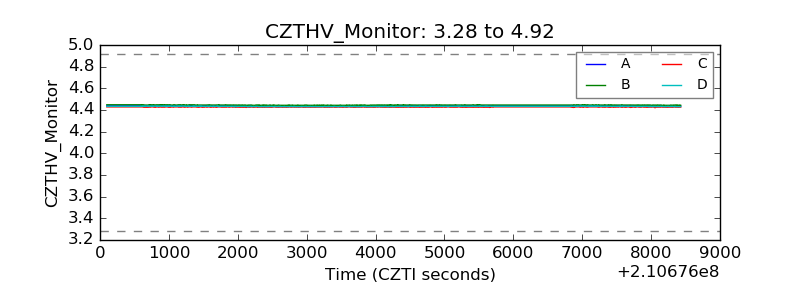 |
| D_VDD |  |
| Temperature 1 | 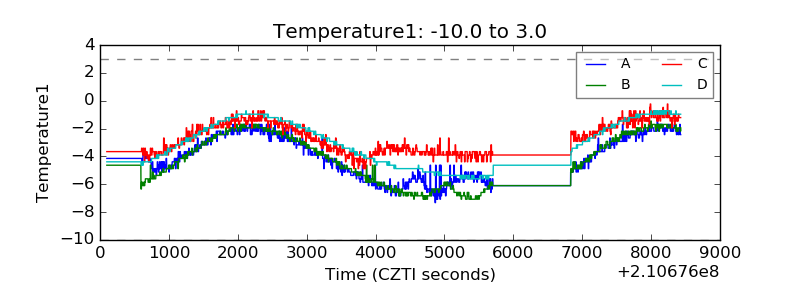 |
| Veto HV Monitor | 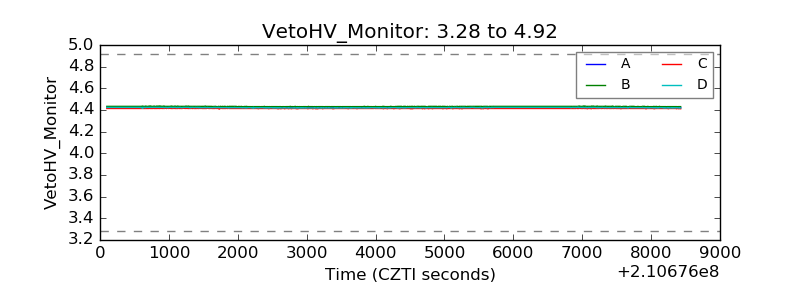 |
| Veto LLD | 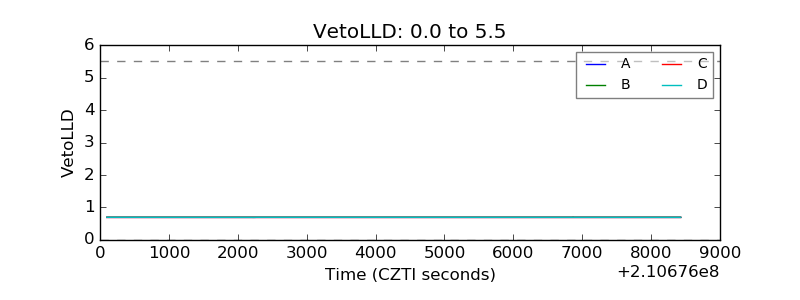 |
| Alpha Counter | 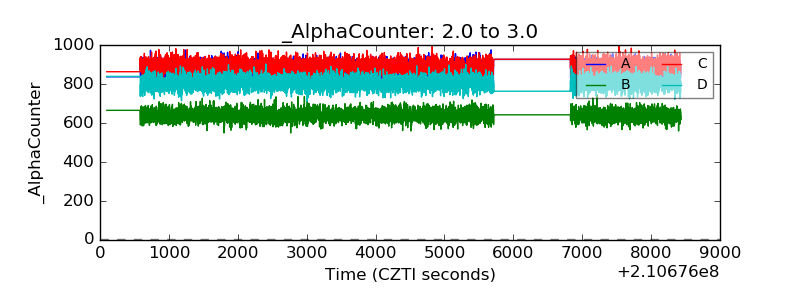 |
| _CPM_Rate | 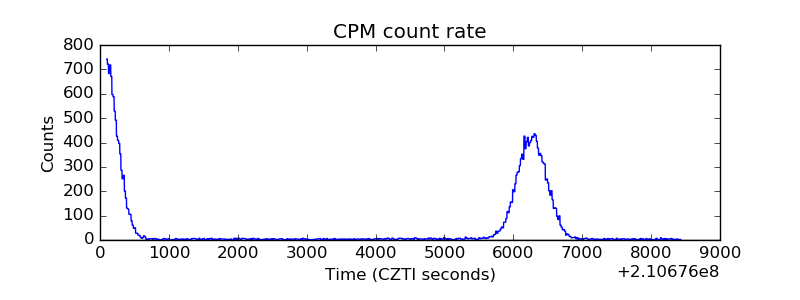 |
| CZT Counter | 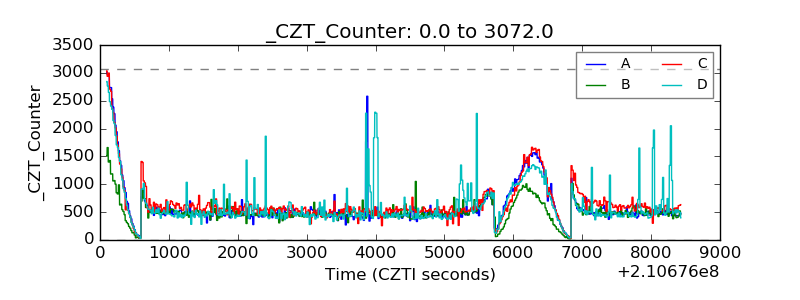 |
| +2.5 Volts monitor |  |
| +5 Volts monitor |  |
| _ROLL_ROT | 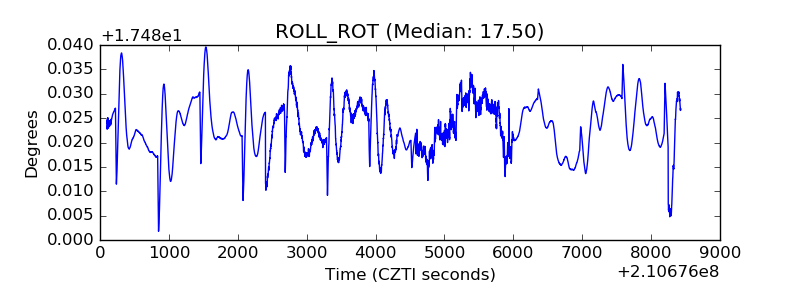 |
| _Roll_DEC | 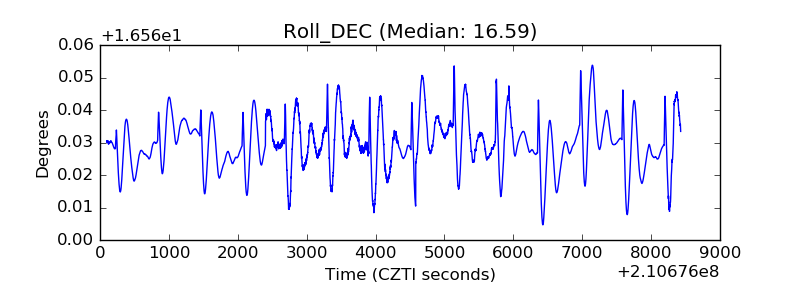 |
| _Roll_RA | 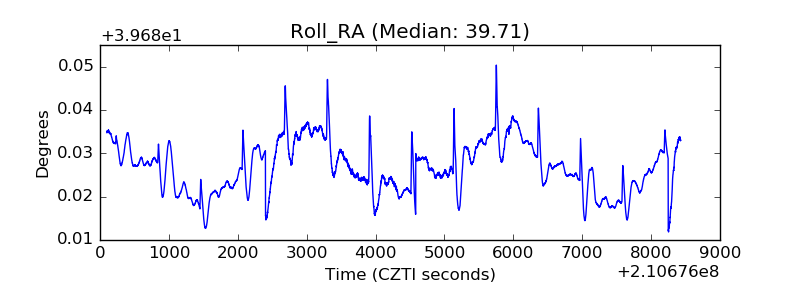 |
| Veto Counter | 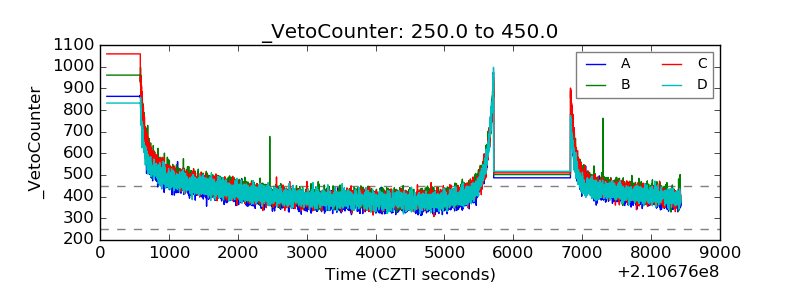 |