| Param | Original file | Final file |
|---|---|---|
| Filename | modeM0/AS1G05_218T04_9000000640_05070cztM0_level2.evt | modeM0/AS1G05_218T04_9000000640_05070cztM0_level2_quad_clean.evt |
| Size (bytes) | 790,865,280 | 64,817,280 |
| Size | 754.2 MB | 61.8 MB |
| Events in quadrant A | 3,817,867 | 376,558 |
| Events in quadrant B | 3,747,474 | 373,575 |
| Events in quadrant C | 3,542,518 | 368,688 |
| Events in quadrant D | 12,327,184 | 312,498 |
| Mode SS | |||
|---|---|---|---|
| Quadrant | BADHDUFLAG | Total packets | Discarded packets |
| A | 0 | 156 | 0 |
| B | 0 | 156 | 0 |
| C | 0 | 156 | 0 |
| D | 0 | 156 | 0 |
| Mode M9 | |||
|---|---|---|---|
| Quadrant | BADHDUFLAG | Total packets | Discarded packets |
| A | 0 | 4 | 0 |
| B | 0 | 4 | 0 |
| C | 0 | 4 | 0 |
| D | 0 | 5 | 0 |
| Mode M0 | |||
|---|---|---|---|
| Quadrant | BADHDUFLAG | Total packets | Discarded packets |
| A | 0 | 16686 | 4 |
| B | 0 | 16298 | 5 |
| C | 0 | 15921 | 7 |
| D | 0 | 41951 | 20 |
| Quadrant | Total seconds | Saturated seconds | Saturation percentage |
|---|---|---|---|
| A | 7623 | 232 | 3.043421% |
| B | 7622 | 187 | 2.453424% |
| C | 7621 | 158 | 2.073219% |
| D | 7621 | 3448 | 45.243406% |
Noise dominated data is calculated using 1-second bins in cleaned event files. If a bin has >2000 counts, and if more than 50% of those come from <1% of pixels, then it is considered to be noise-dominated and hence unusable.
| Quadrant | # 1 sec bins | Bins with >0 counts | Bins with >2000 counts | High rate bins dominated by noise | Noise dominated (total time) | Noise dominated (detector-on time) | Marked lightcurve |
|---|---|---|---|---|---|---|---|
| A | 7778 | 7627 | 43 | 43 | 0.55% | 0.56% | 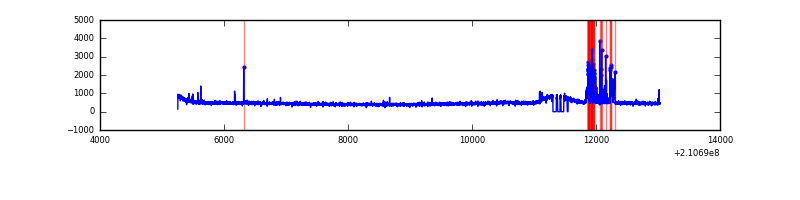 |
| B | 7778 | 7627 | 3 | 3 | 0.04% | 0.04% | 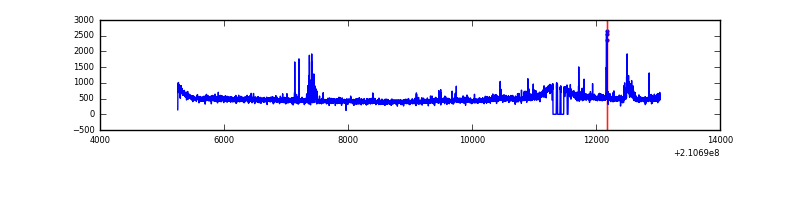 |
| C | 7778 | 7626 | 0 | 0 | 0.00% | 0.00% | 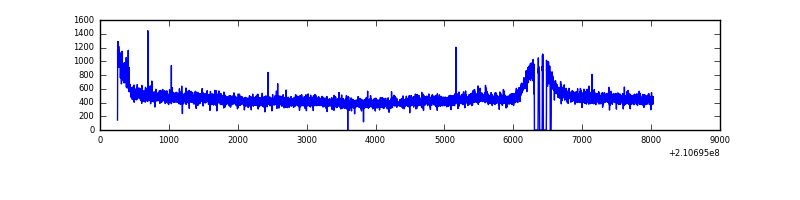 |
| D | 7778 | 7627 | 3161 | 3161 | 40.64% | 41.44% | 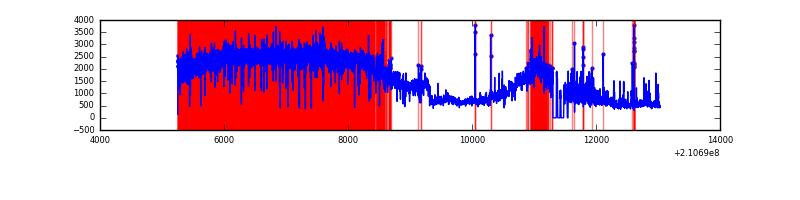 |
Top three noisy pixels from each quadrant. If the there are fewer than three noisy pixels in the level2.evt file, extra rows are filled as -1
| Pixel properties | Quadrant properties | ||||||
|---|---|---|---|---|---|---|---|
| Quadrant | DetID | PixID | Counts | Sigma | Mean | Median | Sigma |
| A | 15 | 174 | 267129 | 1422.73 | 909 | 888 | 187.1 |
| A | 0 | 50 | 29894 | 155.0 | 909 | 888 | 187.1 |
| A | 13 | 251 | 22571 | 115.87 | 909 | 888 | 187.1 |
| B | 0 | 219 | 89500 | 495.62 | 917 | 894 | 178.8 |
| B | 15 | 204 | 73258 | 404.77 | 917 | 894 | 178.8 |
| B | 12 | 111 | 15319 | 80.69 | 917 | 894 | 178.8 |
| C | 1 | 16 | 102798 | 498.56 | 878 | 879 | 204.4 |
| C | 13 | 61 | 7273 | 31.28 | 878 | 879 | 204.4 |
| C | 9 | 54 | 7092 | 30.39 | 878 | 879 | 204.4 |
| D | 7 | 237 | 8549492 | 46513.91 | 742 | 718 | 183.8 |
| D | 13 | 235 | 262669 | 1425.28 | 742 | 718 | 183.8 |
| D | 2 | 136 | 219461 | 1190.18 | 742 | 718 | 183.8 |
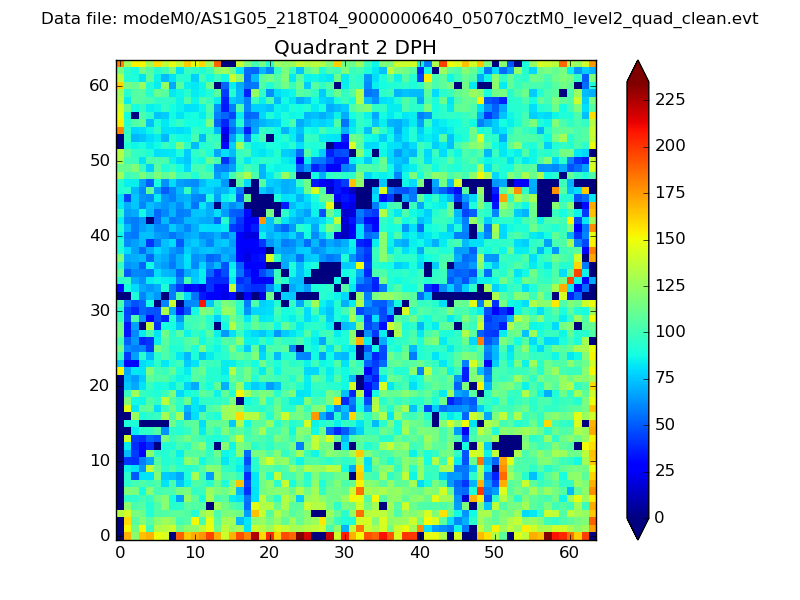
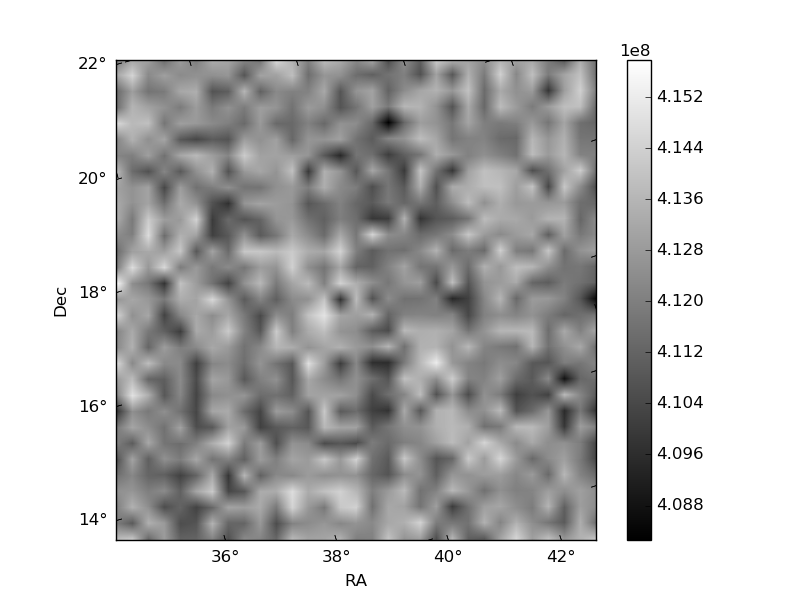
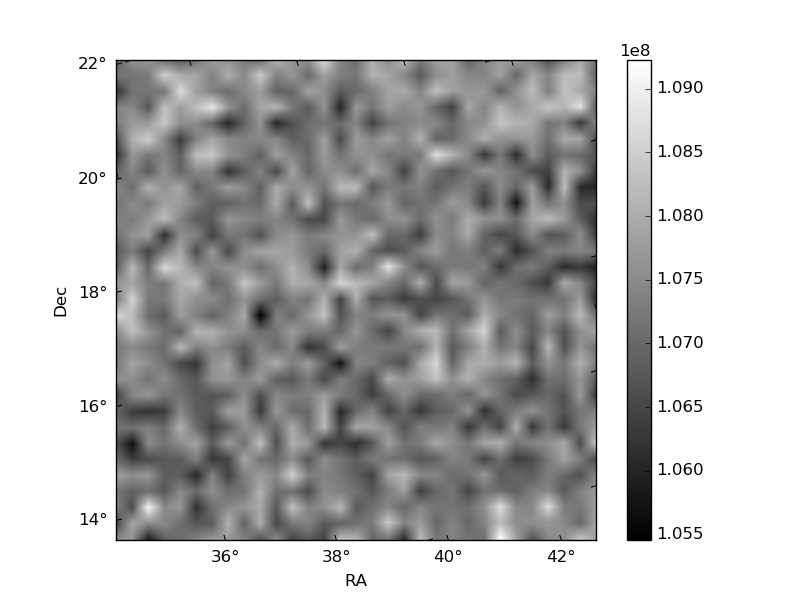
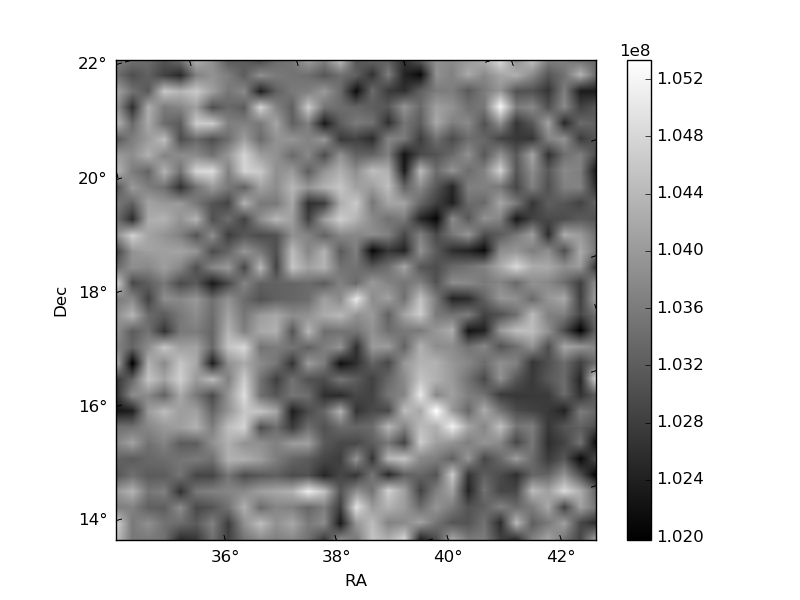
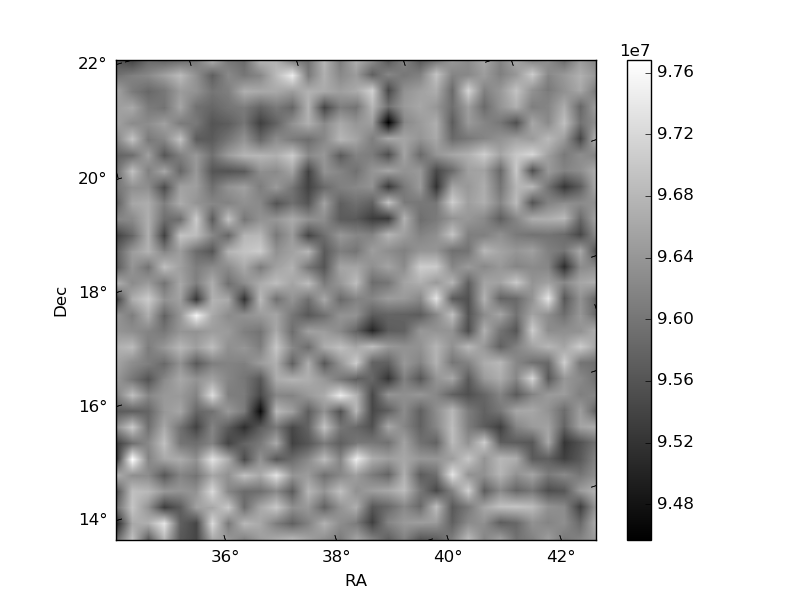
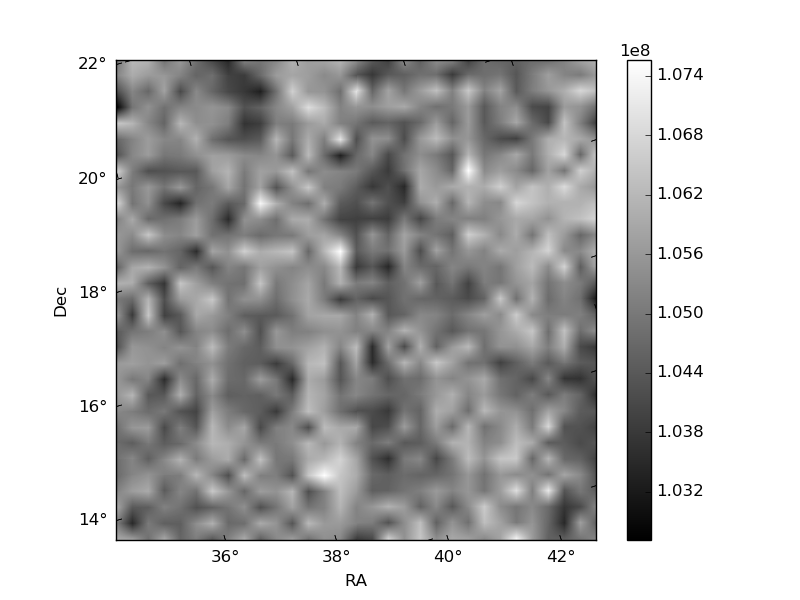
Histogram calculated using DETX and DETY for each event in the final _common_clean file
| Quadrant A | 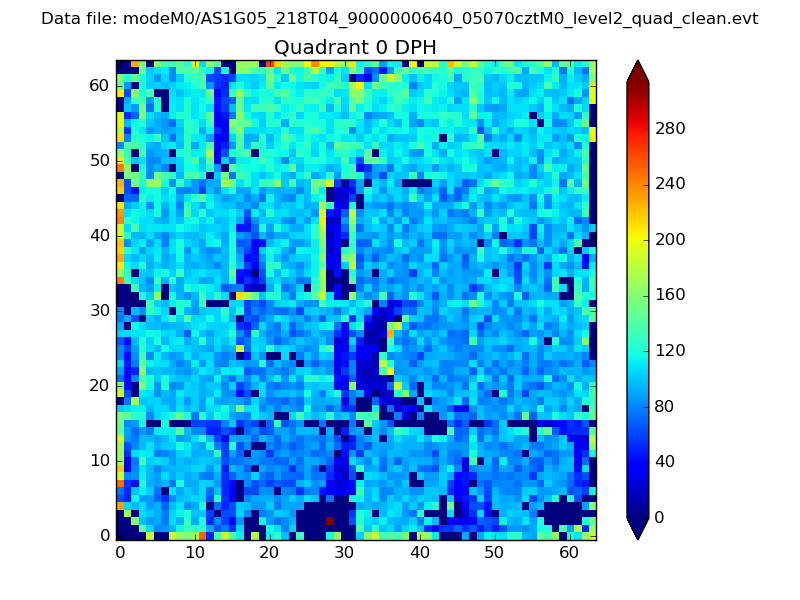 |
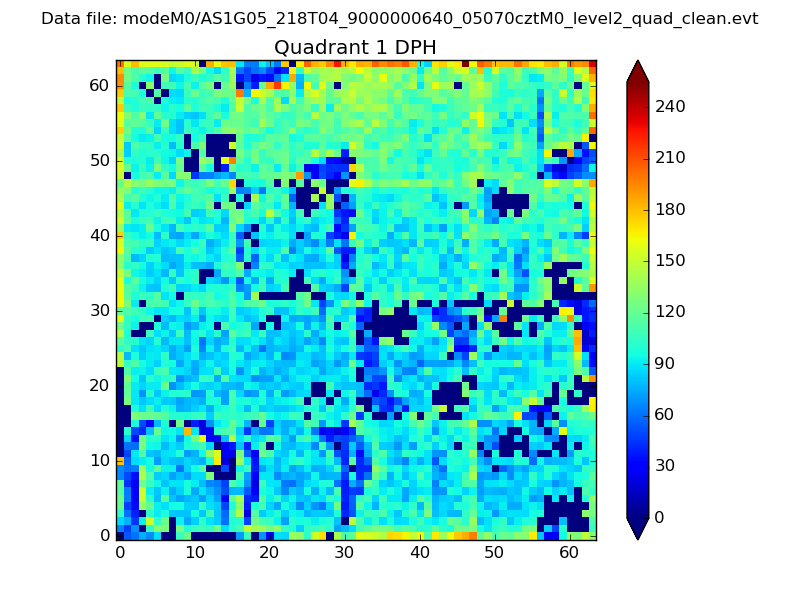 |
Quadrant B |
|---|---|---|---|
| Quadrant D | 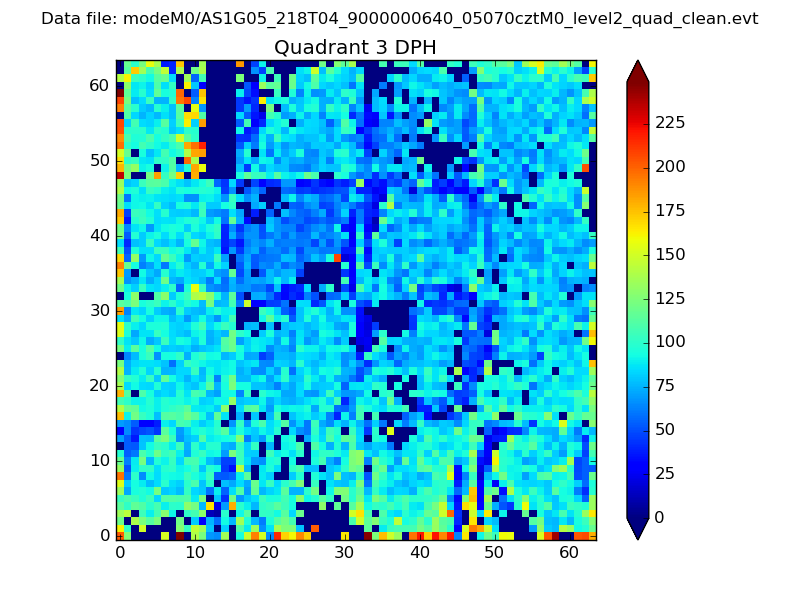 |
 |
Quadrant C |
| Plot type | Count rate plots | Images |
|---|---|---|
| Comparison with Poisson distribution Blue bars denote a histogram of data divided into 1 sec bins. Red curve is a Poisson curve with rate = median count rate of data. |
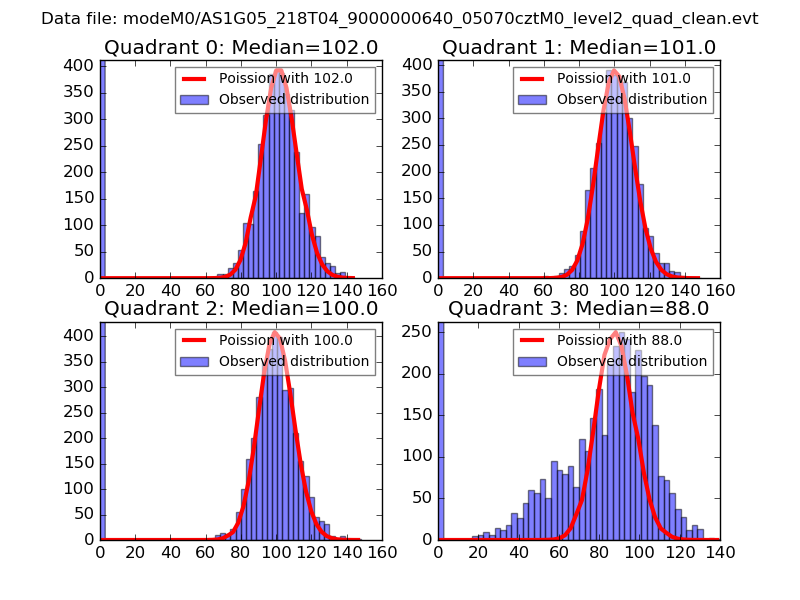 |
 |
| Quadrant-wise count rates Data is divided into 100 sec bins |
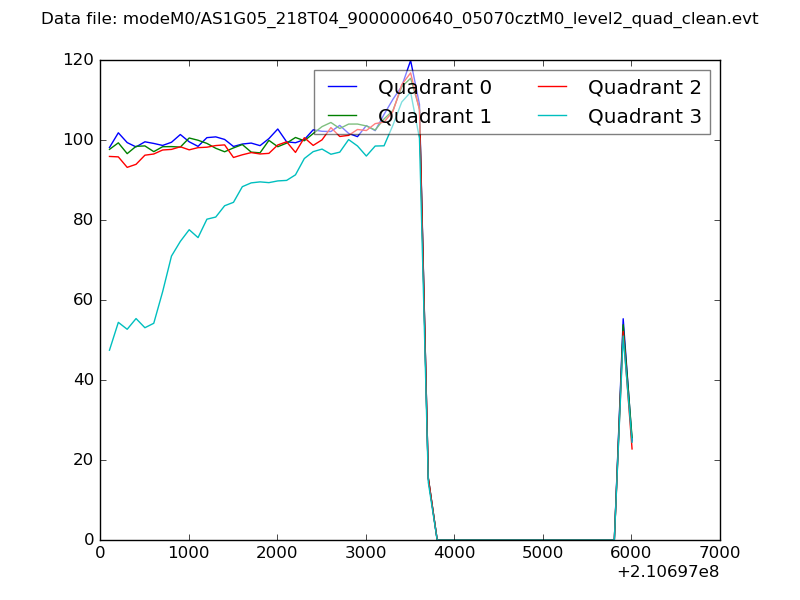 |
|
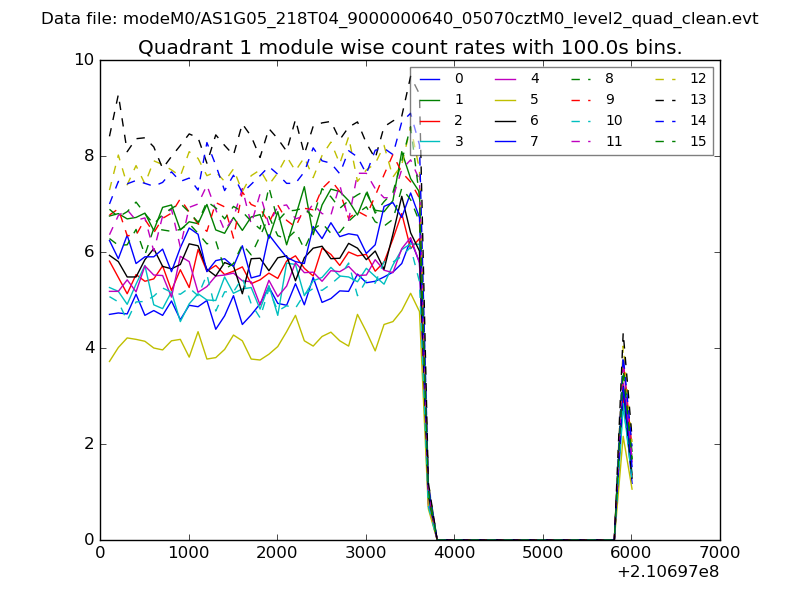
| Module-wise count rates for Quadrant A Data is divided into 100 sec bins |
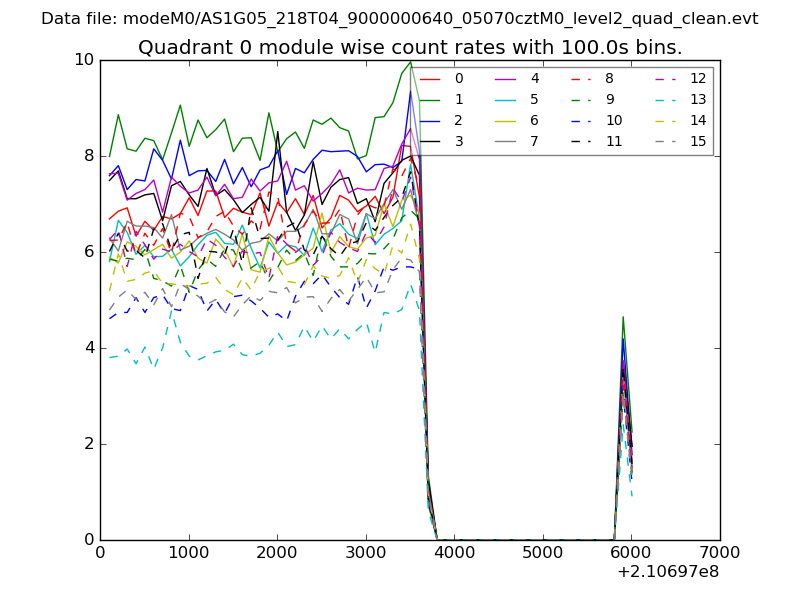 |
 |
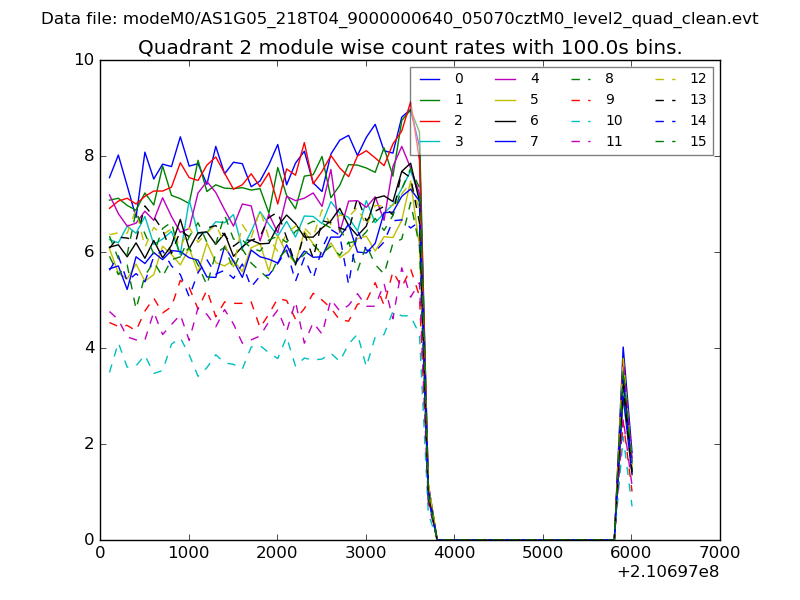
| Module-wise count rates for Quadrant B Data is divided into 100 sec bins |
 |
 |
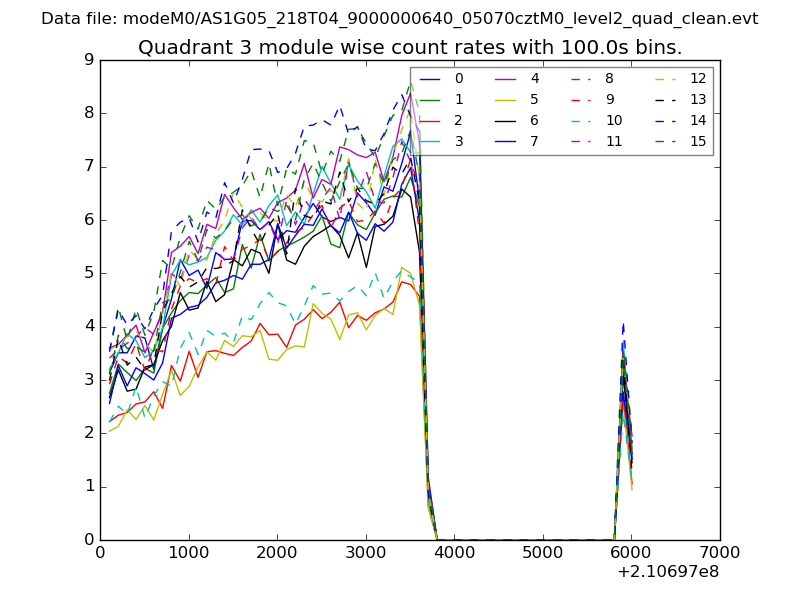
| Module-wise count rates for Quadrant C Data is divided into 100 sec bins |
 |
 |
| Module-wise count rates for Quadrant D Data is divided into 100 sec bins |
 |
 |
| Parameter | Plot |
|---|---|
| CZT HV Monitor | 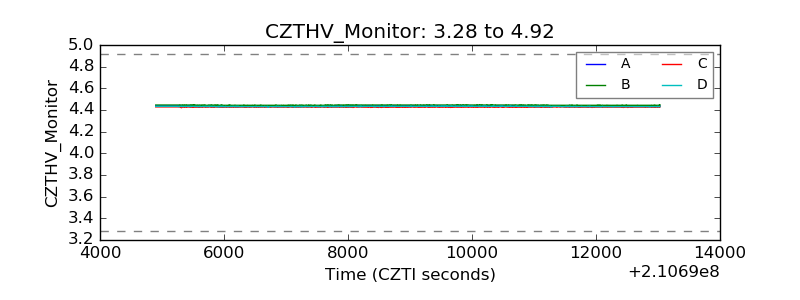 |
| D_VDD | 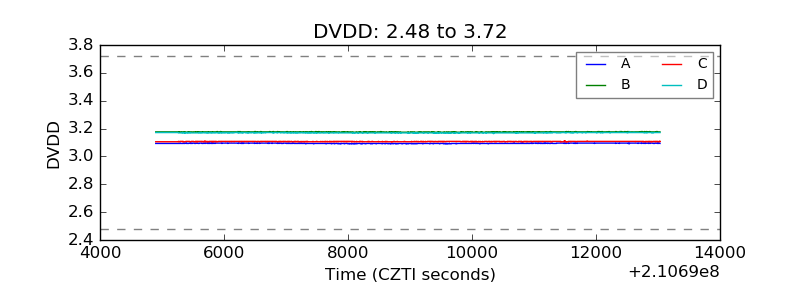 |
| Temperature 1 | 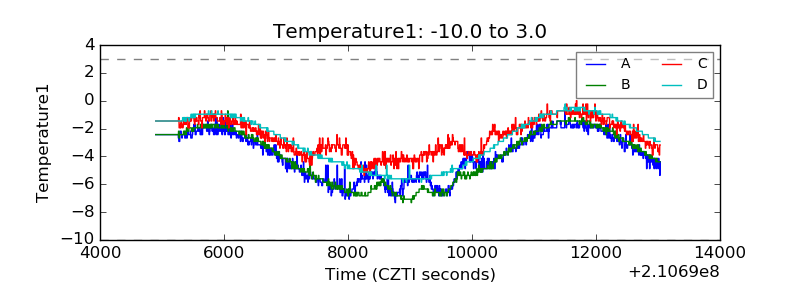 |
| Veto HV Monitor | 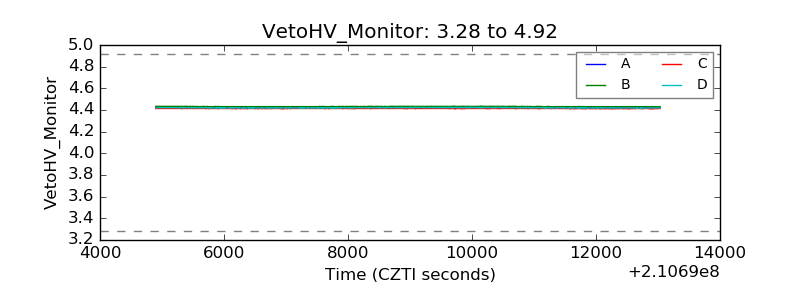 |
| Veto LLD | 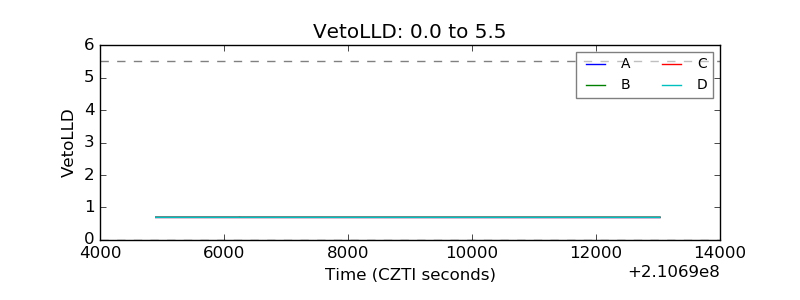 |
| Alpha Counter | 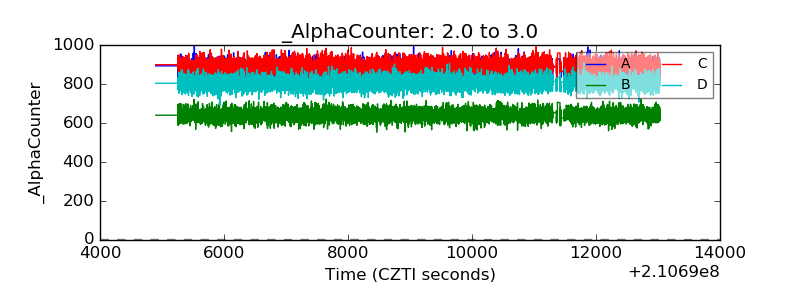 |
| _CPM_Rate | 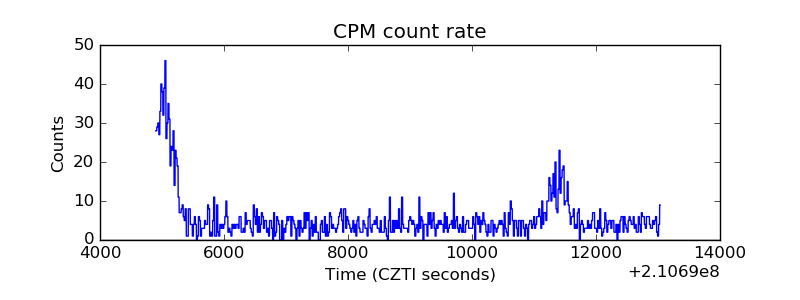 |
| CZT Counter | 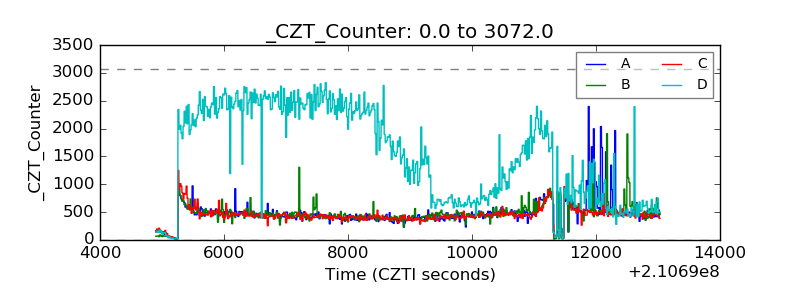 |
| +2.5 Volts monitor |  |
| +5 Volts monitor |  |
| _ROLL_ROT | 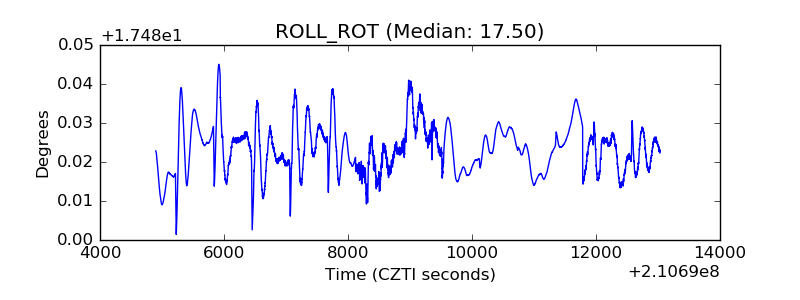 |
| _Roll_DEC | 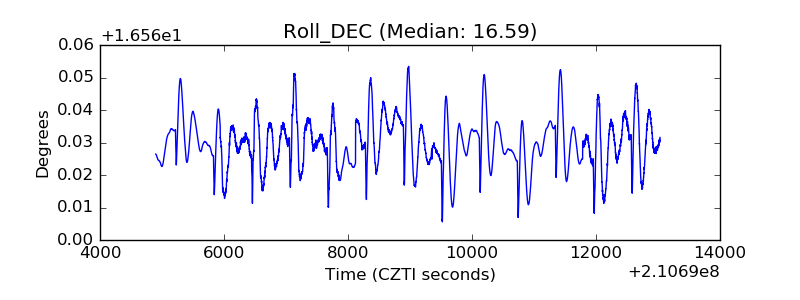 |
| _Roll_RA | 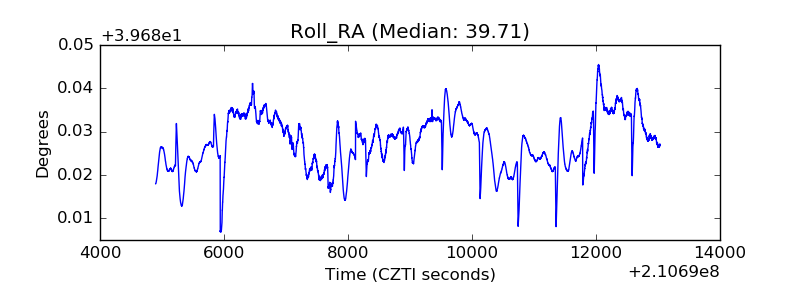 |
| Veto Counter | 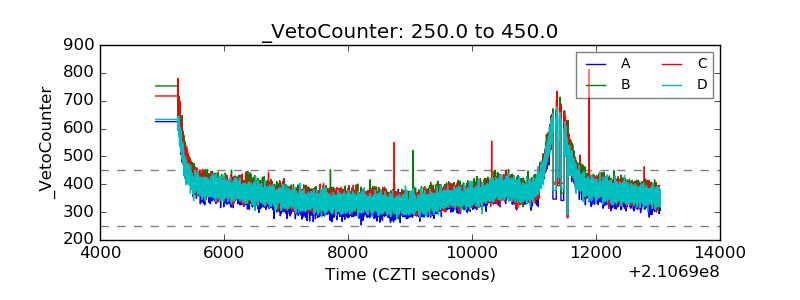 |