| Param | Original file | Final file |
|---|---|---|
| Filename | modeM0/AS1G05_218T04_9000000640_05071cztM0_level2.evt | modeM0/AS1G05_218T04_9000000640_05071cztM0_level2_quad_clean.evt |
| Size (bytes) | 612,138,240 | 70,657,920 |
| Size | 583.8 MB | 67.4 MB |
| Events in quadrant A | 4,062,840 | 409,984 |
| Events in quadrant B | 4,057,293 | 409,676 |
| Events in quadrant C | 3,633,543 | 404,344 |
| Events in quadrant D | 6,248,574 | 366,355 |
| Mode SS | |||
|---|---|---|---|
| Quadrant | BADHDUFLAG | Total packets | Discarded packets |
| A | 0 | 172 | 6 |
| B | 0 | 172 | 6 |
| C | 0 | 172 | 2 |
| D | 0 | 172 | 12 |
| Mode M9 | |||
|---|---|---|---|
| Quadrant | BADHDUFLAG | Total packets | Discarded packets |
| A | 0 | 3 | 0 |
| B | 0 | 3 | 0 |
| C | 0 | 3 | 0 |
| D | 0 | 3 | 0 |
| Mode M0 | |||
|---|---|---|---|
| Quadrant | BADHDUFLAG | Total packets | Discarded packets |
| A | 0 | 18665 | 1087 |
| B | 0 | 18423 | 1025 |
| C | 0 | 17308 | 803 |
| D | 0 | 26161 | 2123 |
| Quadrant | Total seconds | Saturated seconds | Saturation percentage |
|---|---|---|---|
| A | 7895 | 258 | 3.267891% |
| B | 7897 | 265 | 3.355705% |
| C | 7941 | 158 | 1.989674% |
| D | 7773 | 907 | 11.668596% |
Noise dominated data is calculated using 1-second bins in cleaned event files. If a bin has >2000 counts, and if more than 50% of those come from <1% of pixels, then it is considered to be noise-dominated and hence unusable.
| Quadrant | # 1 sec bins | Bins with >0 counts | Bins with >2000 counts | High rate bins dominated by noise | Noise dominated (total time) | Noise dominated (detector-on time) | Marked lightcurve |
|---|---|---|---|---|---|---|---|
| A | 8700 | 8271 | 40 | 40 | 0.46% | 0.48% | 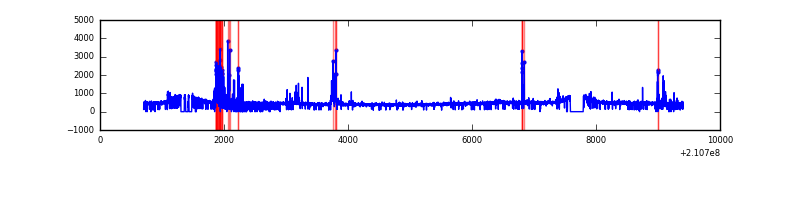 |
| B | 8698 | 8267 | 9 | 9 | 0.10% | 0.11% | 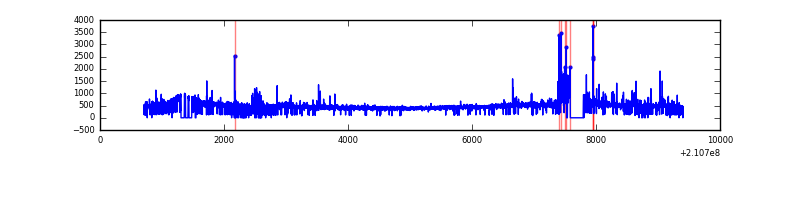 |
| C | 8701 | 8282 | 0 | 0 | 0.00% | 0.00% | 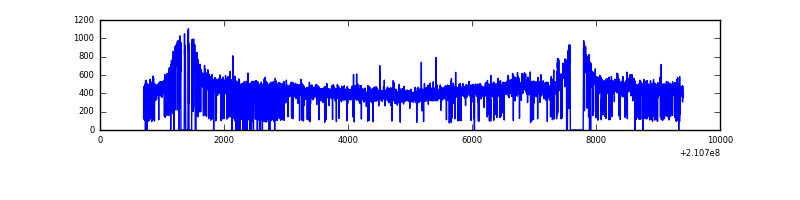 |
| D | 8700 | 8222 | 486 | 486 | 5.59% | 5.91% | 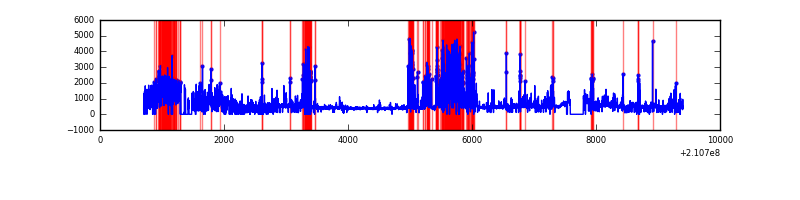 |
Top three noisy pixels from each quadrant. If the there are fewer than three noisy pixels in the level2.evt file, extra rows are filled as -1
| Pixel properties | Quadrant properties | ||||||
|---|---|---|---|---|---|---|---|
| Quadrant | DetID | PixID | Counts | Sigma | Mean | Median | Sigma |
| A | 15 | 174 | 273204 | 1391.34 | 943 | 916 | 195.7 |
| A | 0 | 50 | 146190 | 742.32 | 943 | 916 | 195.7 |
| A | 13 | 251 | 16118 | 77.68 | 943 | 916 | 195.7 |
| B | 15 | 204 | 165754 | 894.84 | 947 | 924 | 184.2 |
| B | 0 | 219 | 95501 | 513.45 | 947 | 924 | 184.2 |
| B | 7 | 221 | 58720 | 313.77 | 947 | 924 | 184.2 |
| C | 1 | 16 | 45241 | 206.9 | 918 | 919 | 214.2 |
| C | 13 | 61 | 7402 | 30.26 | 918 | 919 | 214.2 |
| C | 8 | 222 | 4915 | 18.65 | 918 | 919 | 214.2 |
| D | 13 | 239 | 1156859 | 5444.09 | 859 | 829 | 212.3 |
| D | 7 | 237 | 706341 | 3322.47 | 859 | 829 | 212.3 |
| D | 2 | 33 | 394931 | 1855.95 | 859 | 829 | 212.3 |
Histogram calculated using DETX and DETY for each event in the final _common_clean file
| Quadrant A | 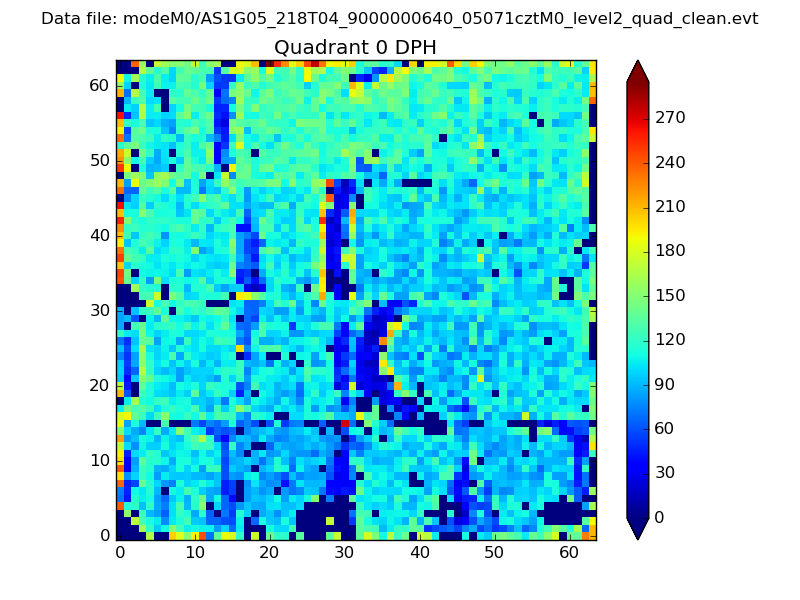 |
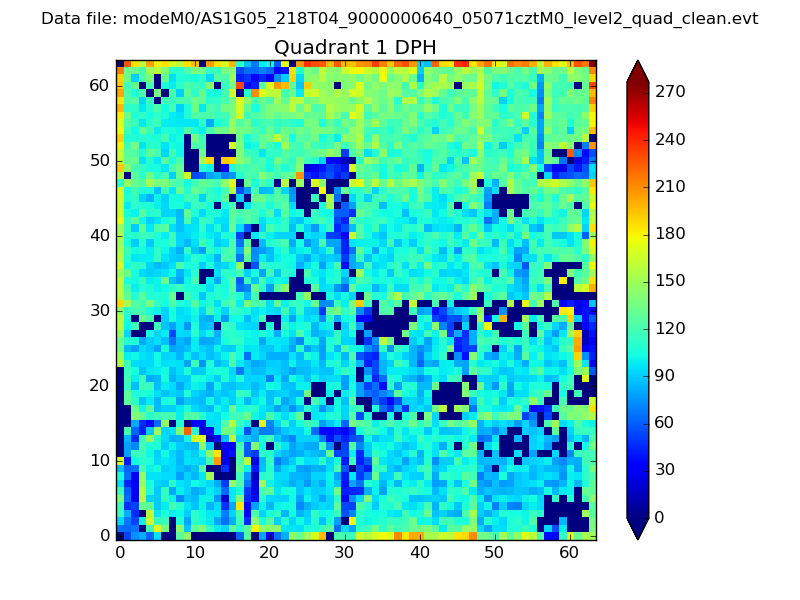 |
Quadrant B |
|---|---|---|---|
| Quadrant D |  |
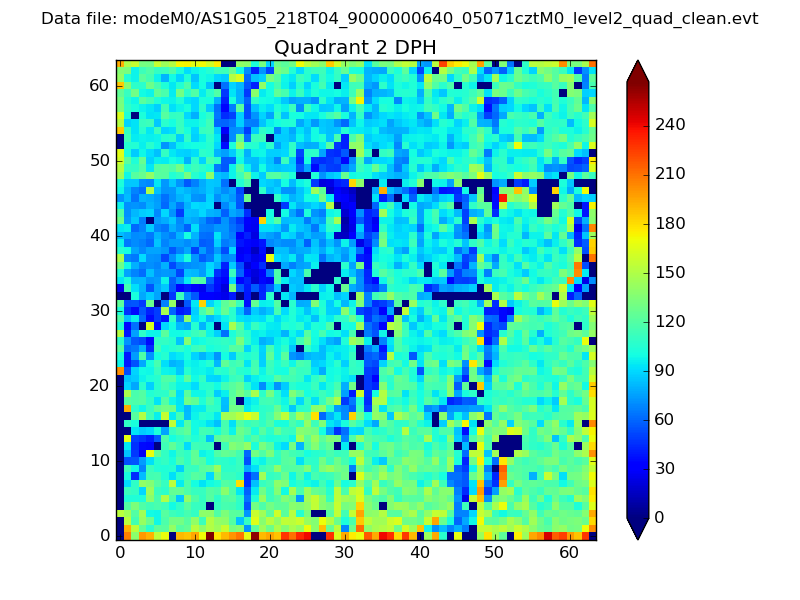 |
Quadrant C |
| Plot type | Count rate plots | Images |
|---|---|---|
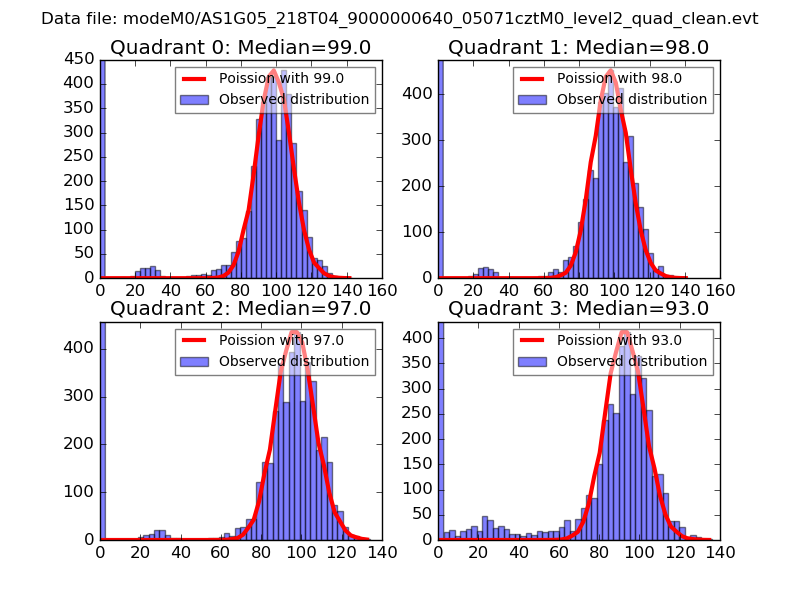
| Comparison with Poisson distribution Blue bars denote a histogram of data divided into 1 sec bins. Red curve is a Poisson curve with rate = median count rate of data. |
 |
 |
| Quadrant-wise count rates Data is divided into 100 sec bins |
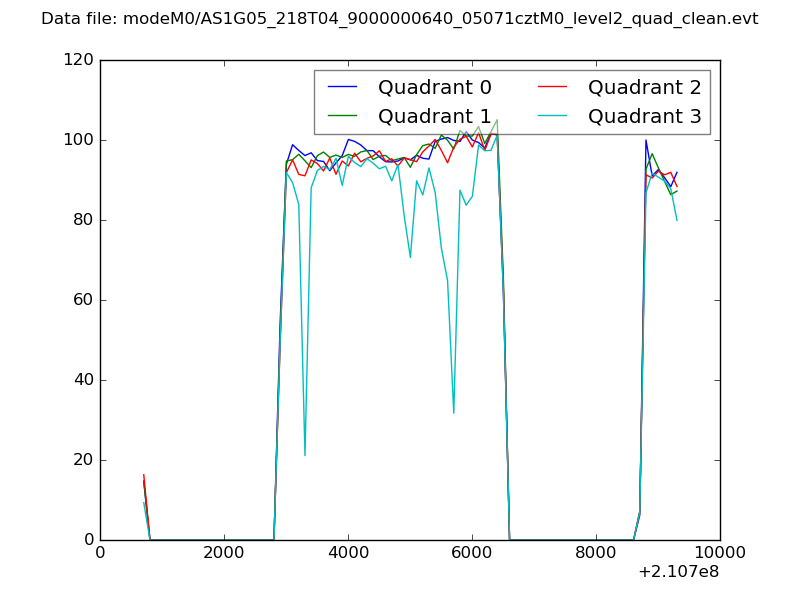 |
|
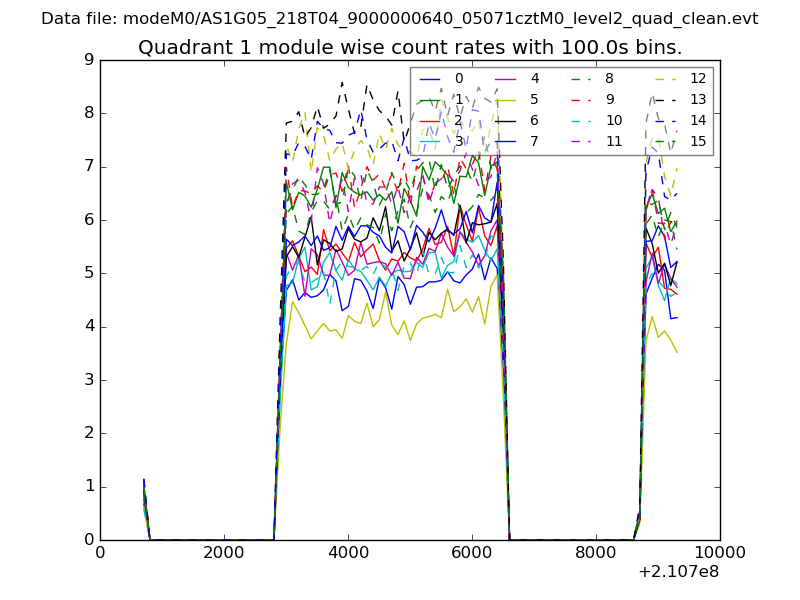
| Module-wise count rates for Quadrant A Data is divided into 100 sec bins |
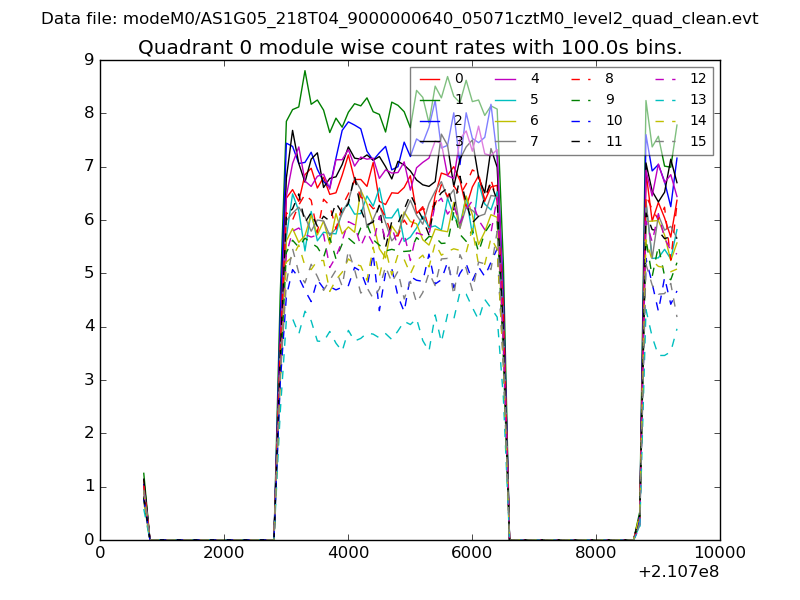 |
 |
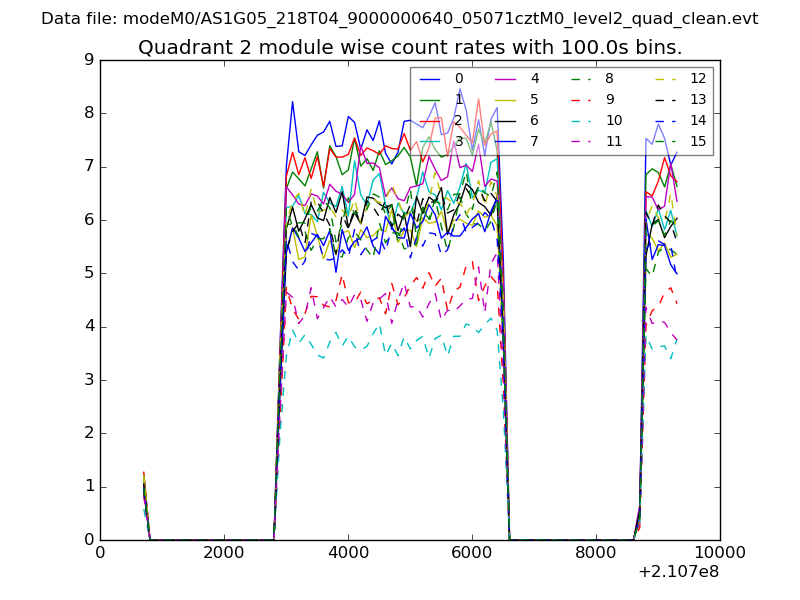
| Module-wise count rates for Quadrant B Data is divided into 100 sec bins |
 |
 |
| Module-wise count rates for Quadrant C Data is divided into 100 sec bins |
 |
 |
| Module-wise count rates for Quadrant D Data is divided into 100 sec bins |
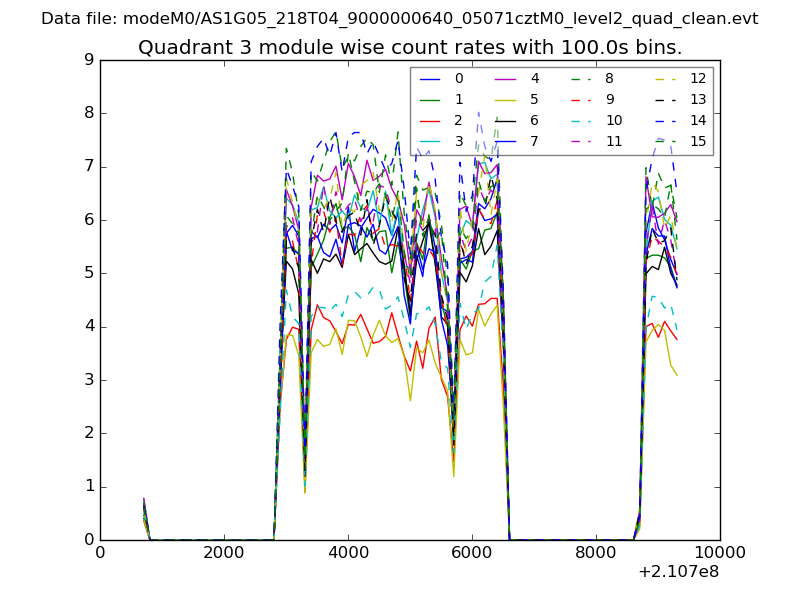 |
 |
| Parameter | Plot |
|---|---|
| CZT HV Monitor | 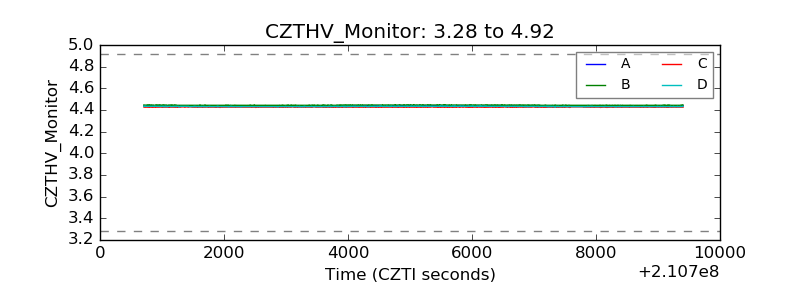 |
| D_VDD | 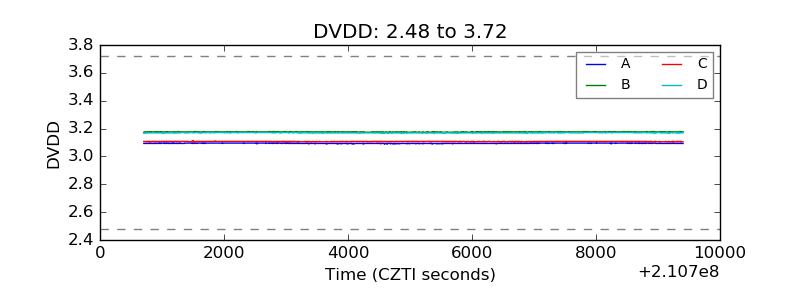 |
| Temperature 1 | 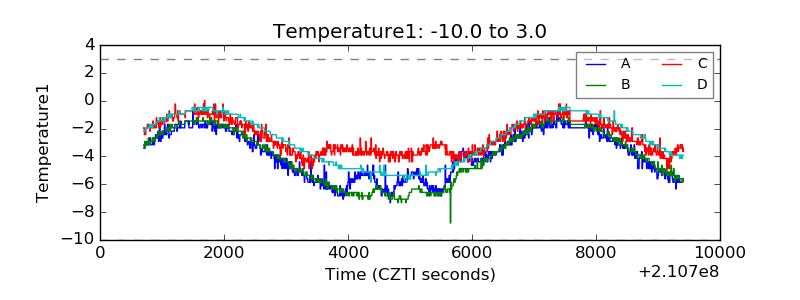 |
| Veto HV Monitor | 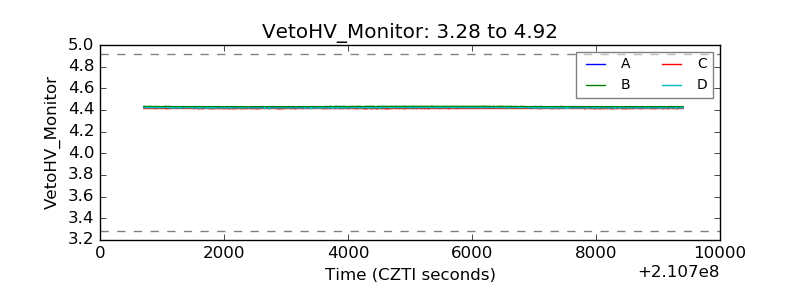 |
| Veto LLD | 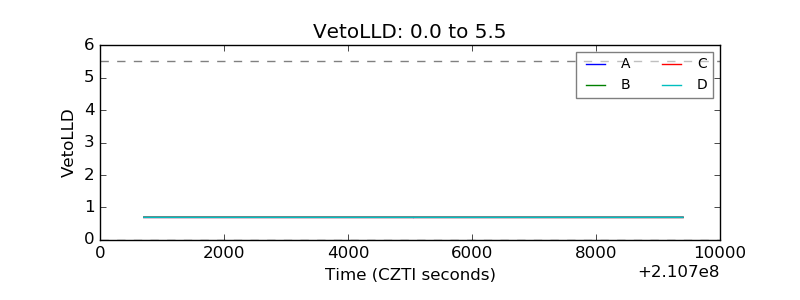 |
| Alpha Counter | 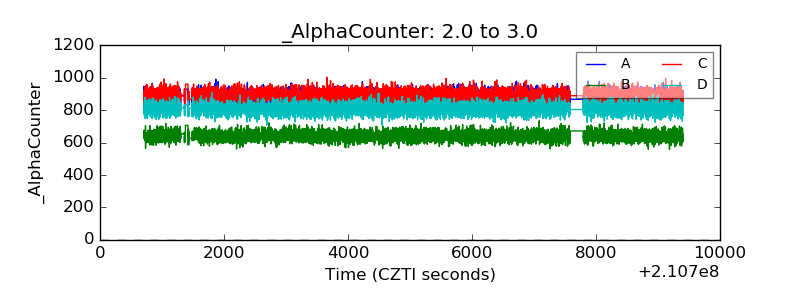 |
| _CPM_Rate | 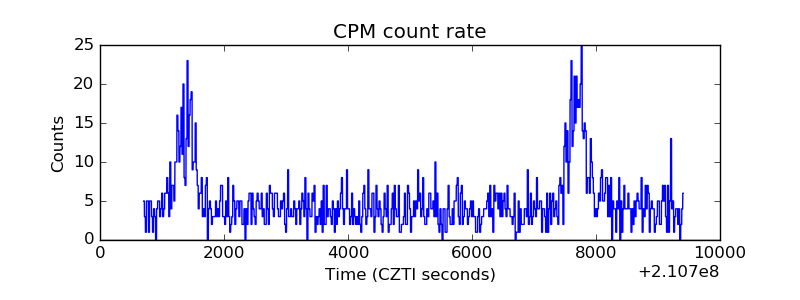 |
| CZT Counter | 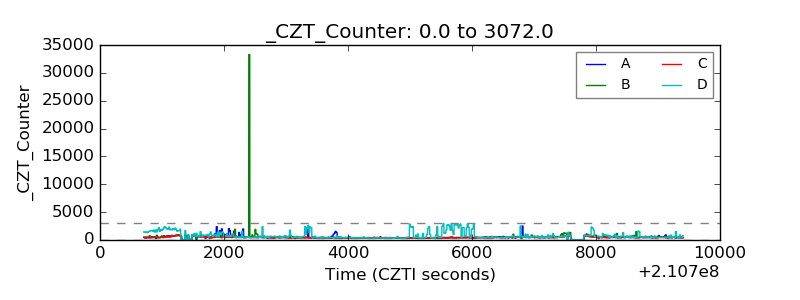 |
| +2.5 Volts monitor |  |
| +5 Volts monitor |  |
| _ROLL_ROT | 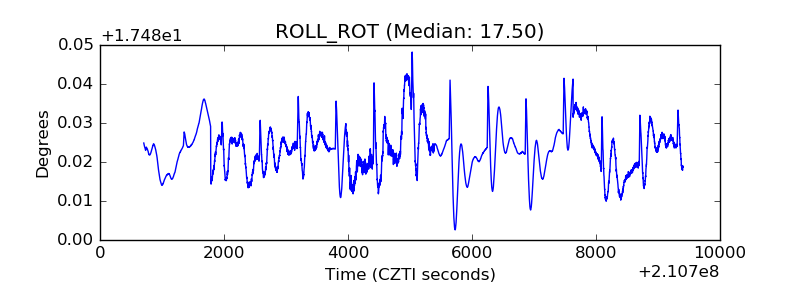 |
| _Roll_DEC | 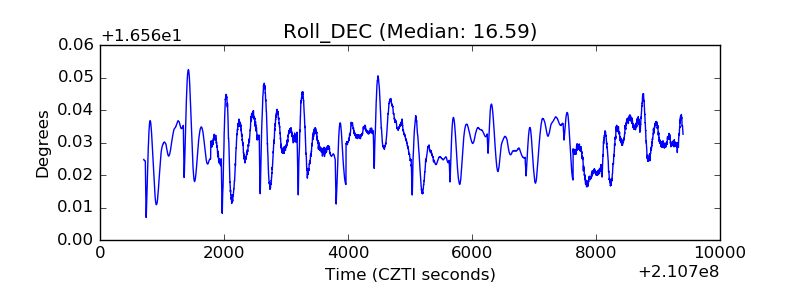 |
| _Roll_RA | 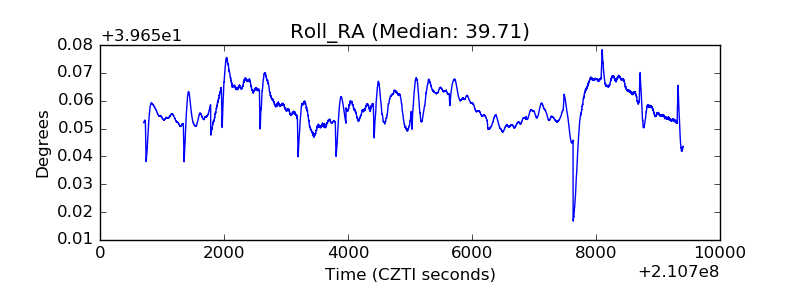 |
| Veto Counter | 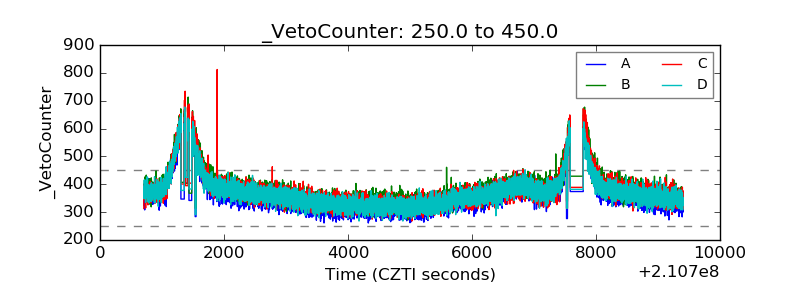 |