| Param | Original file | Final file |
|---|---|---|
| Filename | modeM0/AS1G05_103T01_9000000642cztM0_level2.fits | modeM0/AS1G05_103T01_9000000642cztM0_level2_quad_clean.evt |
| Size (bytes) | 778,680,000 | 822,666,240 |
| Size | 742.6 MB | 784.6 MB |
| Events in quadrant A | 4,745,748 | 5,098,394 |
| Events in quadrant B | 4,587,386 | 5,147,797 |
| Events in quadrant C | 4,662,316 | 4,876,252 |
| Events in quadrant D | 3,679,884 | 3,891,938 |
| Mode SS | |||
|---|---|---|---|
| Quadrant | BADHDUFLAG | Total packets | Discarded packets |
| A | 0 | 1754 | 0 |
| B | 0 | 1754 | 0 |
| C | 0 | 1754 | 0 |
| D | 0 | 1754 | 0 |
| Mode M0 | |||
|---|---|---|---|
| Quadrant | BADHDUFLAG | Total packets | Discarded packets |
| A | 0 | 180012 | 0 |
| B | 0 | 184237 | 0 |
| C | 0 | 176465 | 0 |
| D | 0 | 284638 | 0 |
| Mode M9 | |||
|---|---|---|---|
| Quadrant | BADHDUFLAG | Total packets | Discarded packets |
| A | 0 | 129 | 0 |
| B | 0 | 129 | 0 |
| C | 0 | 129 | 0 |
| D | 0 | 129 | 0 |
| Quadrant | Total seconds | Saturated seconds | Saturation percentage |
|---|---|---|---|
| A | 86075 | 1365 | 1.585826% |
| B | 86081 | 1219 | 1.416108% |
| C | 86079 | 712 | 0.827147% |
| D | 86080 | 12376 | 14.377323% |
Noise dominated data is calculated using 1-second bins in cleaned event files. If a bin has >2000 counts, and if more than 50% of those come from <1% of pixels, then it is considered to be noise-dominated and hence unusable.
| Quadrant | # 1 sec bins | Bins with >0 counts | Bins with >2000 counts | High rate bins dominated by noise | Noise dominated (total time) | Noise dominated (detector-on time) | Marked lightcurve |
|---|---|---|---|---|---|---|---|
| A | 98157 | 86079 | 0 | 0 | 0.00% | 0.00% | 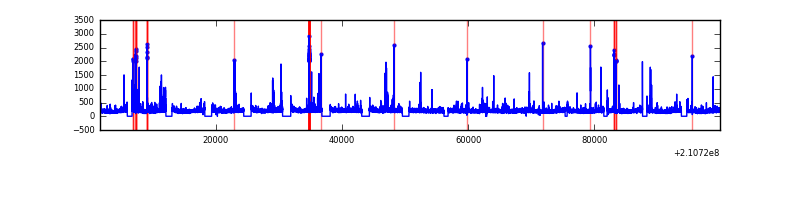 |
| B | 98157 | 86081 | 0 | 0 | 0.00% | 0.00% | 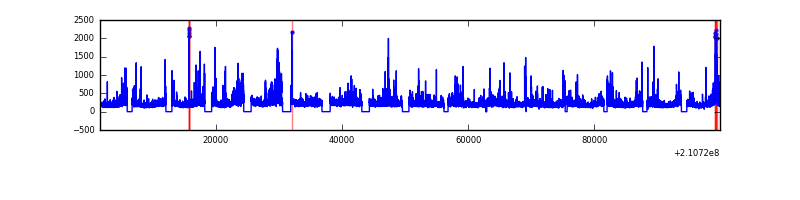 |
| C | 98157 | 86081 | 0 | 0 | 0.00% | 0.00% | 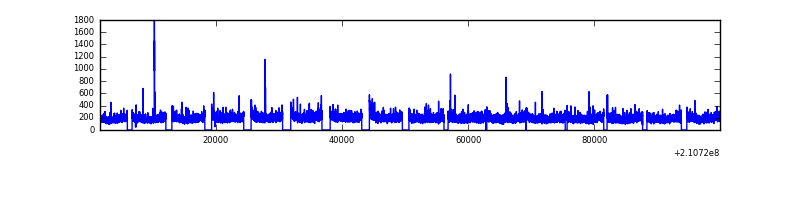 |
| D | 98157 | 85064 | 0 | 0 | 0.00% | 0.00% | 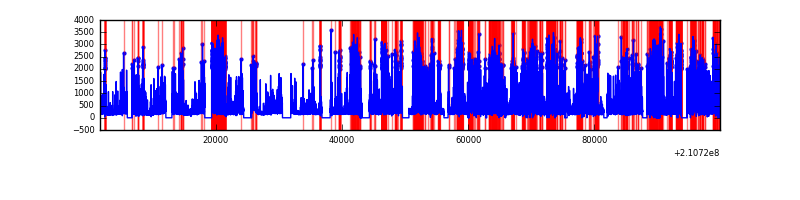 |
Top three noisy pixels from each quadrant. If the there are fewer than three noisy pixels in the level2.evt file, extra rows are filled as -1
| Pixel properties | Quadrant properties | ||||||
|---|---|---|---|---|---|---|---|
| Quadrant | DetID | PixID | Counts | Sigma | Mean | Median | Sigma |
| A | 14 | 188 | 4634 | 11.08 | 1229 | 1144 | 314.9 |
| A | 0 | 29 | 4500 | 10.66 | 1229 | 1144 | 314.9 |
| A | 7 | 110 | 3983 | 9.02 | 1229 | 1144 | 314.9 |
| B | 2 | 9 | 3980 | 11.65 | 1208 | 1147 | 243.2 |
| B | 12 | 226 | 3281 | 8.77 | 1208 | 1147 | 243.2 |
| B | 14 | 254 | 3194 | 8.42 | 1208 | 1147 | 243.2 |
| C | 12 | 241 | 3340 | 6.59 | 1231 | 1135 | 334.7 |
| C | 1 | 80 | 3324 | 6.54 | 1231 | 1135 | 334.7 |
| C | 1 | 81 | 3258 | 6.34 | 1231 | 1135 | 334.7 |
| D | 11 | 82 | 2946 | 7.03 | 1048 | 947 | 284.2 |
| D | 1 | 19 | 2815 | 6.57 | 1048 | 947 | 284.2 |
| D | 3 | 14 | 2808 | 6.55 | 1048 | 947 | 284.2 |
Histogram calculated using DETX and DETY for each event in the final _common_clean file
| Quadrant A | 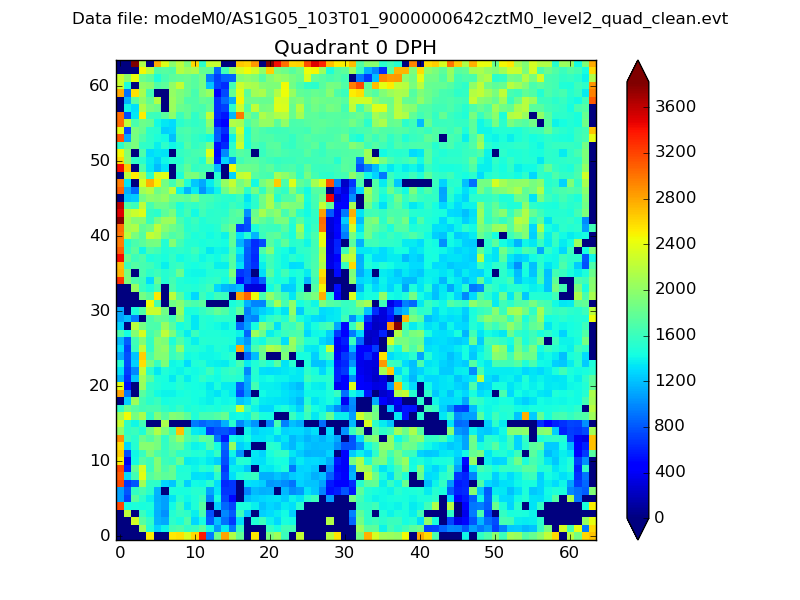 |
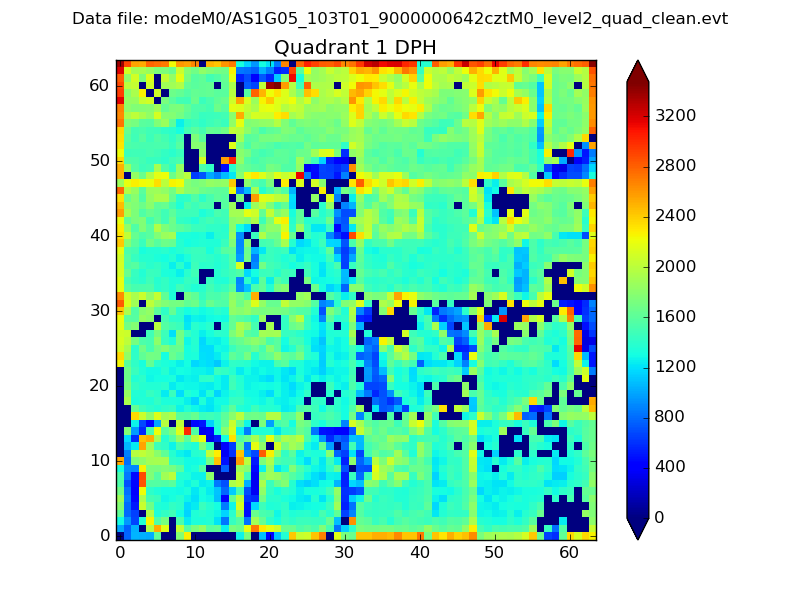 |
Quadrant B |
|---|---|---|---|
| Quadrant D | 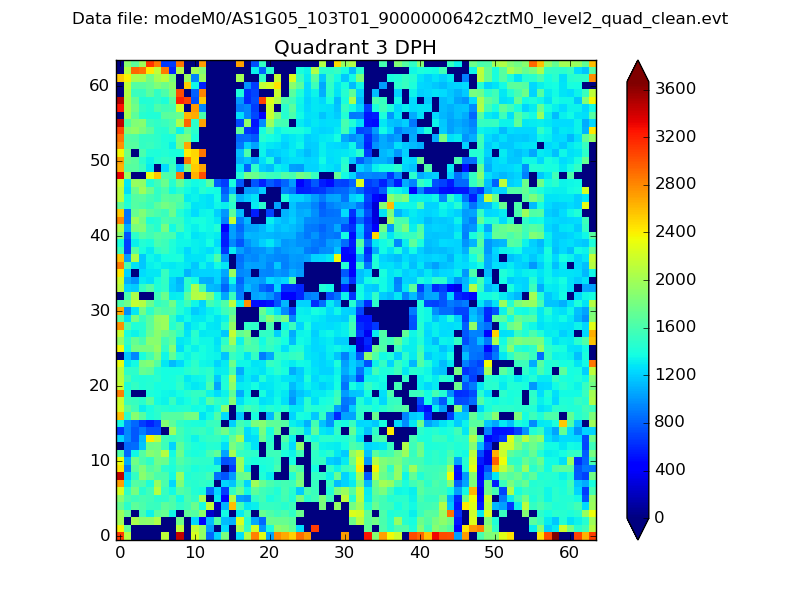 |
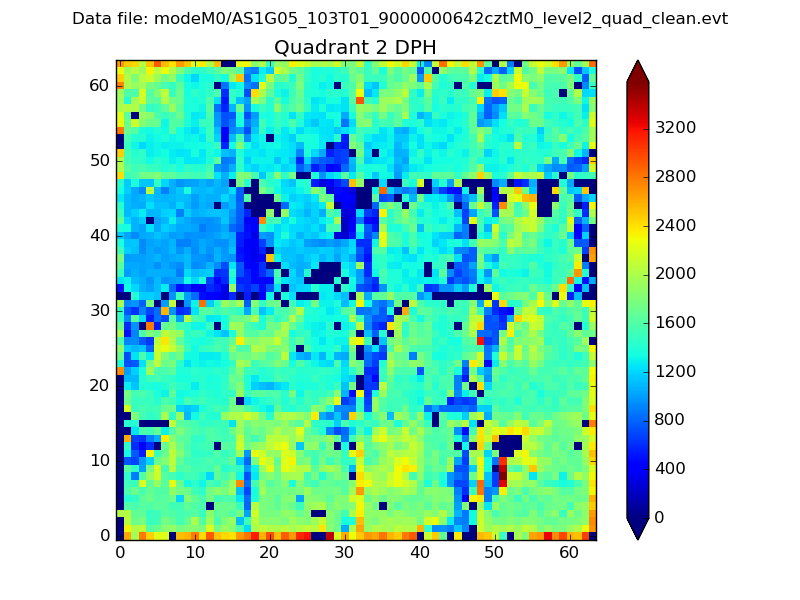 |
Quadrant C |
| Plot type | Count rate plots | Images |
|---|---|---|
| Comparison with Poisson distribution Blue bars denote a histogram of data divided into 1 sec bins. Red curve is a Poisson curve with rate = median count rate of data. |
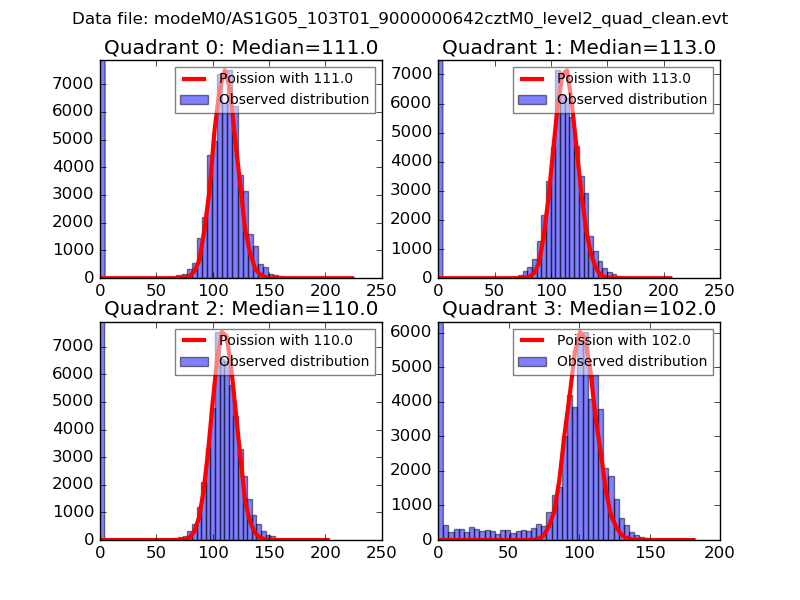 |
 |
| Quadrant-wise count rates Data is divided into 100 sec bins |
 |
|
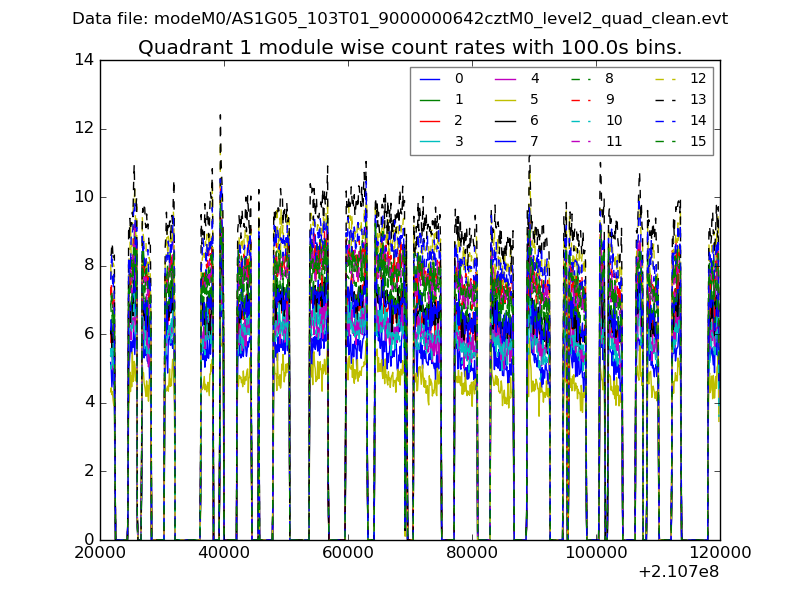
| Module-wise count rates for Quadrant A Data is divided into 100 sec bins |
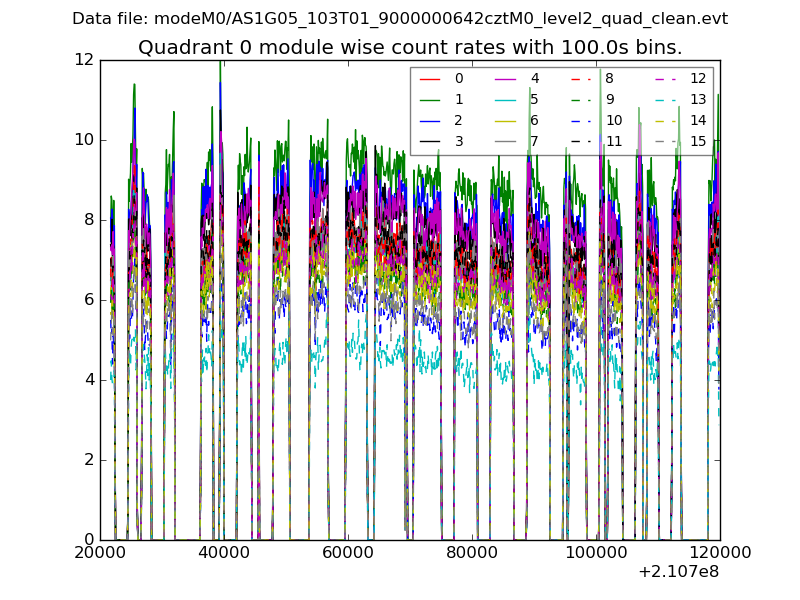 |
 |
| Module-wise count rates for Quadrant B Data is divided into 100 sec bins |
 |
 |
| Module-wise count rates for Quadrant C Data is divided into 100 sec bins |
 |
 |
| Module-wise count rates for Quadrant D Data is divided into 100 sec bins |
 |
 |
| Parameter | Plot |
|---|---|
| CZT HV Monitor |  |
| D_VDD | 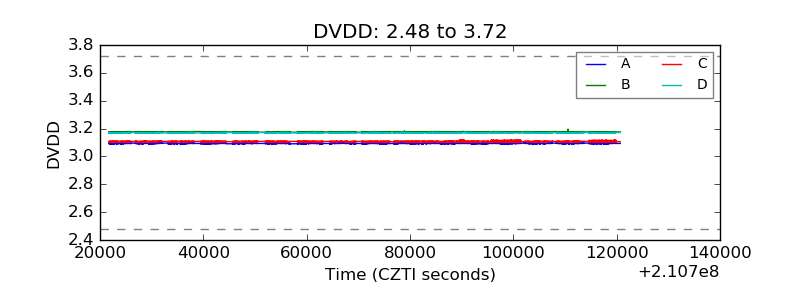 |
| Temperature 1 |  |
| Veto HV Monitor |  |
| Veto LLD | 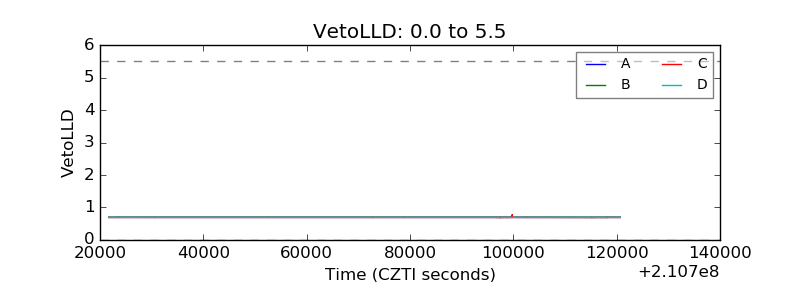 |
| Alpha Counter | 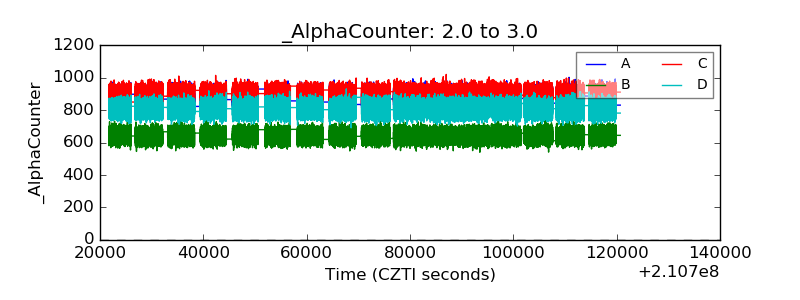 |
| _CPM_Rate |  |
| CZT Counter | 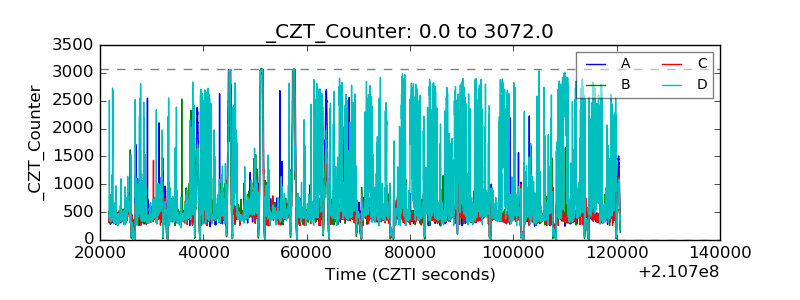 |
| +2.5 Volts monitor | 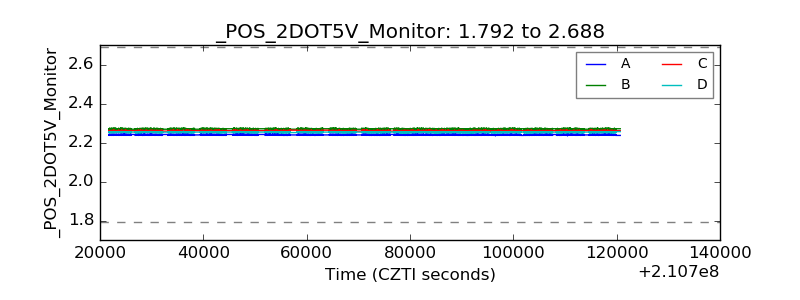 |
| +5 Volts monitor | 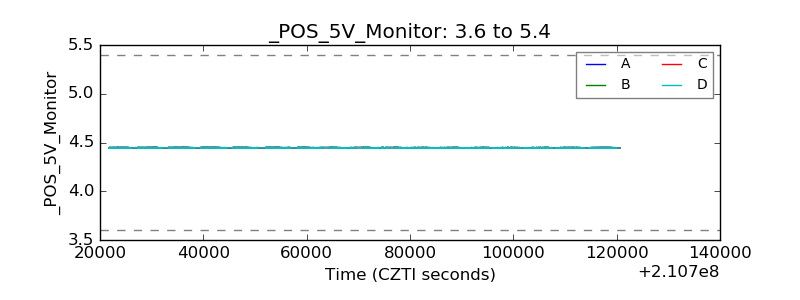 |
| _ROLL_ROT | 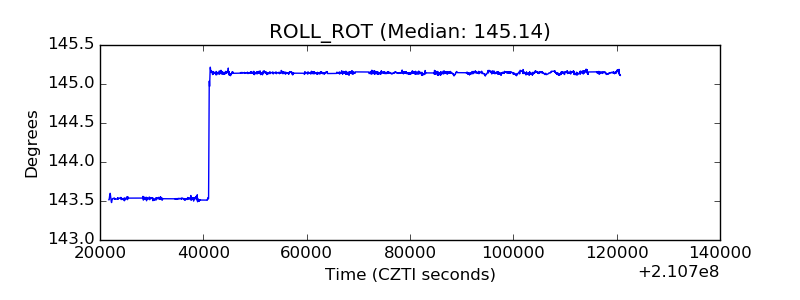 |
| _Roll_DEC | 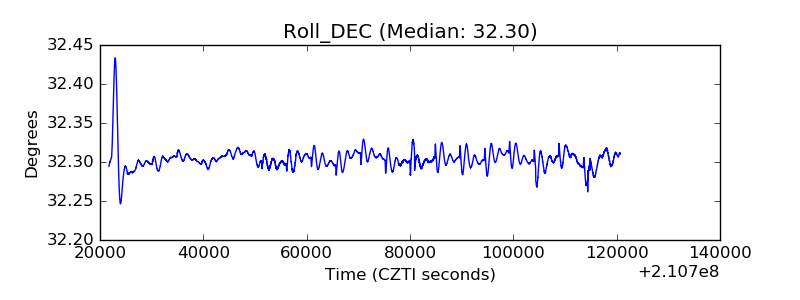 |
| _Roll_RA | 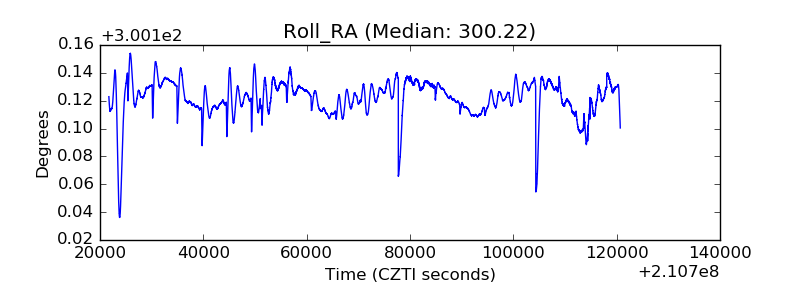 |
| Veto Counter |  |