| Param | Original file | Final file |
|---|---|---|
| Filename | modeM0/AS1G05_103T01_9000000642_05075cztM0_level2.evt | modeM0/AS1G05_103T01_9000000642_05075cztM0_level2_quad_clean.evt |
| Size (bytes) | 516,726,720 | 87,318,720 |
| Size | 492.8 MB | 83.3 MB |
| Events in quadrant A | 3,753,688 | 539,171 |
| Events in quadrant B | 3,492,732 | 550,010 |
| Events in quadrant C | 3,302,475 | 539,233 |
| Events in quadrant D | 4,600,656 | 503,561 |
| Mode SS | |||
|---|---|---|---|
| Quadrant | BADHDUFLAG | Total packets | Discarded packets |
| A | 0 | 154 | 0 |
| B | 0 | 154 | 0 |
| C | 0 | 154 | 0 |
| D | 0 | 154 | 0 |
| Mode M0 | |||
|---|---|---|---|
| Quadrant | BADHDUFLAG | Total packets | Discarded packets |
| A | 0 | 16253 | 3 |
| B | 0 | 15341 | 2 |
| C | 0 | 15000 | 2 |
| D | 0 | 18972 | 2 |
| Mode M9 | |||
|---|---|---|---|
| Quadrant | BADHDUFLAG | Total packets | Discarded packets |
| A | 0 | 16 | 0 |
| B | 0 | 16 | 0 |
| C | 0 | 16 | 0 |
| D | 0 | 16 | 0 |
| Quadrant | Total seconds | Saturated seconds | Saturation percentage |
|---|---|---|---|
| A | 7347 | 135 | 1.837485% |
| B | 7347 | 41 | 0.558051% |
| C | 7347 | 26 | 0.353886% |
| D | 7347 | 245 | 3.334694% |
Noise dominated data is calculated using 1-second bins in cleaned event files. If a bin has >2000 counts, and if more than 50% of those come from <1% of pixels, then it is considered to be noise-dominated and hence unusable.
| Quadrant | # 1 sec bins | Bins with >0 counts | Bins with >2000 counts | High rate bins dominated by noise | Noise dominated (total time) | Noise dominated (detector-on time) | Marked lightcurve |
|---|---|---|---|---|---|---|---|
| A | 9072 | 7349 | 80 | 80 | 0.88% | 1.09% | 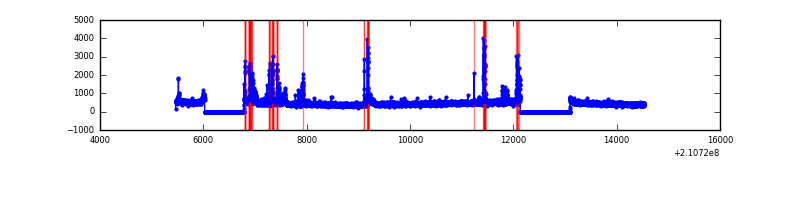 |
| B | 9072 | 7349 | 3 | 3 | 0.03% | 0.04% | 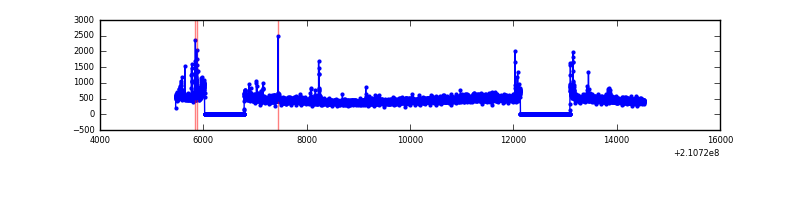 |
| C | 9072 | 7349 | 1 | 1 | 0.01% | 0.01% | 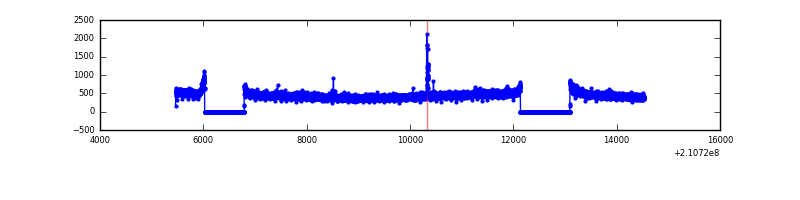 |
| D | 9072 | 7349 | 183 | 183 | 2.02% | 2.49% | 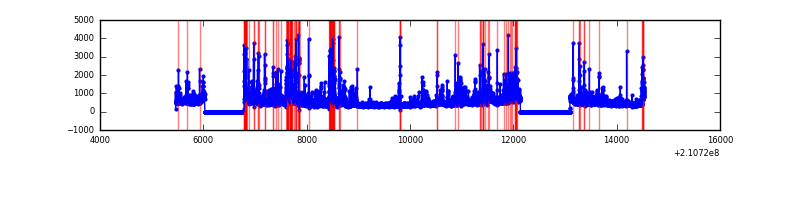 |
Top three noisy pixels from each quadrant. If the there are fewer than three noisy pixels in the level2.evt file, extra rows are filled as -1
| Pixel properties | Quadrant properties | ||||||
|---|---|---|---|---|---|---|---|
| Quadrant | DetID | PixID | Counts | Sigma | Mean | Median | Sigma |
| A | 0 | 50 | 190595 | 1105.1 | 842 | 823 | 171.7 |
| A | 15 | 174 | 176210 | 1021.33 | 842 | 823 | 171.7 |
| A | 0 | 247 | 119578 | 691.54 | 842 | 823 | 171.7 |
| B | 4 | 48 | 51676 | 304.51 | 859 | 839 | 166.9 |
| B | 0 | 219 | 42379 | 248.82 | 859 | 839 | 166.9 |
| B | 15 | 204 | 30892 | 180.02 | 859 | 839 | 166.9 |
| C | 9 | 54 | 33465 | 168.39 | 831 | 837 | 193.8 |
| C | 1 | 16 | 20973 | 103.92 | 831 | 837 | 193.8 |
| C | 13 | 61 | 6885 | 31.21 | 831 | 837 | 193.8 |
| D | 13 | 235 | 484041 | 2423.23 | 814 | 789 | 199.4 |
| D | 12 | 233 | 212197 | 1060.09 | 814 | 789 | 199.4 |
| D | 2 | 136 | 162777 | 812.28 | 814 | 789 | 199.4 |
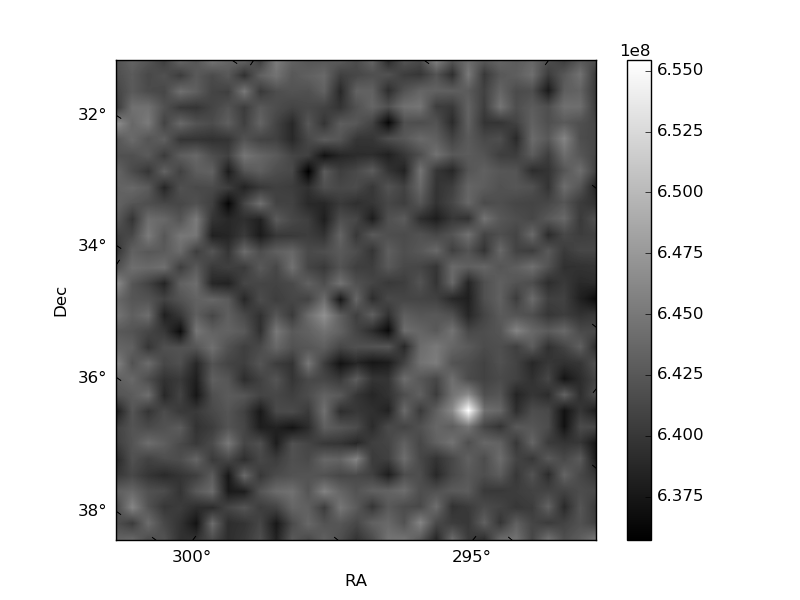
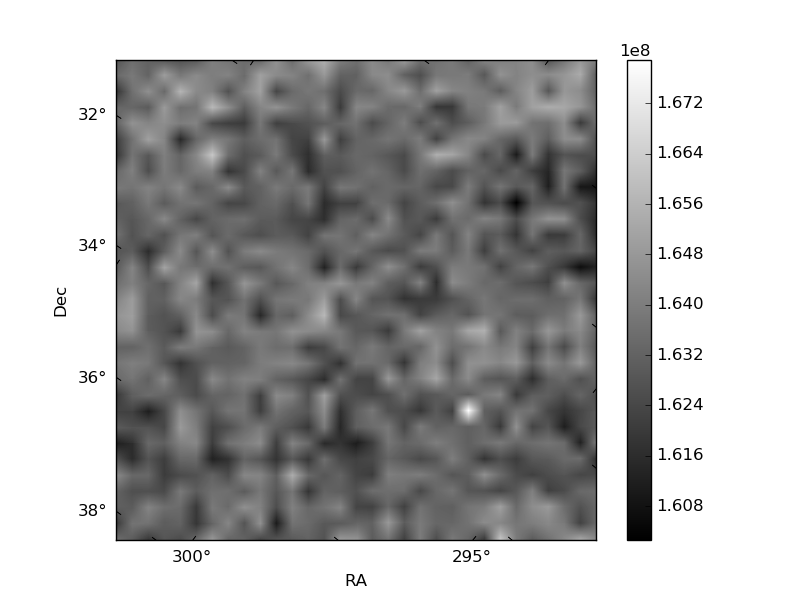
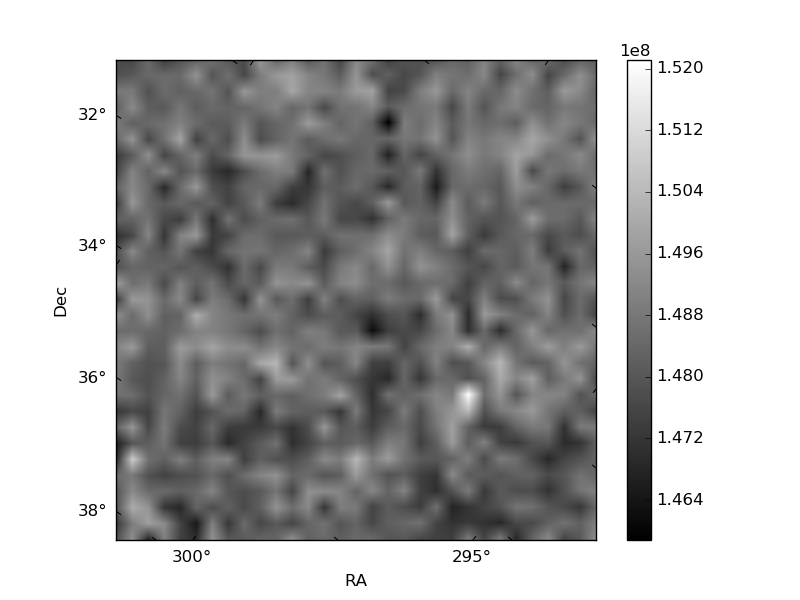
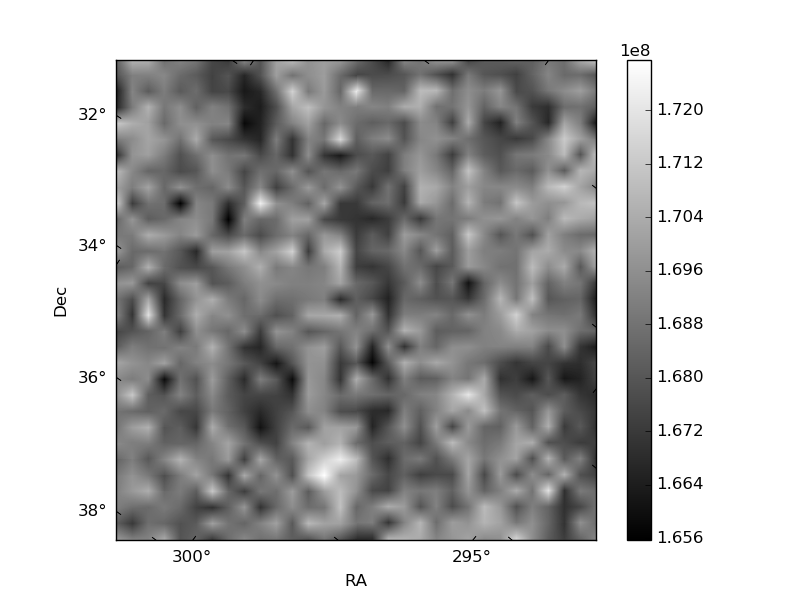
Histogram calculated using DETX and DETY for each event in the final _common_clean file
| Quadrant A | 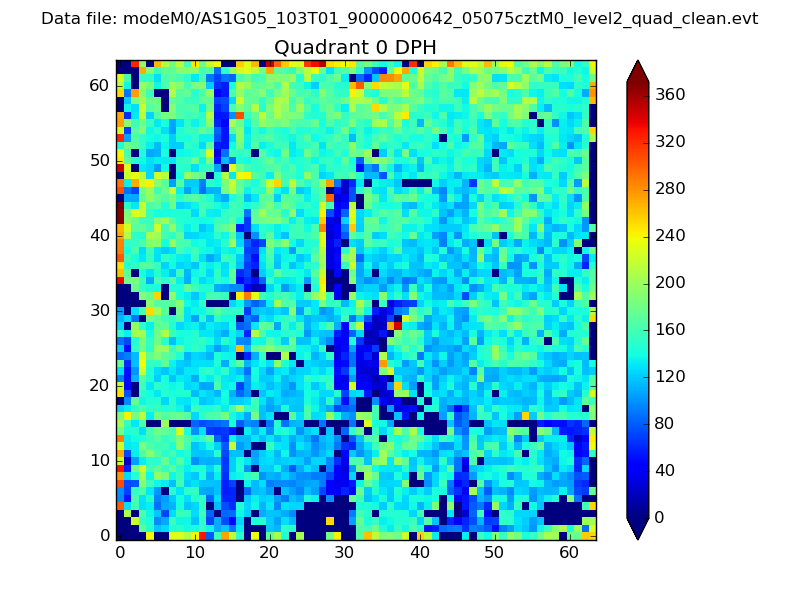 |
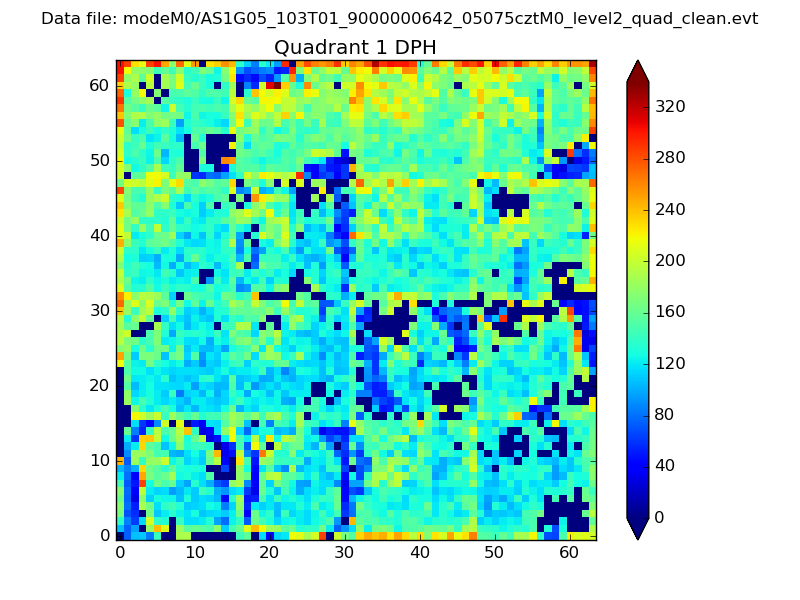 |
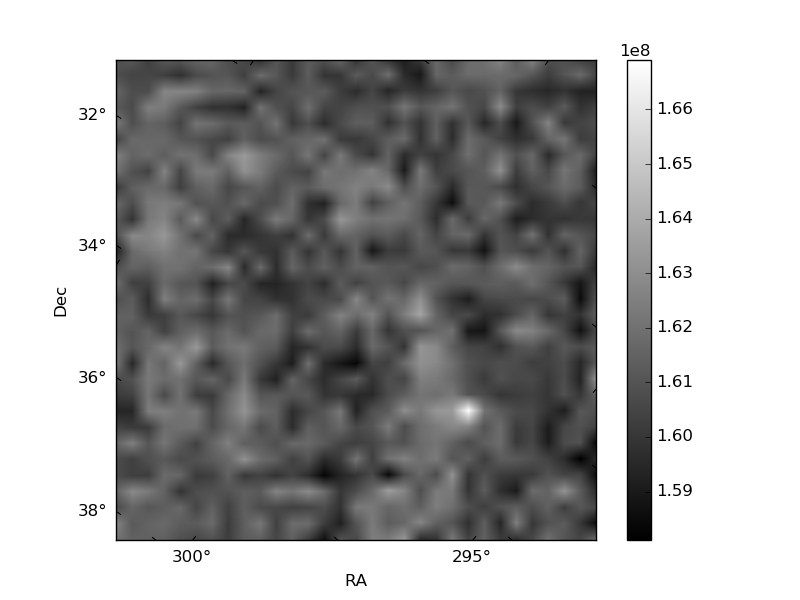
Quadrant B |
|---|---|---|---|
| Quadrant D | 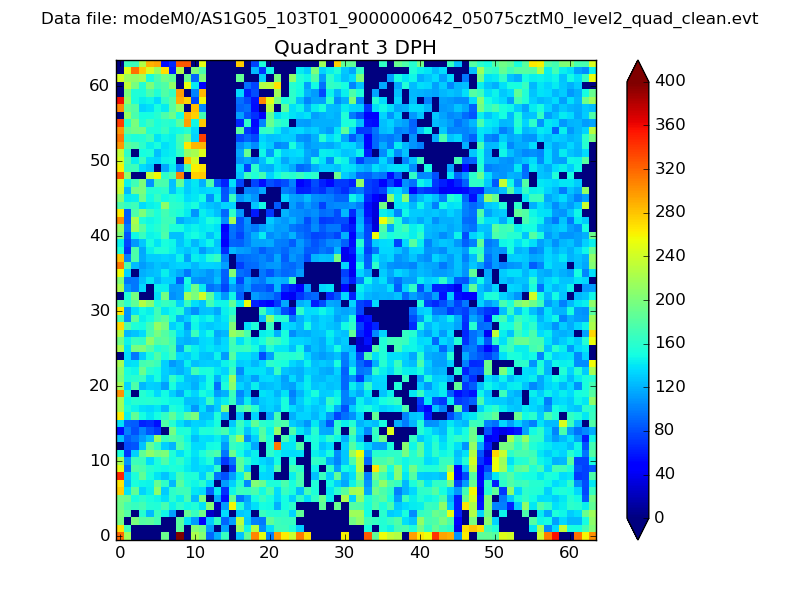 |
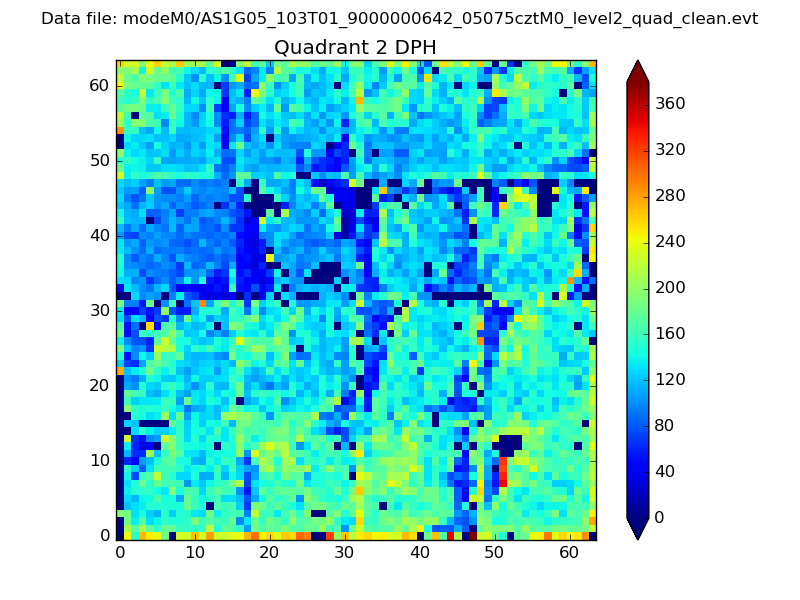 |
Quadrant C |
| Plot type | Count rate plots | Images |
|---|---|---|
| Comparison with Poisson distribution Blue bars denote a histogram of data divided into 1 sec bins. Red curve is a Poisson curve with rate = median count rate of data. |
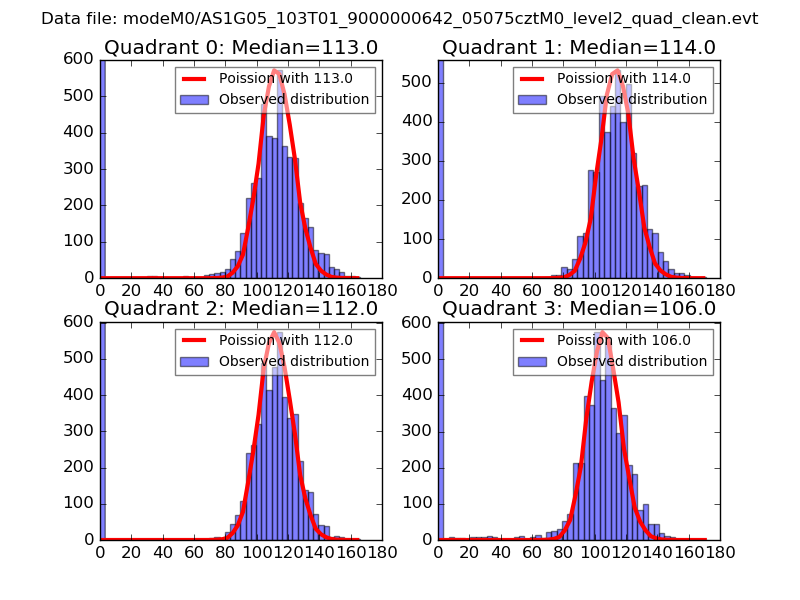 |
 |
| Quadrant-wise count rates Data is divided into 100 sec bins |
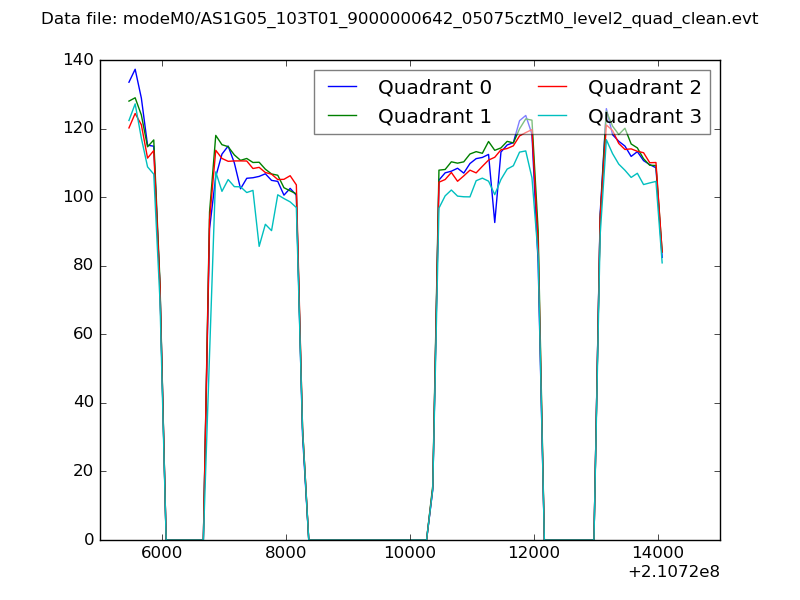 |
|
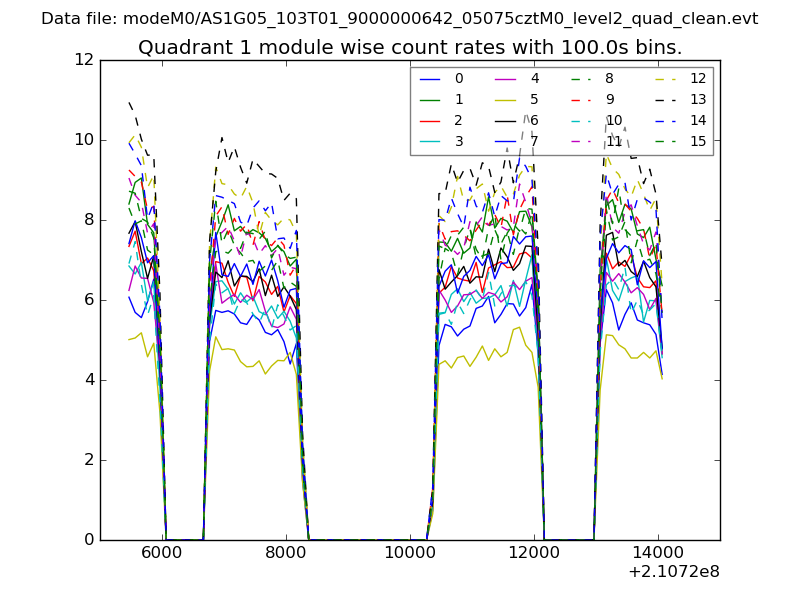
| Module-wise count rates for Quadrant A Data is divided into 100 sec bins |
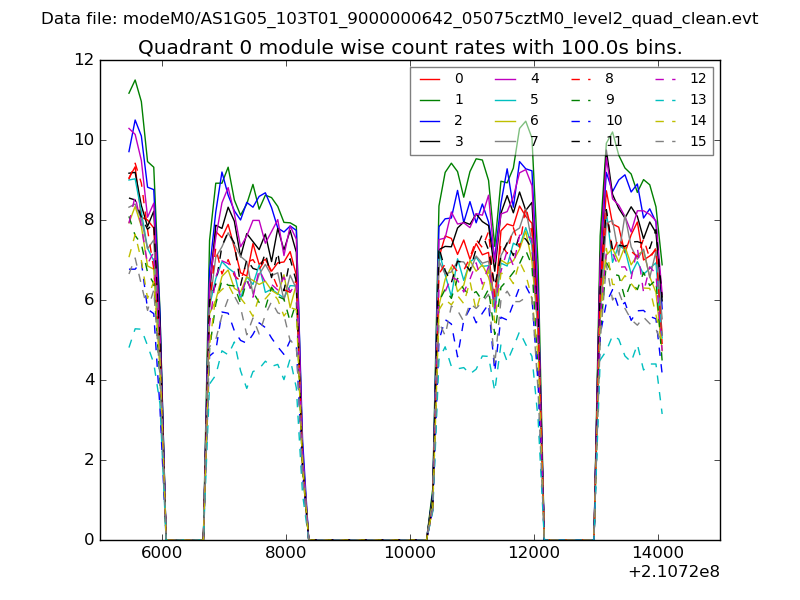 |
 |
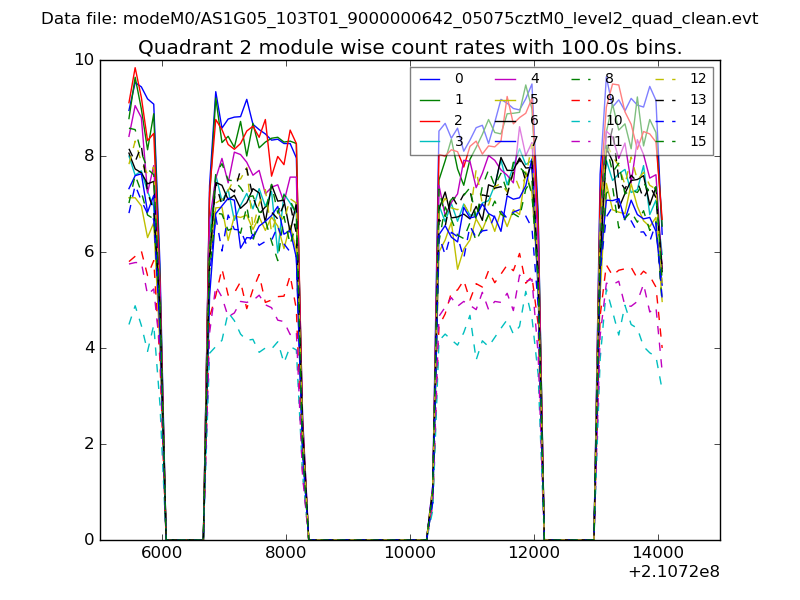
| Module-wise count rates for Quadrant B Data is divided into 100 sec bins |
 |
 |
| Module-wise count rates for Quadrant C Data is divided into 100 sec bins |
 |
 |
| Module-wise count rates for Quadrant D Data is divided into 100 sec bins |
 |
 |
| Parameter | Plot |
|---|---|
| CZT HV Monitor | 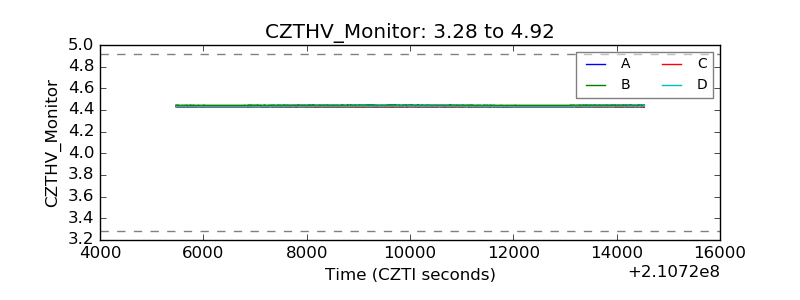 |
| D_VDD | 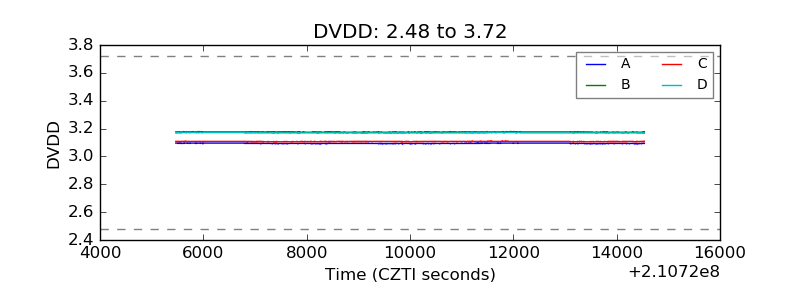 |
| Temperature 1 | 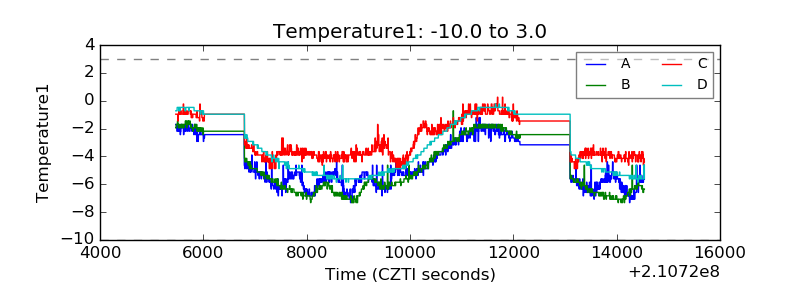 |
| Veto HV Monitor | 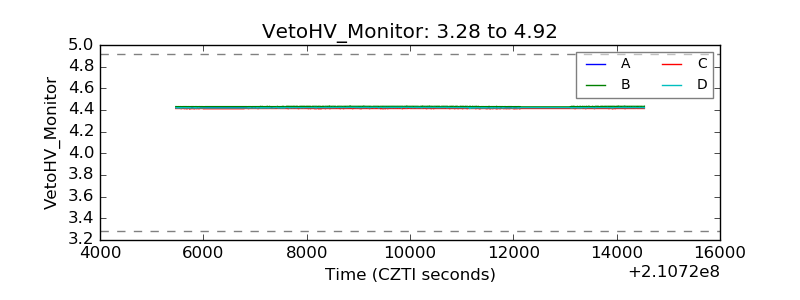 |
| Veto LLD | 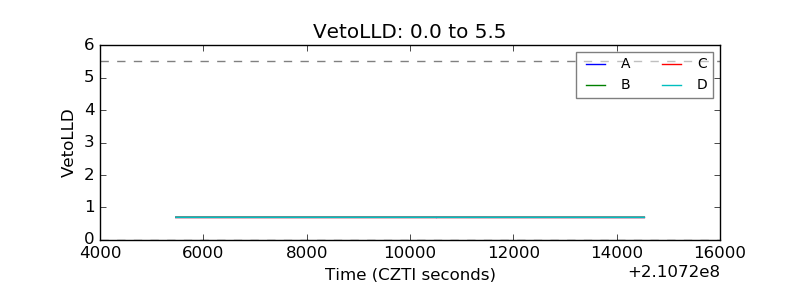 |
| Alpha Counter | 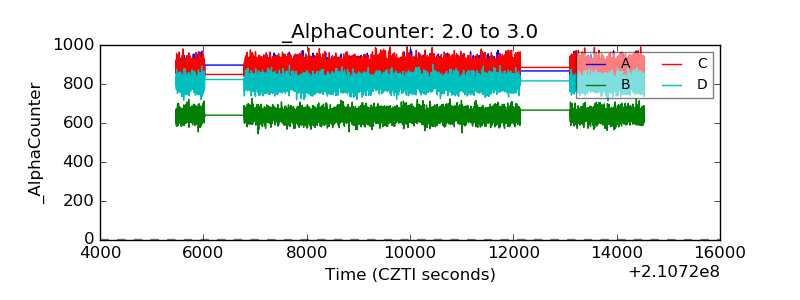 |
| _CPM_Rate | 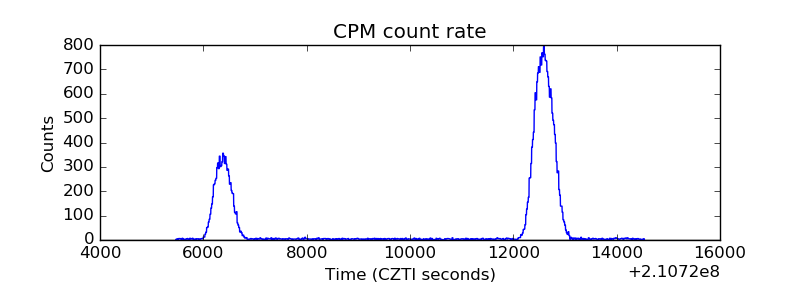 |
| CZT Counter | 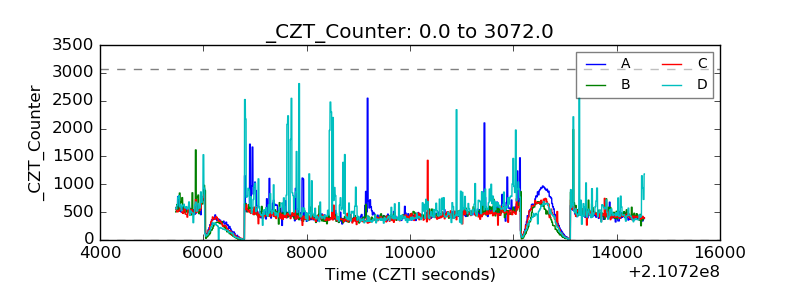 |
| +2.5 Volts monitor | 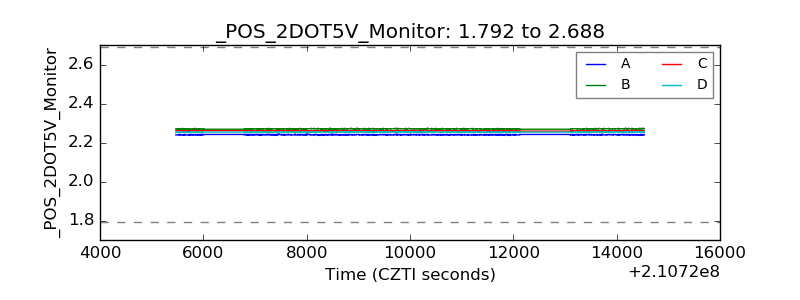 |
| +5 Volts monitor |  |
| _ROLL_ROT | 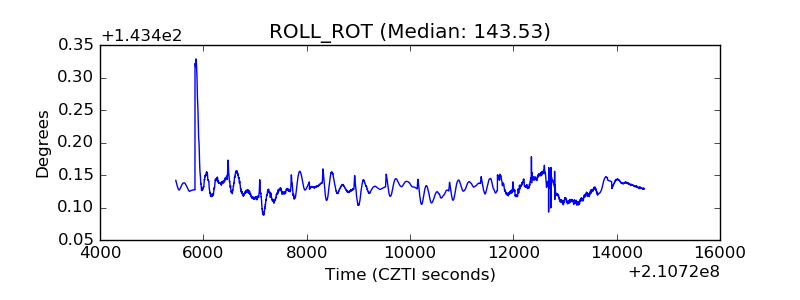 |
| _Roll_DEC | 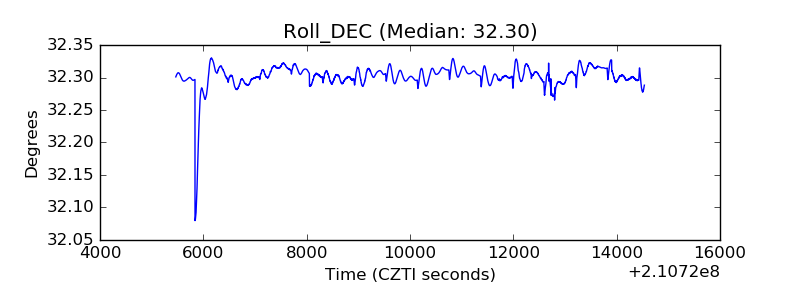 |
| _Roll_RA | 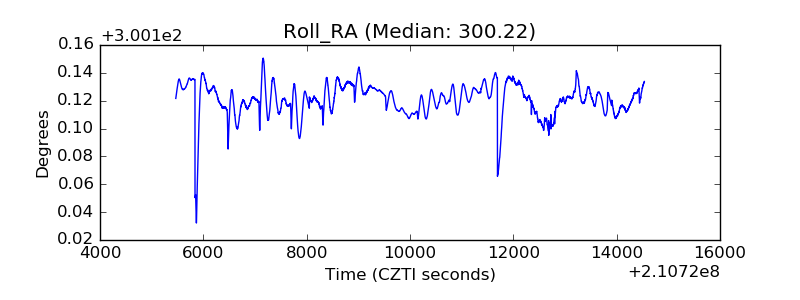 |
| Veto Counter | 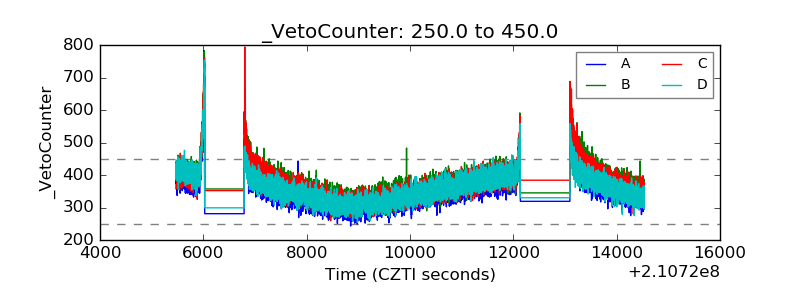 |