| Param | Original file | Final file |
|---|---|---|
| Filename | modeM0/AS1G05_103T01_9000000642_05077cztM0_level2.evt | modeM0/AS1G05_103T01_9000000642_05077cztM0_level2_quad_clean.evt |
| Size (bytes) | 477,241,920 | 70,816,320 |
| Size | 455.1 MB | 67.5 MB |
| Events in quadrant A | 2,972,123 | 431,107 |
| Events in quadrant B | 3,247,165 | 435,705 |
| Events in quadrant C | 2,931,124 | 426,379 |
| Events in quadrant D | 4,855,243 | 391,483 |
| Mode SS | |||
|---|---|---|---|
| Quadrant | BADHDUFLAG | Total packets | Discarded packets |
| A | 0 | 138 | 0 |
| B | 0 | 138 | 0 |
| C | 0 | 138 | 0 |
| D | 0 | 138 | 0 |
| Mode M0 | |||
|---|---|---|---|
| Quadrant | BADHDUFLAG | Total packets | Discarded packets |
| A | 0 | 13435 | 9 |
| B | 0 | 14052 | 2 |
| C | 0 | 13416 | 4 |
| D | 0 | 19119 | 4 |
| Mode M9 | |||
|---|---|---|---|
| Quadrant | BADHDUFLAG | Total packets | Discarded packets |
| A | 0 | 20 | 0 |
| B | 0 | 20 | 0 |
| C | 0 | 20 | 0 |
| D | 0 | 20 | 0 |
| Quadrant | Total seconds | Saturated seconds | Saturation percentage |
|---|---|---|---|
| A | 6580 | 29 | 0.440729% |
| B | 6583 | 49 | 0.744341% |
| C | 6582 | 16 | 0.243087% |
| D | 6582 | 441 | 6.700091% |
Noise dominated data is calculated using 1-second bins in cleaned event files. If a bin has >2000 counts, and if more than 50% of those come from <1% of pixels, then it is considered to be noise-dominated and hence unusable.
| Quadrant | # 1 sec bins | Bins with >0 counts | Bins with >2000 counts | High rate bins dominated by noise | Noise dominated (total time) | Noise dominated (detector-on time) | Marked lightcurve |
|---|---|---|---|---|---|---|---|
| A | 8633 | 6584 | 1 | 1 | 0.01% | 0.02% | 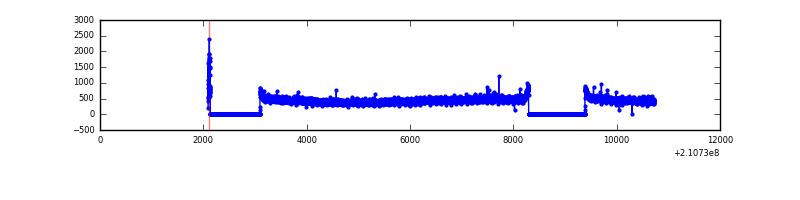 |
| B | 8633 | 6585 | 12 | 12 | 0.14% | 0.18% | 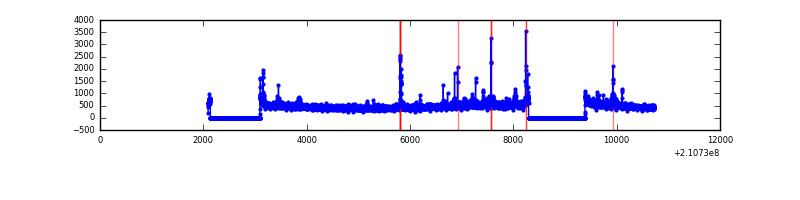 |
| C | 8633 | 6585 | 0 | 0 | 0.00% | 0.00% | 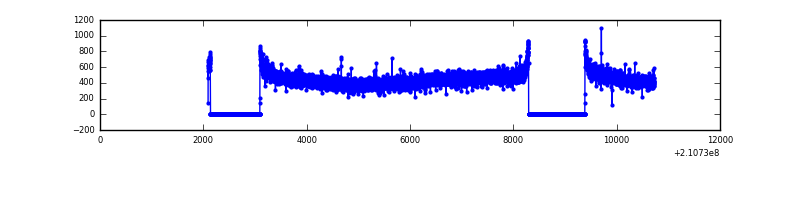 |
| D | 8633 | 6585 | 404 | 404 | 4.68% | 6.14% | 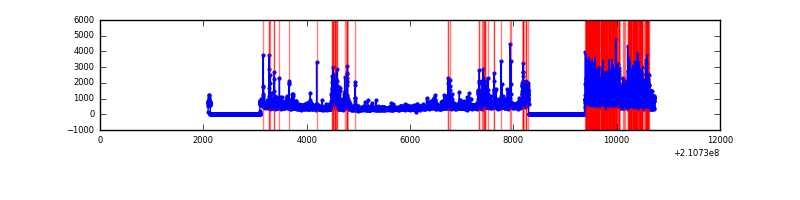 |
Top three noisy pixels from each quadrant. If the there are fewer than three noisy pixels in the level2.evt file, extra rows are filled as -1
| Pixel properties | Quadrant properties | ||||||
|---|---|---|---|---|---|---|---|
| Quadrant | DetID | PixID | Counts | Sigma | Mean | Median | Sigma |
| A | 15 | 174 | 19743 | 123.52 | 762 | 747 | 153.8 |
| A | 13 | 251 | 14851 | 91.71 | 762 | 747 | 153.8 |
| A | 0 | 226 | 7670 | 45.02 | 762 | 747 | 153.8 |
| B | 15 | 204 | 85801 | 579.2 | 772 | 756 | 146.8 |
| B | 0 | 219 | 67819 | 456.73 | 772 | 756 | 146.8 |
| B | 5 | 200 | 47875 | 320.9 | 772 | 756 | 146.8 |
| C | 1 | 16 | 16358 | 90.43 | 744 | 749 | 172.6 |
| C | 13 | 61 | 6136 | 31.21 | 744 | 749 | 172.6 |
| C | 14 | 67 | 5285 | 26.28 | 744 | 749 | 172.6 |
| D | 7 | 237 | 1190582 | 6675.86 | 723 | 701 | 178.2 |
| D | 12 | 233 | 148264 | 827.91 | 723 | 701 | 178.2 |
| D | 13 | 239 | 140148 | 782.37 | 723 | 701 | 178.2 |
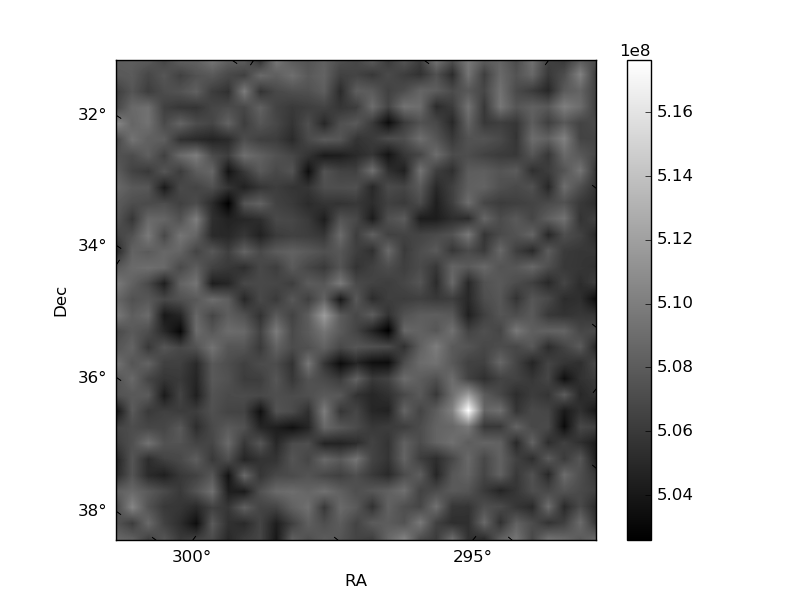
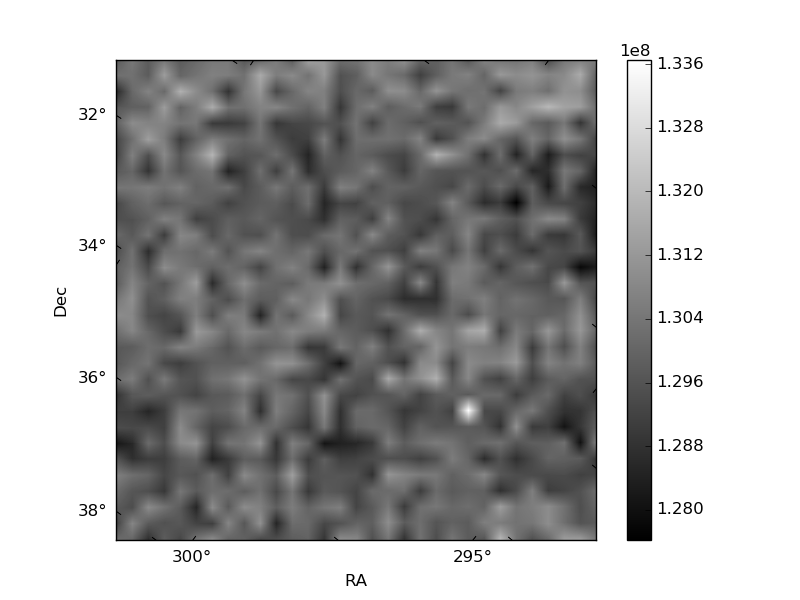
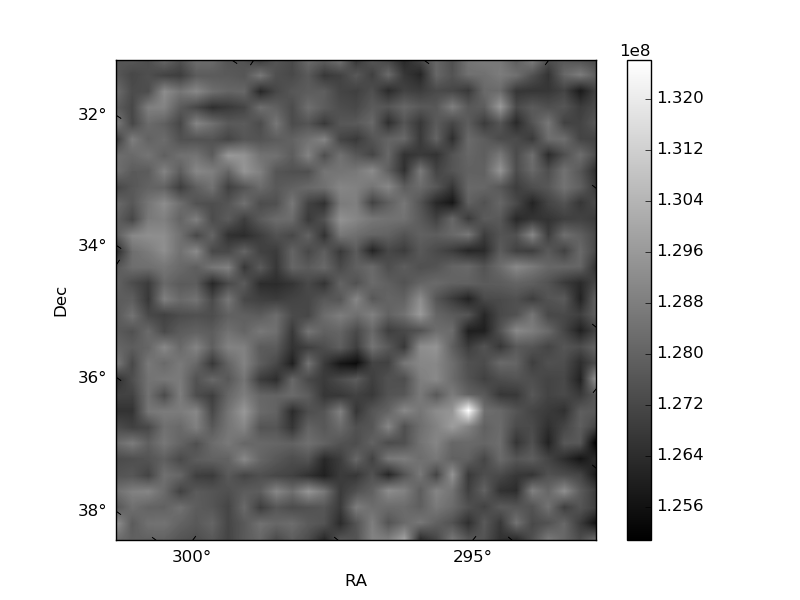
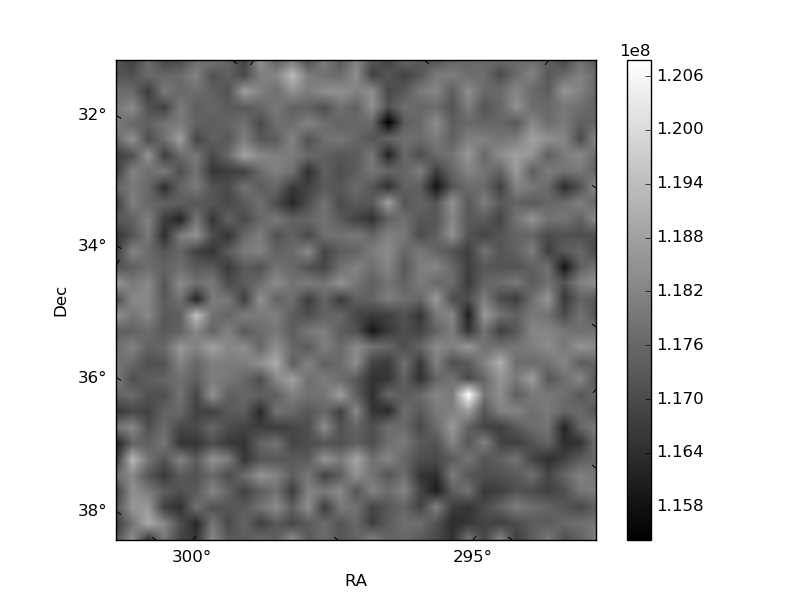
Histogram calculated using DETX and DETY for each event in the final _common_clean file
| Quadrant A | 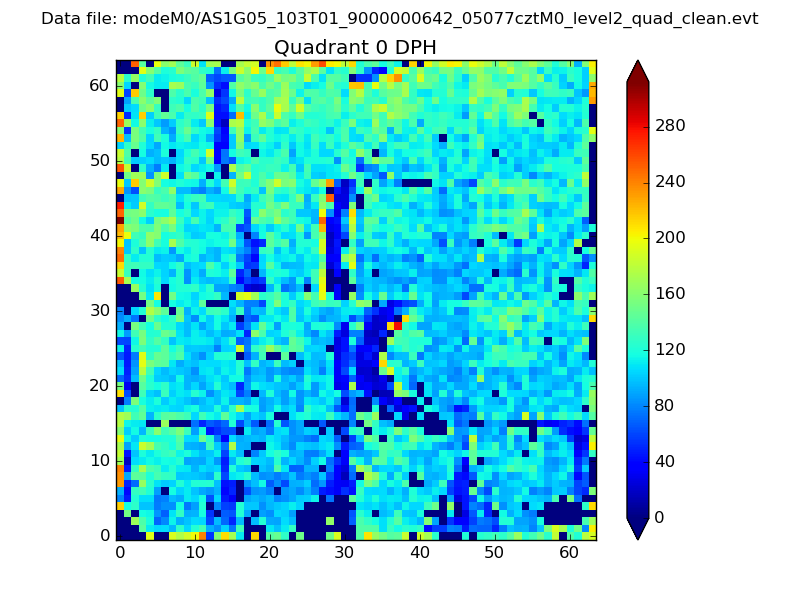 |
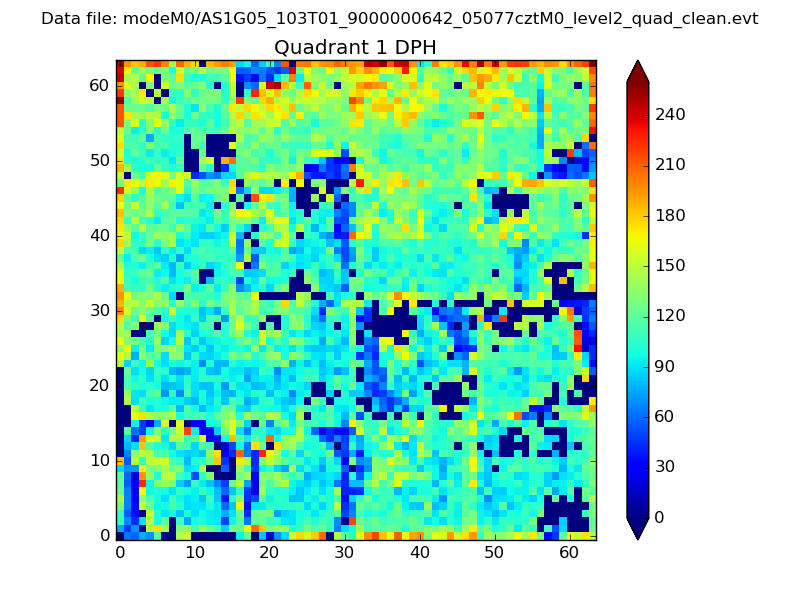 |
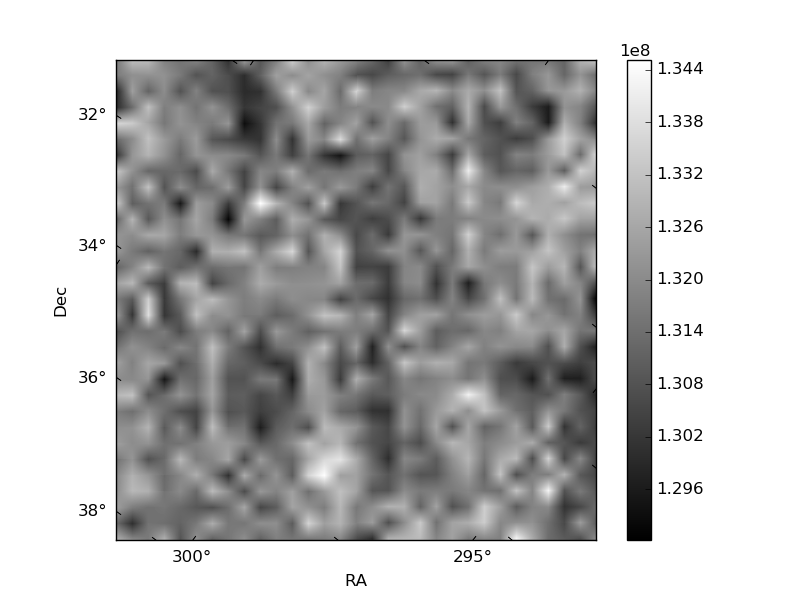
Quadrant B |
|---|---|---|---|
| Quadrant D | 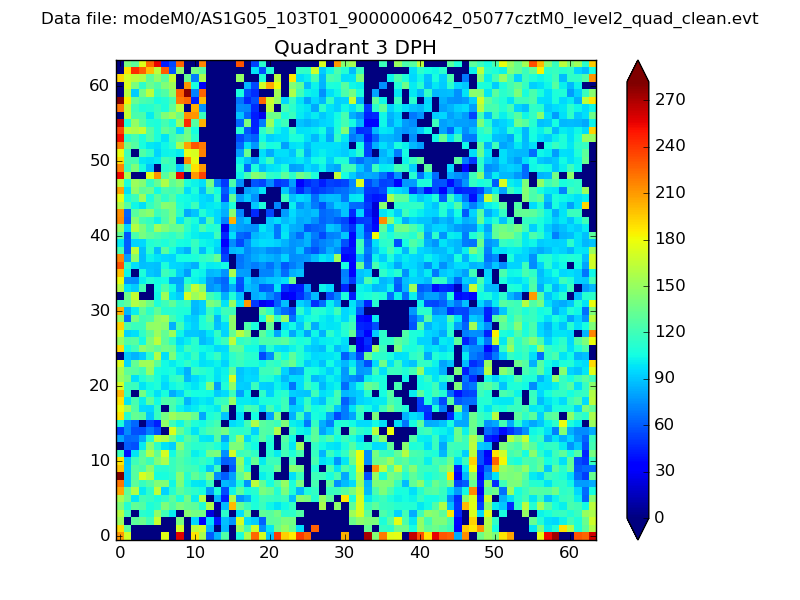 |
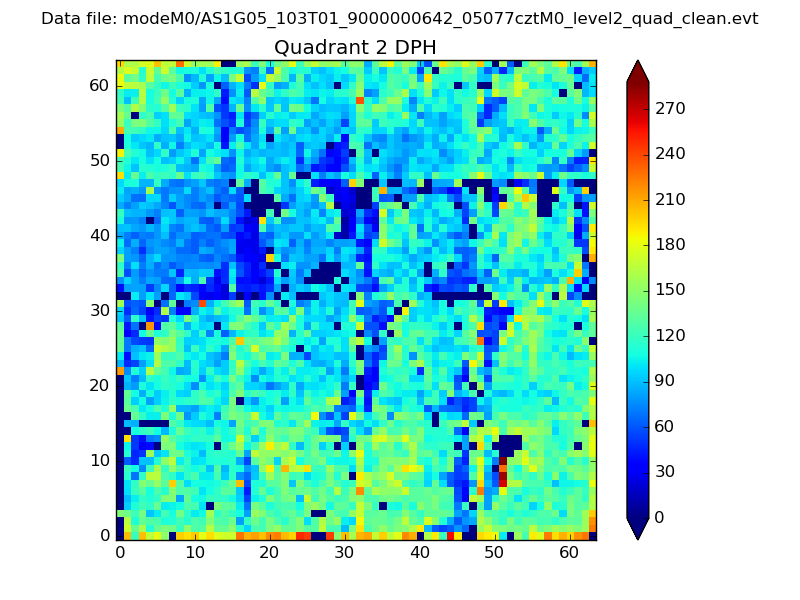 |
Quadrant C |
| Plot type | Count rate plots | Images |
|---|---|---|
| Comparison with Poisson distribution Blue bars denote a histogram of data divided into 1 sec bins. Red curve is a Poisson curve with rate = median count rate of data. |
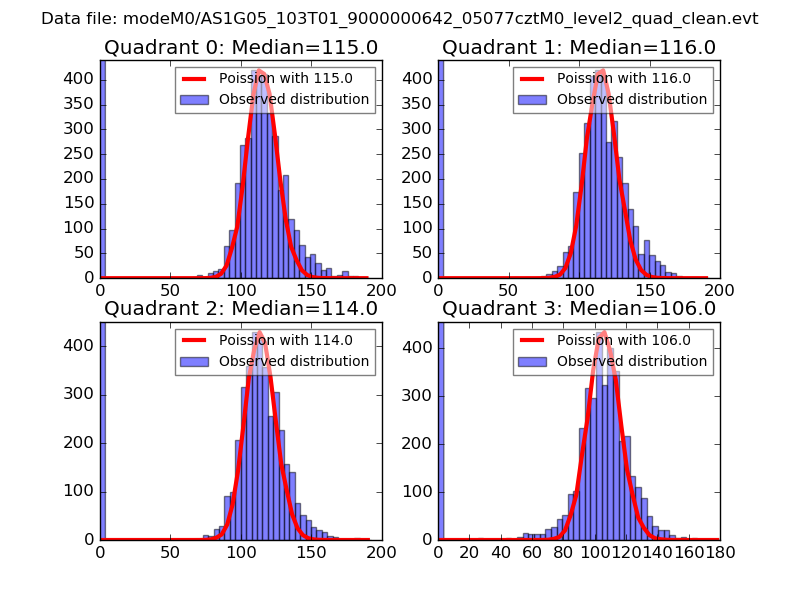 |
 |
| Quadrant-wise count rates Data is divided into 100 sec bins |
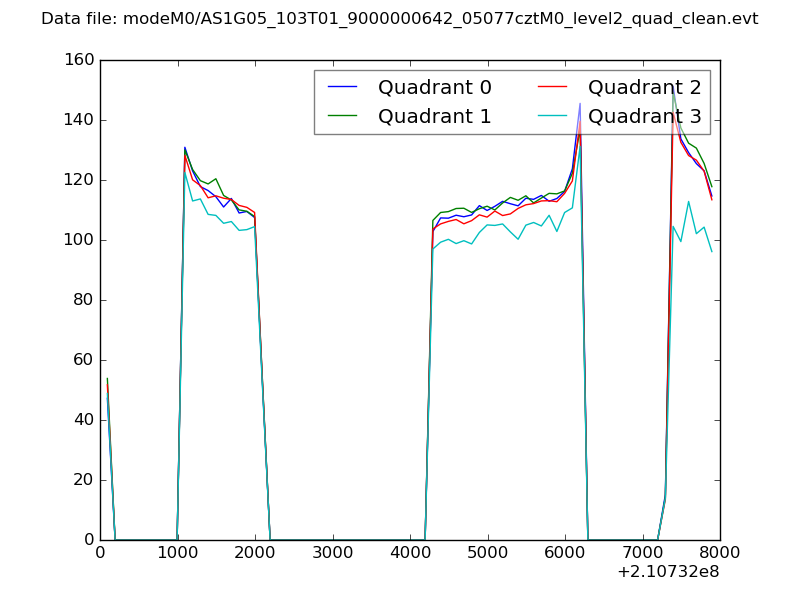 |
|
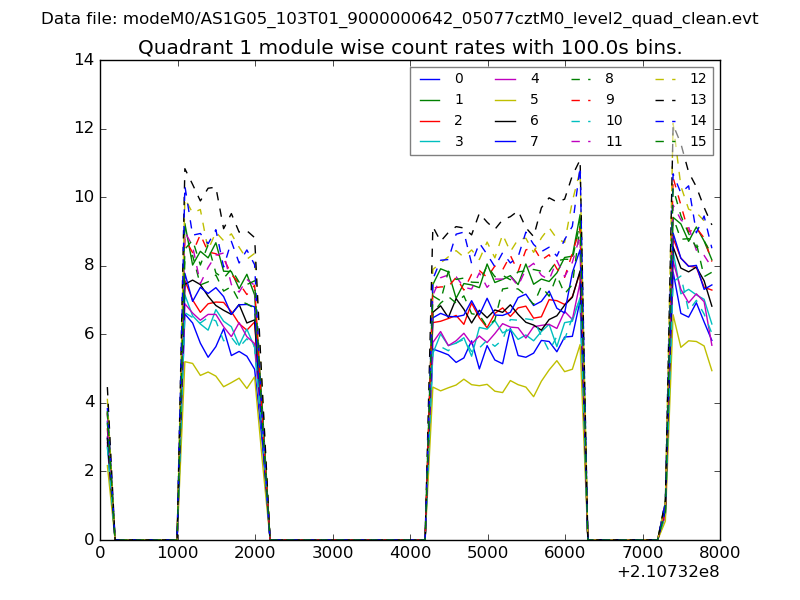
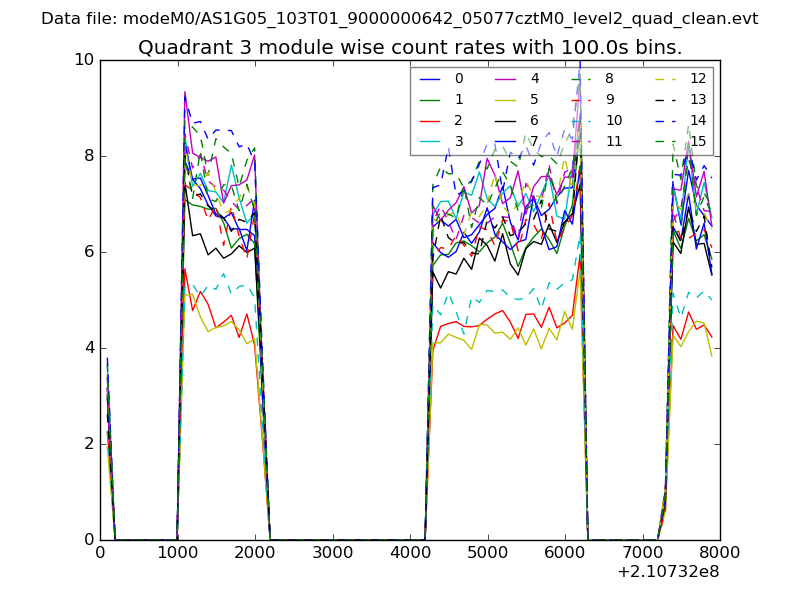
| Module-wise count rates for Quadrant A Data is divided into 100 sec bins |
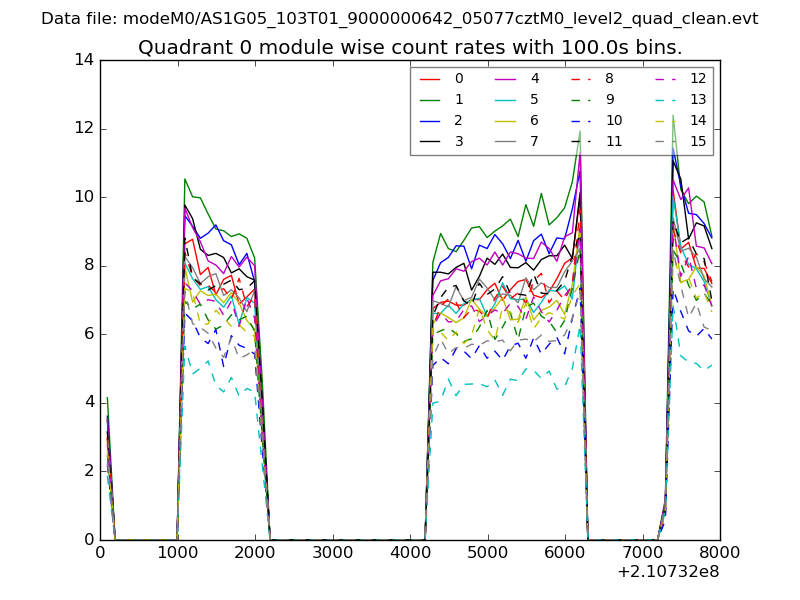 |
 |
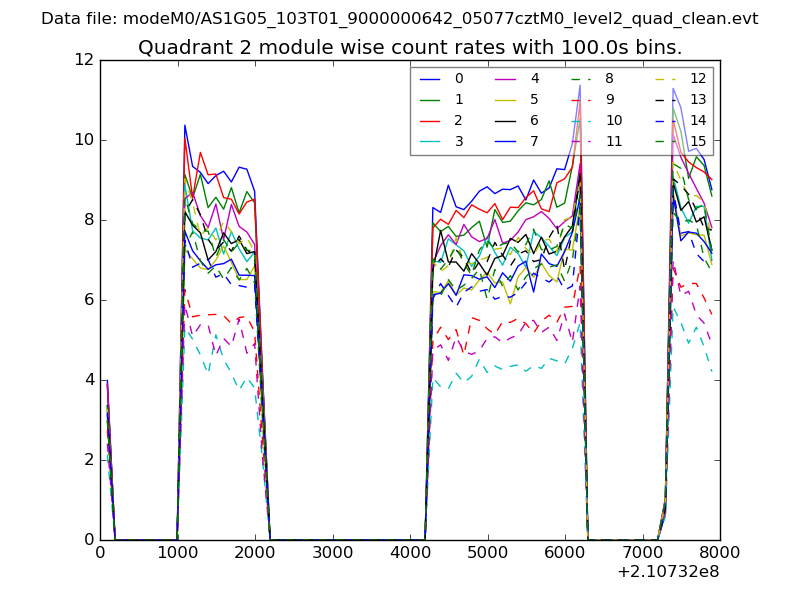
| Module-wise count rates for Quadrant B Data is divided into 100 sec bins |
 |
 |
| Module-wise count rates for Quadrant C Data is divided into 100 sec bins |
 |
 |
| Module-wise count rates for Quadrant D Data is divided into 100 sec bins |
 |
 |
| Parameter | Plot |
|---|---|
| CZT HV Monitor |  |
| D_VDD | 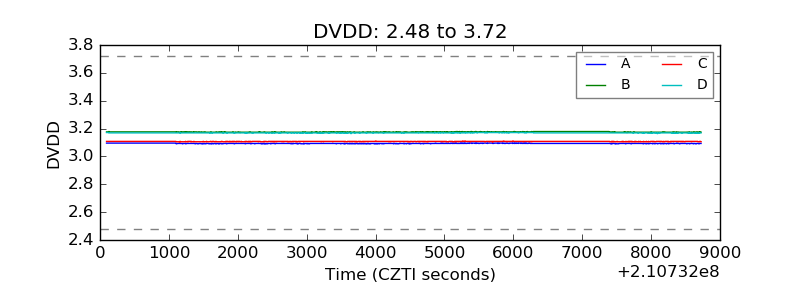 |
| Temperature 1 |  |
| Veto HV Monitor | 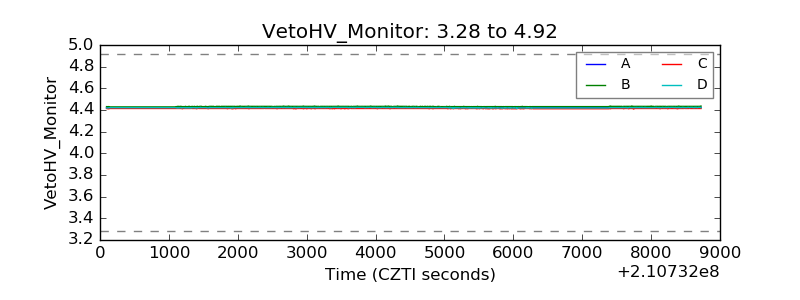 |
| Veto LLD | 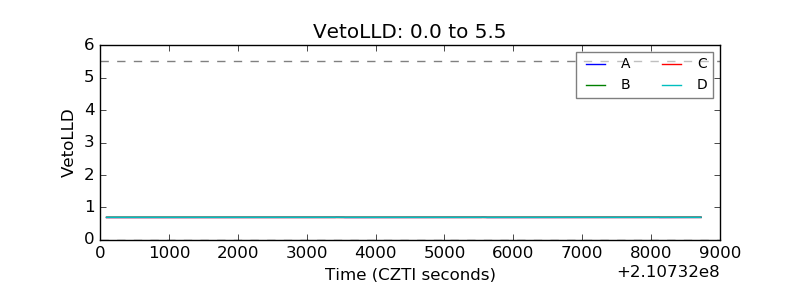 |
| Alpha Counter | 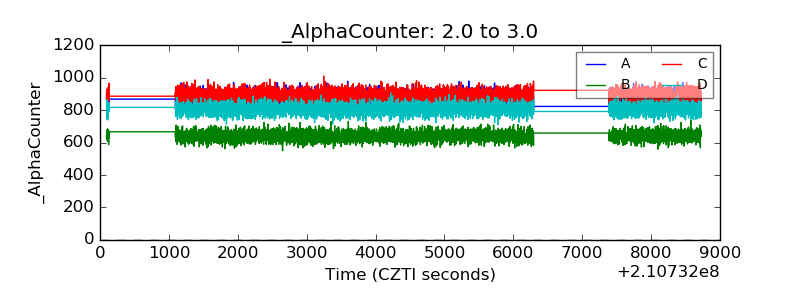 |
| _CPM_Rate | 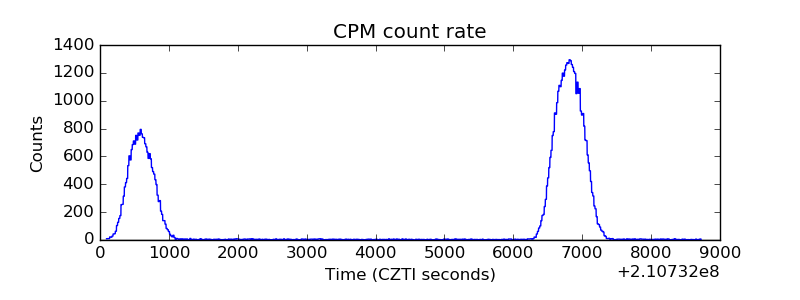 |
| CZT Counter | 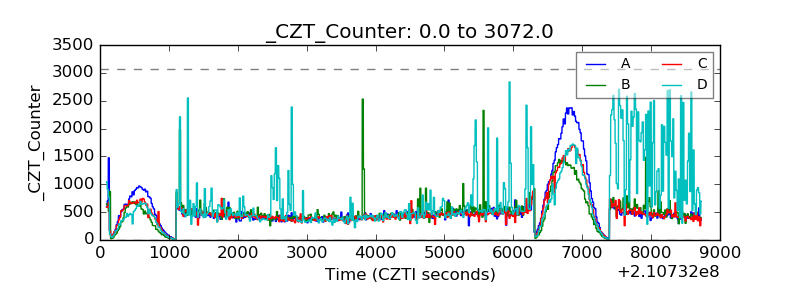 |
| +2.5 Volts monitor | 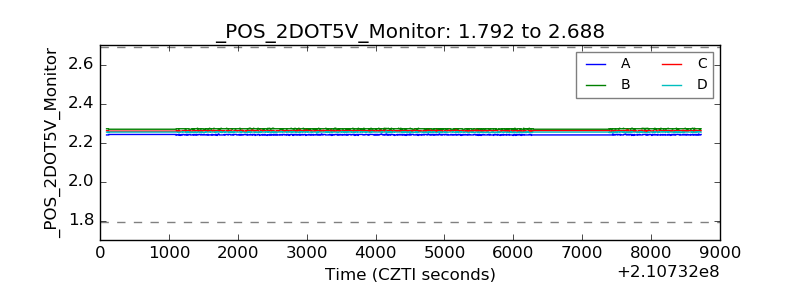 |
| +5 Volts monitor |  |
| _ROLL_ROT | 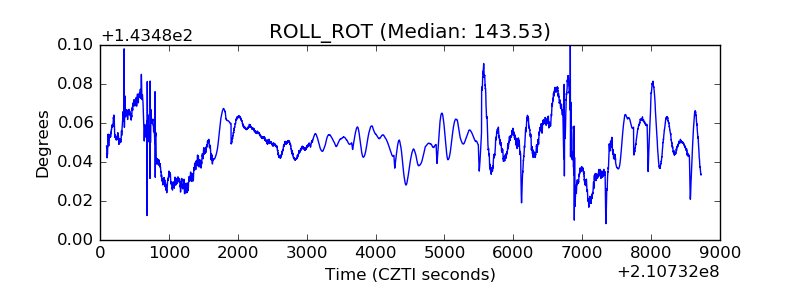 |
| _Roll_DEC | 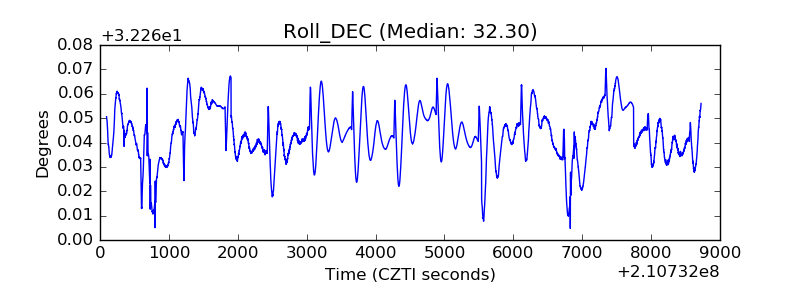 |
| _Roll_RA | 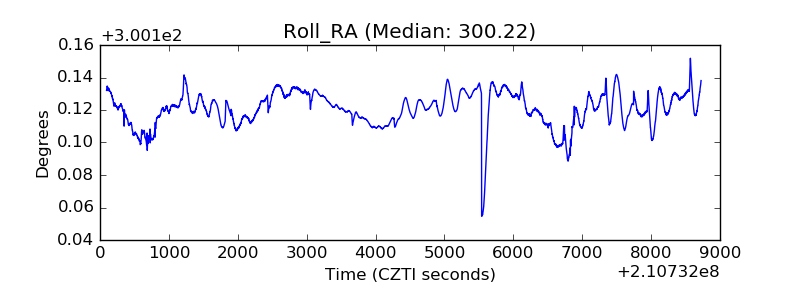 |
| Veto Counter | 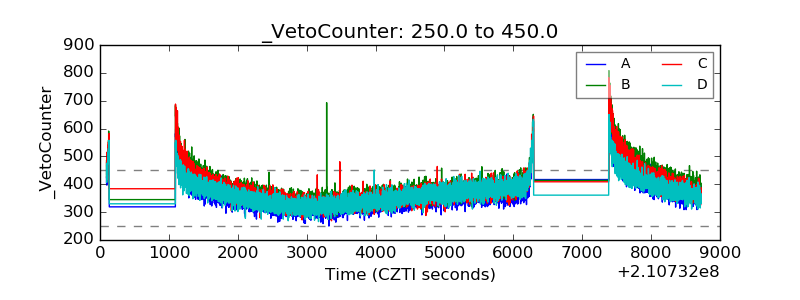 |