| Param | Original file | Final file |
|---|---|---|
| Filename | modeM0/AS1G05_103T01_9000000642_05079cztM0_level2.evt | modeM0/AS1G05_103T01_9000000642_05079cztM0_level2_quad_clean.evt |
| Size (bytes) | 477,624,960 | 56,911,680 |
| Size | 455.5 MB | 54.3 MB |
| Events in quadrant A | 3,122,295 | 325,833 |
| Events in quadrant B | 3,703,248 | 328,271 |
| Events in quadrant C | 3,023,779 | 320,359 |
| Events in quadrant D | 4,178,834 | 299,625 |
| Mode SS | |||
|---|---|---|---|
| Quadrant | BADHDUFLAG | Total packets | Discarded packets |
| A | 0 | 130 | 0 |
| B | 0 | 130 | 0 |
| C | 0 | 130 | 0 |
| D | 0 | 130 | 0 |
| Mode M0 | |||
|---|---|---|---|
| Quadrant | BADHDUFLAG | Total packets | Discarded packets |
| A | 0 | 13318 | 2 |
| B | 0 | 14999 | 1 |
| C | 0 | 13129 | 1 |
| D | 0 | 16893 | 1 |
| Mode M9 | |||
|---|---|---|---|
| Quadrant | BADHDUFLAG | Total packets | Discarded packets |
| A | 0 | 13 | 0 |
| B | 0 | 13 | 0 |
| C | 0 | 13 | 0 |
| D | 0 | 13 | 0 |
| Quadrant | Total seconds | Saturated seconds | Saturation percentage |
|---|---|---|---|
| A | 6435 | 25 | 0.388500% |
| B | 6435 | 33 | 0.512821% |
| C | 6435 | 8 | 0.124320% |
| D | 6435 | 171 | 2.657343% |
Noise dominated data is calculated using 1-second bins in cleaned event files. If a bin has >2000 counts, and if more than 50% of those come from <1% of pixels, then it is considered to be noise-dominated and hence unusable.
| Quadrant | # 1 sec bins | Bins with >0 counts | Bins with >2000 counts | High rate bins dominated by noise | Noise dominated (total time) | Noise dominated (detector-on time) | Marked lightcurve |
|---|---|---|---|---|---|---|---|
| A | 7740 | 6436 | 1 | 1 | 0.01% | 0.02% | 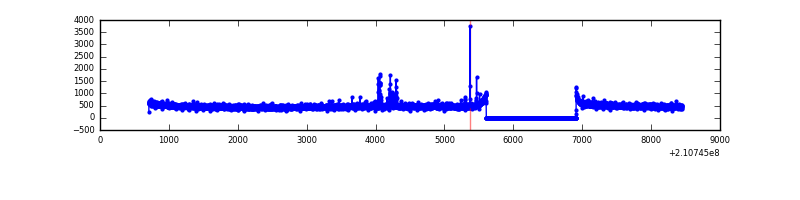 |
| B | 7740 | 6436 | 4 | 4 | 0.05% | 0.06% | 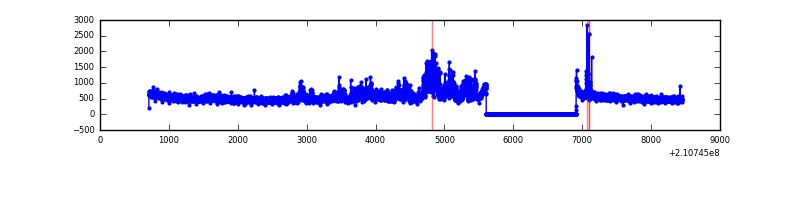 |
| C | 7740 | 6436 | 0 | 0 | 0.00% | 0.00% | 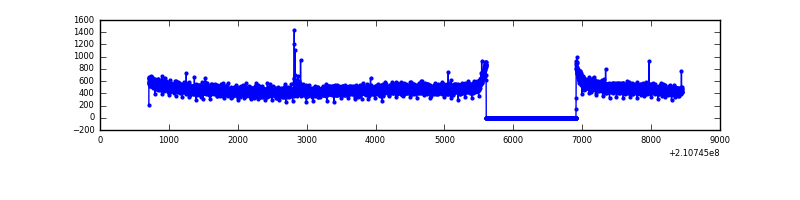 |
| D | 7740 | 6436 | 144 | 144 | 1.86% | 2.24% | 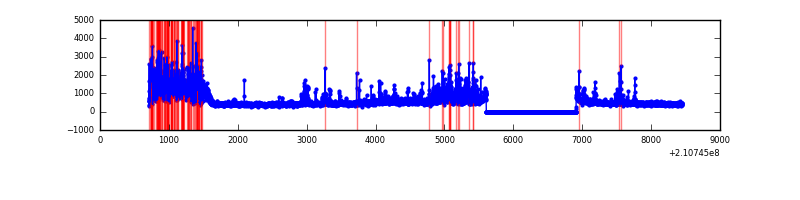 |
Top three noisy pixels from each quadrant. If the there are fewer than three noisy pixels in the level2.evt file, extra rows are filled as -1
| Pixel properties | Quadrant properties | ||||||
|---|---|---|---|---|---|---|---|
| Quadrant | DetID | PixID | Counts | Sigma | Mean | Median | Sigma |
| A | 0 | 50 | 49768 | 305.28 | 795 | 779 | 160.5 |
| A | 13 | 251 | 15157 | 89.6 | 795 | 779 | 160.5 |
| A | 0 | 226 | 7945 | 44.66 | 795 | 779 | 160.5 |
| B | 8 | 3 | 505560 | 3289.91 | 807 | 792 | 153.4 |
| B | 15 | 204 | 32975 | 209.76 | 807 | 792 | 153.4 |
| B | 0 | 230 | 18744 | 117.01 | 807 | 792 | 153.4 |
| C | 9 | 54 | 10048 | 52.47 | 767 | 773 | 176.8 |
| C | 1 | 16 | 9363 | 48.6 | 767 | 773 | 176.8 |
| C | 14 | 67 | 7696 | 39.17 | 767 | 773 | 176.8 |
| D | 13 | 235 | 1001746 | 5437.8 | 754 | 733 | 184.1 |
| D | 10 | 15 | 83104 | 447.46 | 754 | 733 | 184.1 |
| D | 12 | 233 | 69885 | 375.65 | 754 | 733 | 184.1 |
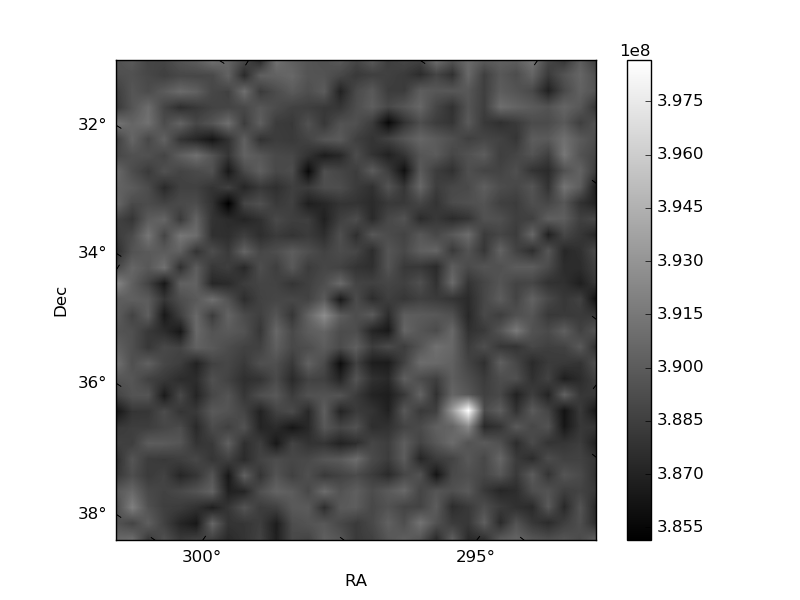
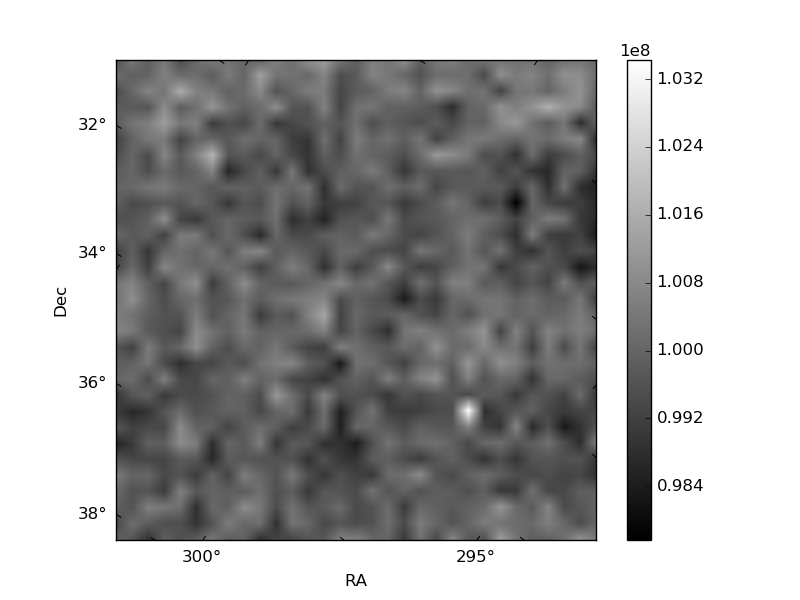
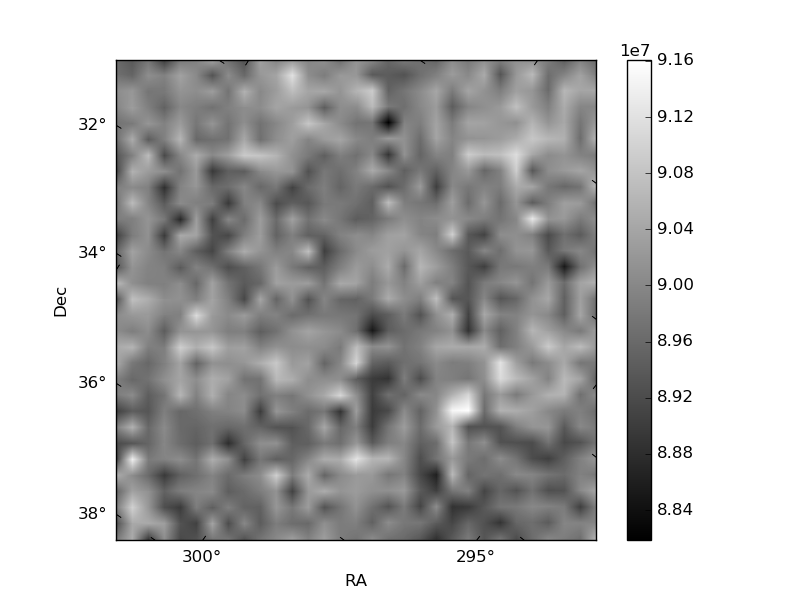
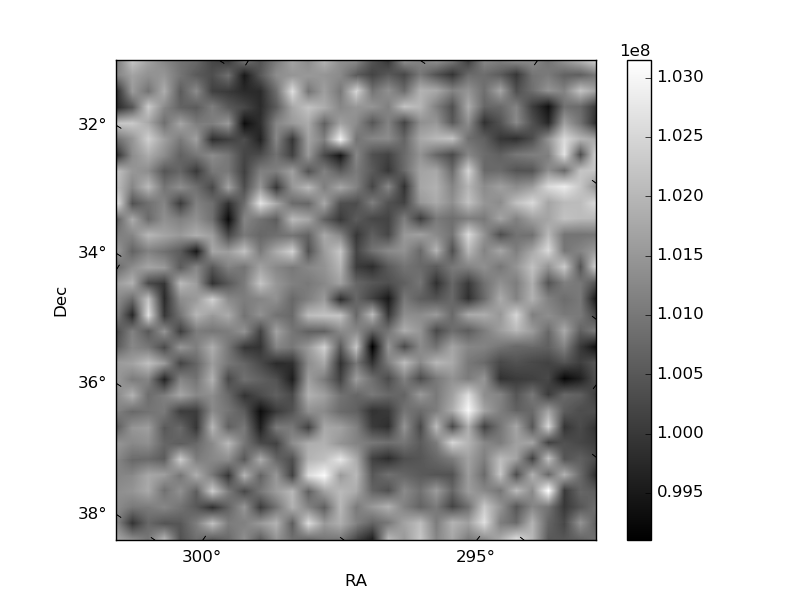
Histogram calculated using DETX and DETY for each event in the final _common_clean file
| Quadrant A | 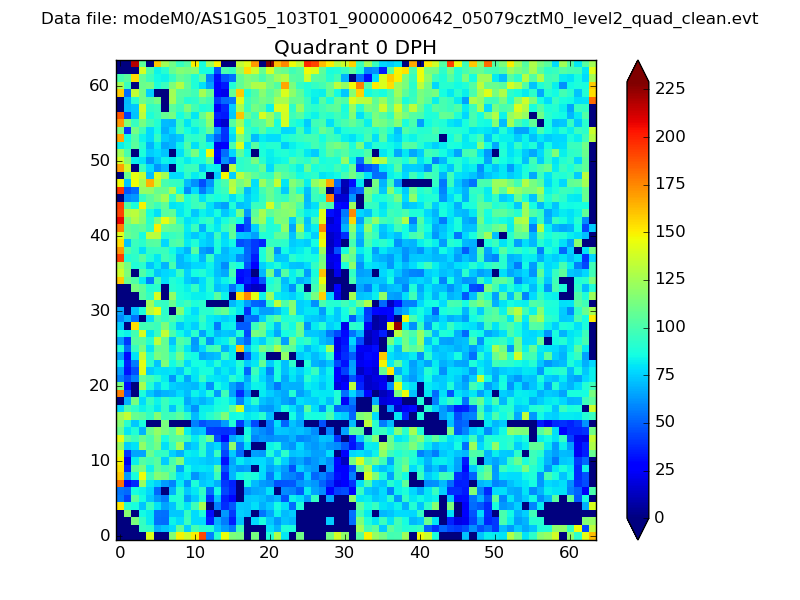 |
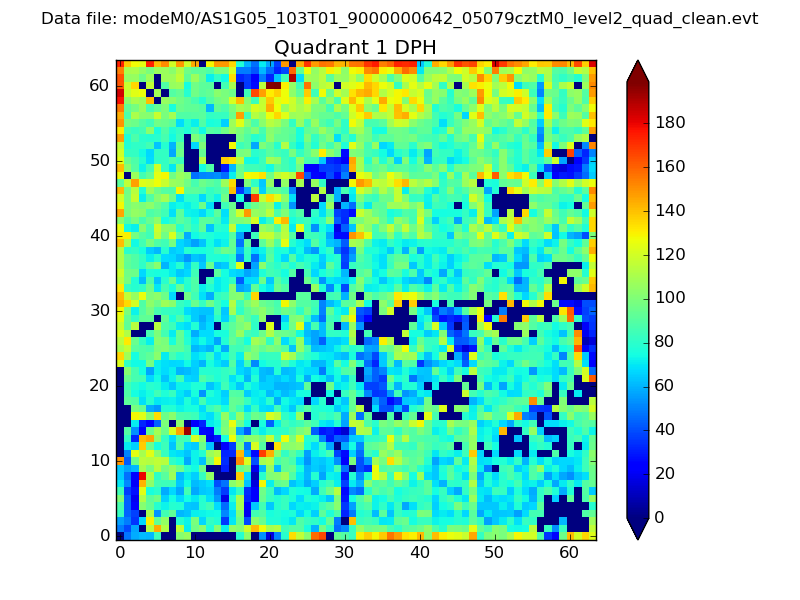 |
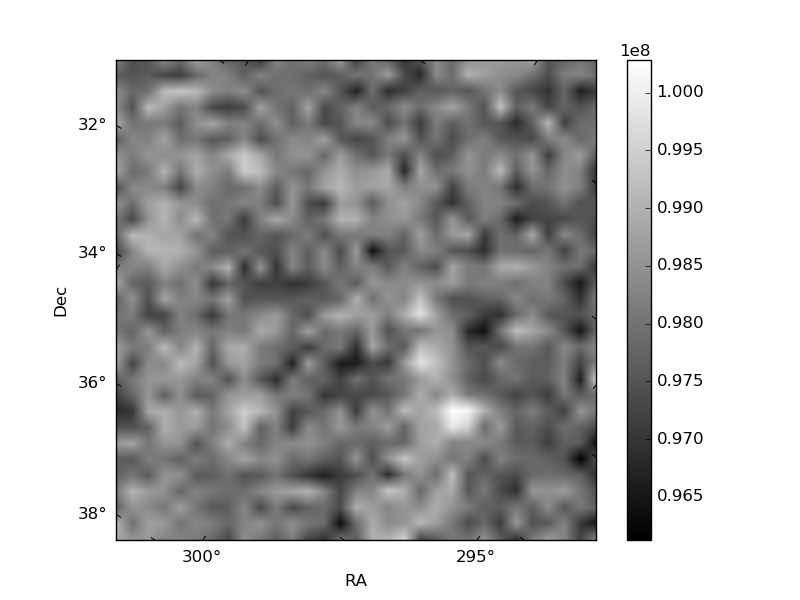
Quadrant B |
|---|---|---|---|
| Quadrant D | 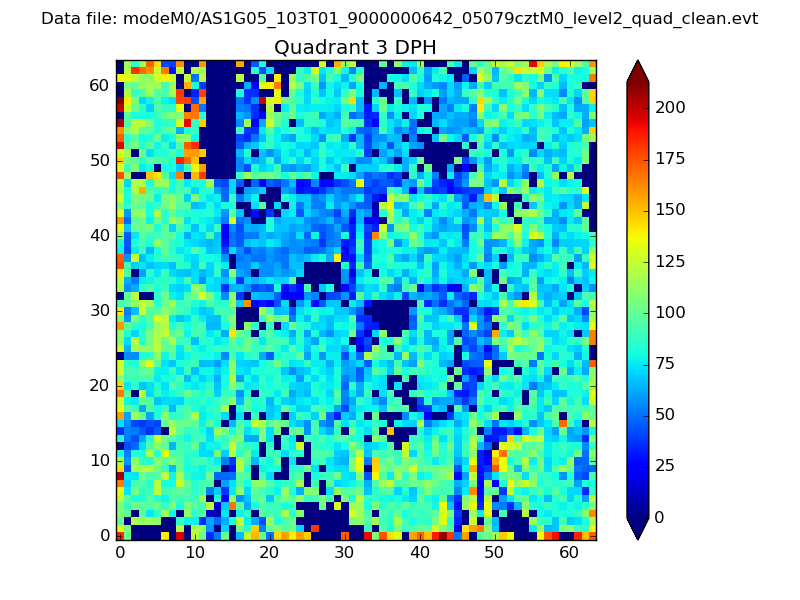 |
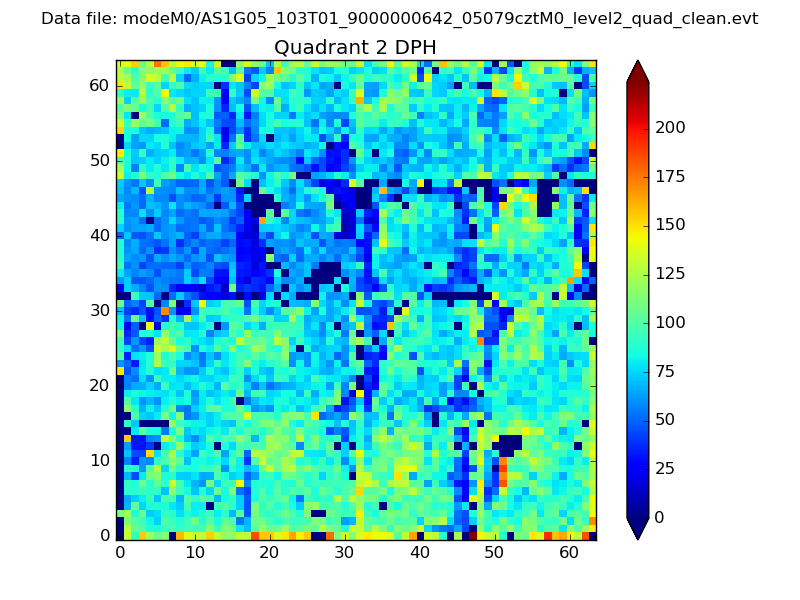 |
Quadrant C |
| Plot type | Count rate plots | Images |
|---|---|---|
| Comparison with Poisson distribution Blue bars denote a histogram of data divided into 1 sec bins. Red curve is a Poisson curve with rate = median count rate of data. |
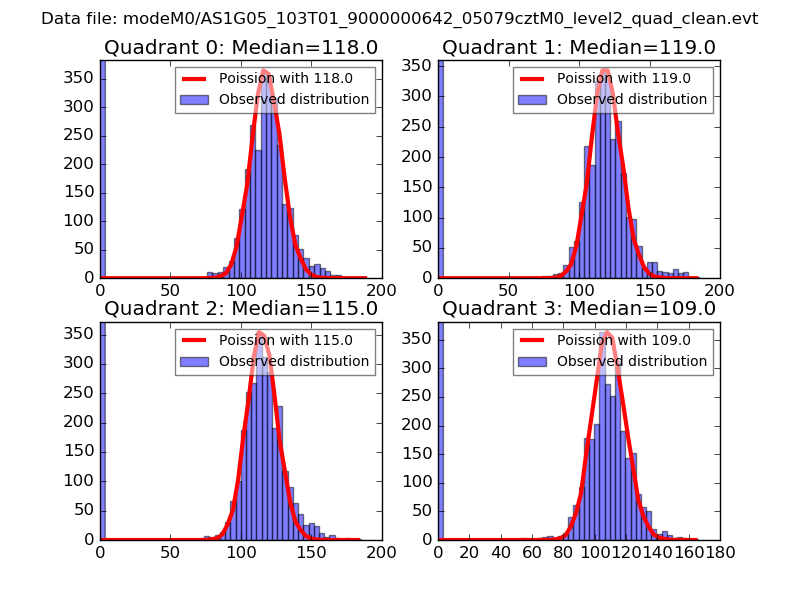 |
 |
| Quadrant-wise count rates Data is divided into 100 sec bins |
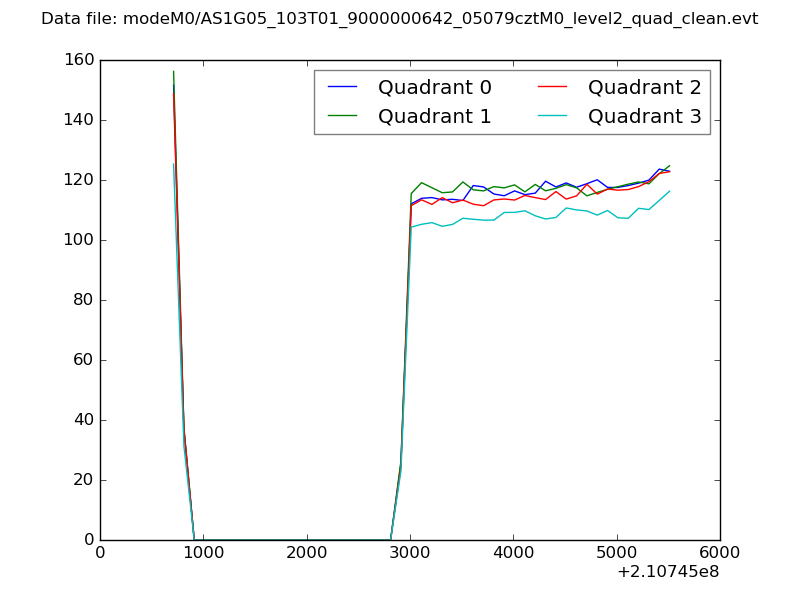 |
|
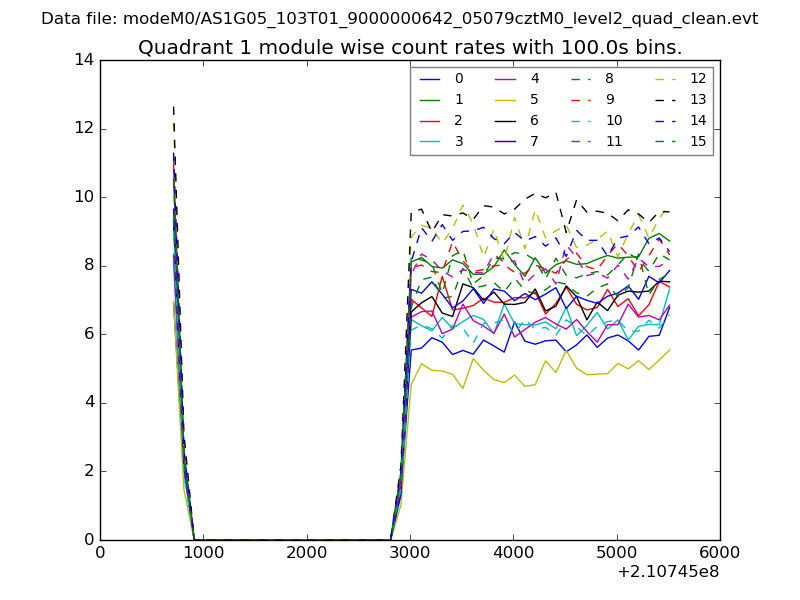
| Module-wise count rates for Quadrant A Data is divided into 100 sec bins |
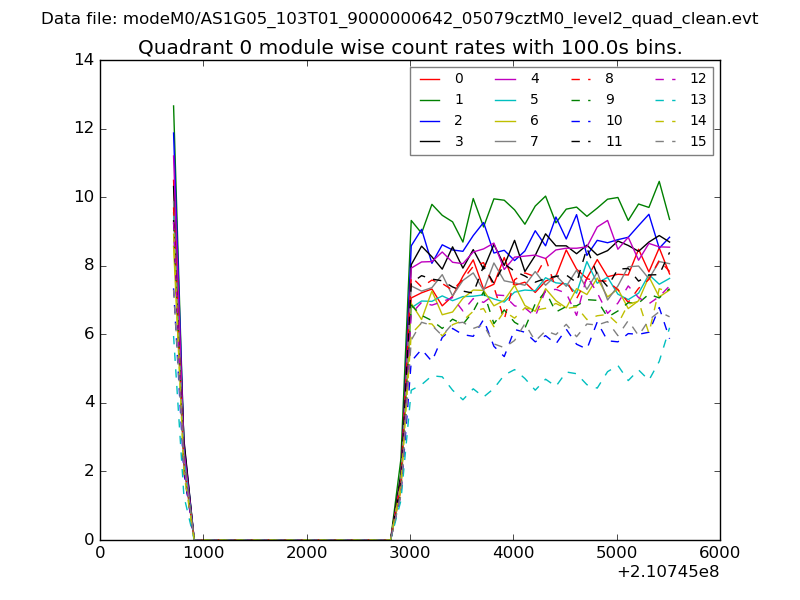 |
 |
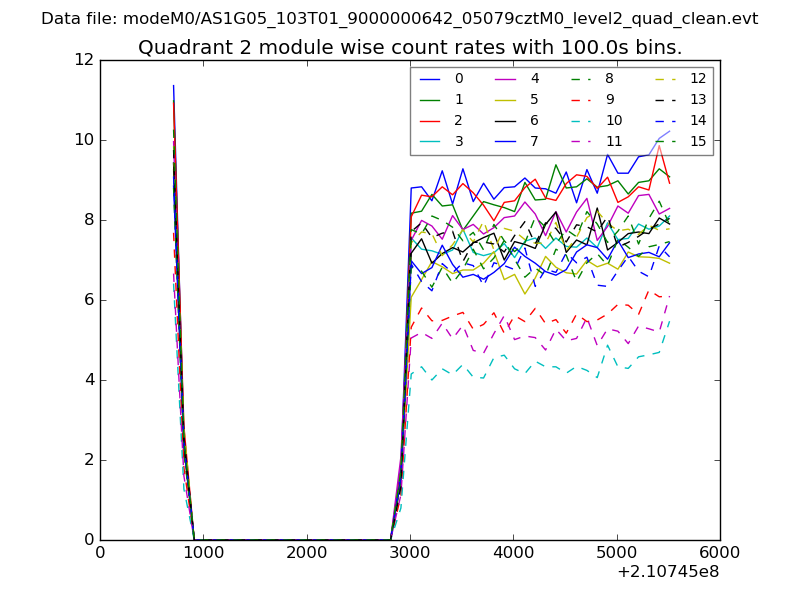
| Module-wise count rates for Quadrant B Data is divided into 100 sec bins |
 |
 |
| Module-wise count rates for Quadrant C Data is divided into 100 sec bins |
 |
 |
| Module-wise count rates for Quadrant D Data is divided into 100 sec bins |
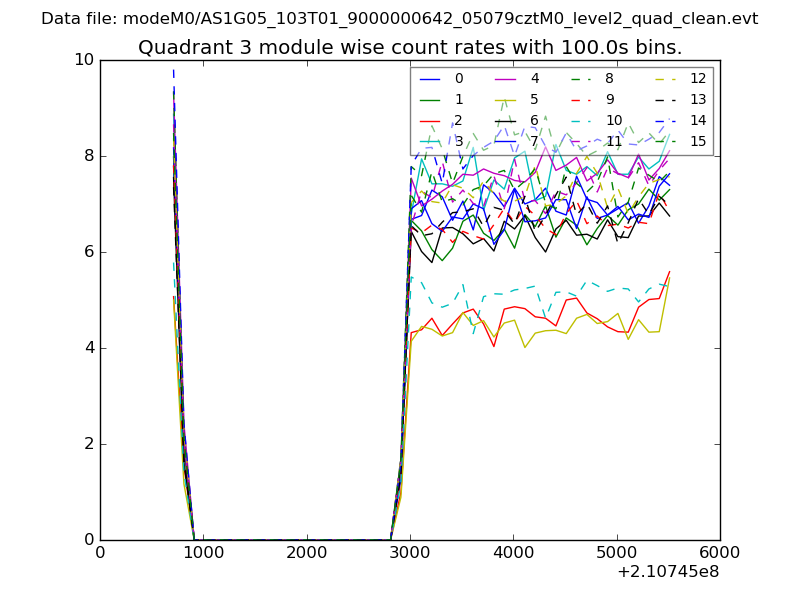 |
 |
| Parameter | Plot |
|---|---|
| CZT HV Monitor | 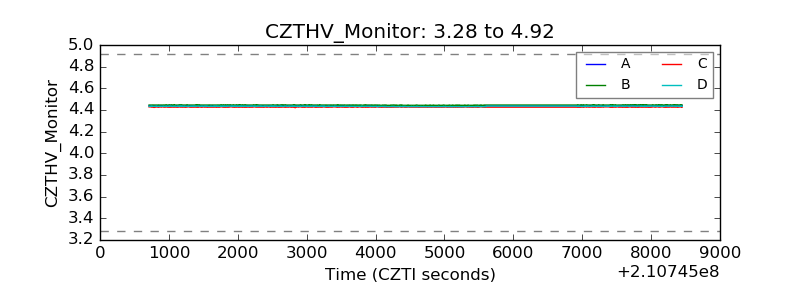 |
| D_VDD | 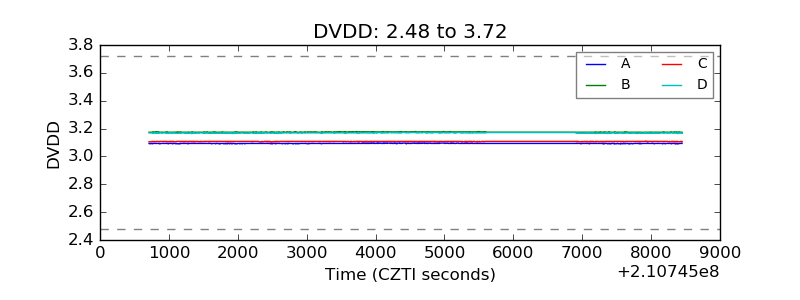 |
| Temperature 1 | 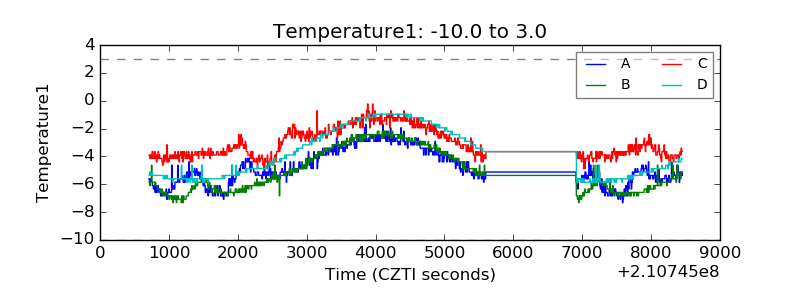 |
| Veto HV Monitor | 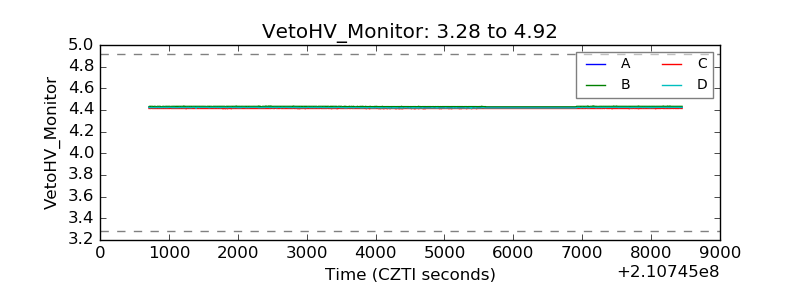 |
| Veto LLD | 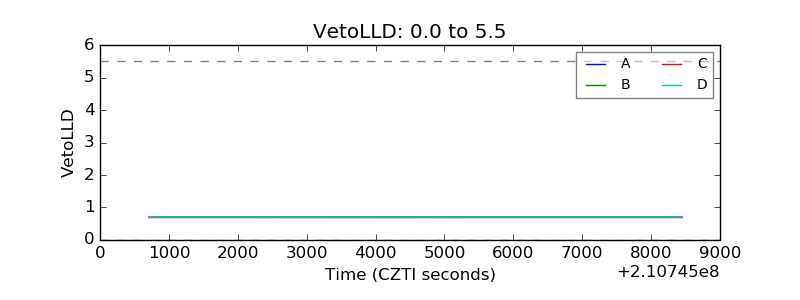 |
| Alpha Counter | 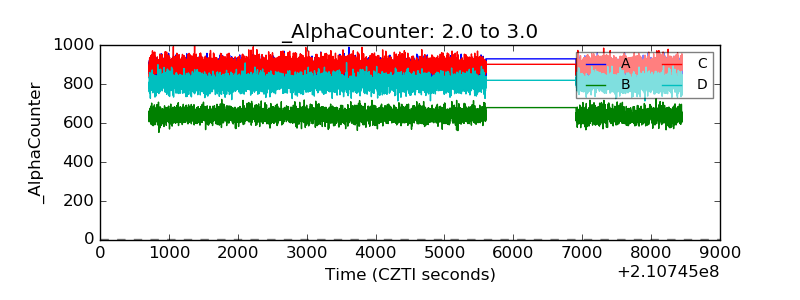 |
| _CPM_Rate | 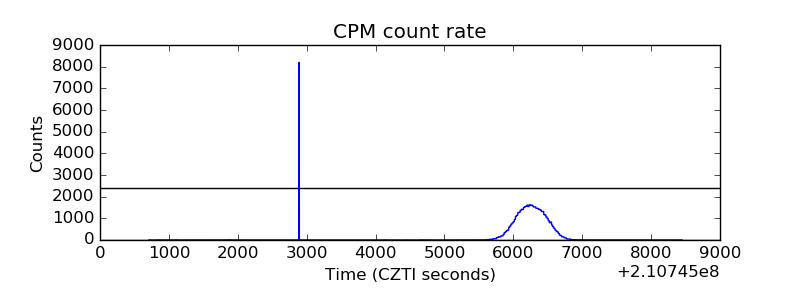 |
| CZT Counter | 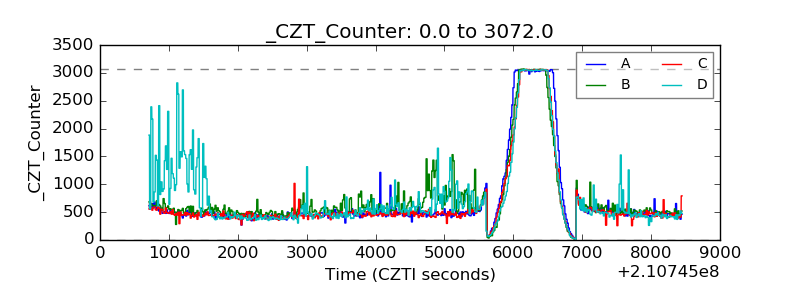 |
| +2.5 Volts monitor | 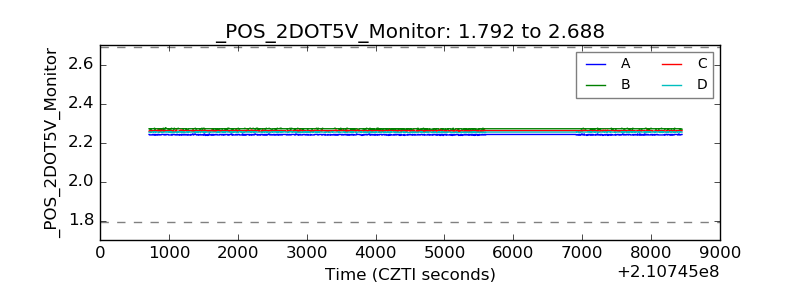 |
| +5 Volts monitor |  |
| _ROLL_ROT | 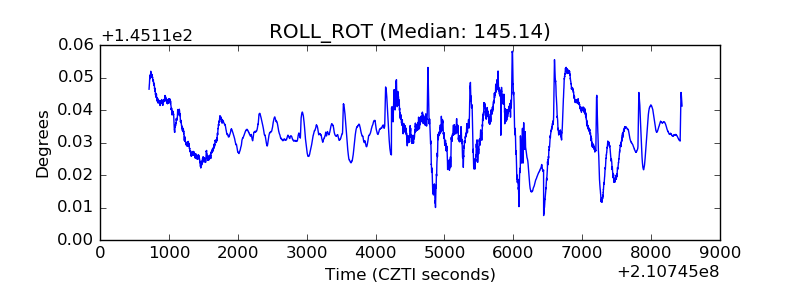 |
| _Roll_DEC | 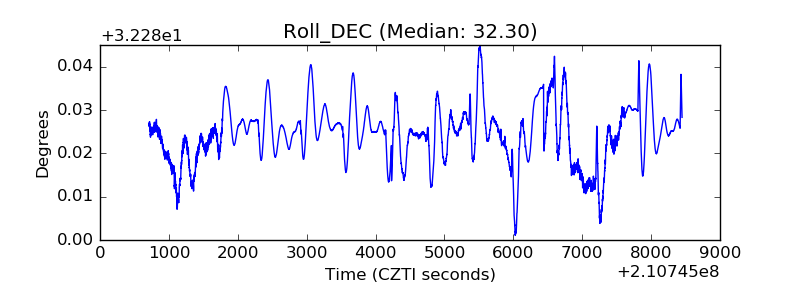 |
| _Roll_RA | 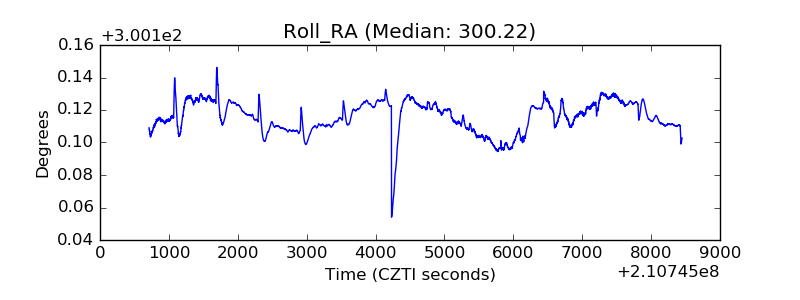 |
| Veto Counter | 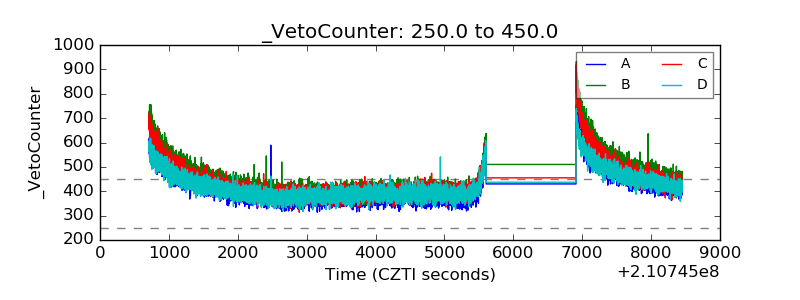 |