| Param | Original file | Final file |
|---|---|---|
| Filename | modeM0/AS1G05_103T01_9000000642_05081cztM0_level2.evt | modeM0/AS1G05_103T01_9000000642_05081cztM0_level2_quad_clean.evt |
| Size (bytes) | 507,199,680 | 69,940,800 |
| Size | 483.7 MB | 66.7 MB |
| Events in quadrant A | 3,207,688 | 438,697 |
| Events in quadrant B | 3,389,251 | 446,065 |
| Events in quadrant C | 3,139,009 | 433,214 |
| Events in quadrant D | 5,189,279 | 352,259 |
| Mode SS | |||
|---|---|---|---|
| Quadrant | BADHDUFLAG | Total packets | Discarded packets |
| A | 0 | 130 | 0 |
| B | 0 | 130 | 0 |
| C | 0 | 130 | 0 |
| D | 0 | 130 | 0 |
| Mode M0 | |||
|---|---|---|---|
| Quadrant | BADHDUFLAG | Total packets | Discarded packets |
| A | 0 | 13416 | 3 |
| B | 0 | 13763 | 2 |
| C | 0 | 13410 | 2 |
| D | 0 | 19667 | 2 |
| Mode M9 | |||
|---|---|---|---|
| Quadrant | BADHDUFLAG | Total packets | Discarded packets |
| A | 0 | 18 | 0 |
| B | 0 | 18 | 0 |
| C | 0 | 18 | 0 |
| D | 0 | 19 | 0 |
| Quadrant | Total seconds | Saturated seconds | Saturation percentage |
|---|---|---|---|
| A | 6408 | 141 | 2.200375% |
| B | 6408 | 153 | 2.387640% |
| C | 6408 | 102 | 1.591760% |
| D | 6408 | 868 | 13.545568% |
Noise dominated data is calculated using 1-second bins in cleaned event files. If a bin has >2000 counts, and if more than 50% of those come from <1% of pixels, then it is considered to be noise-dominated and hence unusable.
| Quadrant | # 1 sec bins | Bins with >0 counts | Bins with >2000 counts | High rate bins dominated by noise | Noise dominated (total time) | Noise dominated (detector-on time) | Marked lightcurve |
|---|---|---|---|---|---|---|---|
| A | 7613 | 6409 | 0 | 0 | 0.00% | 0.00% | 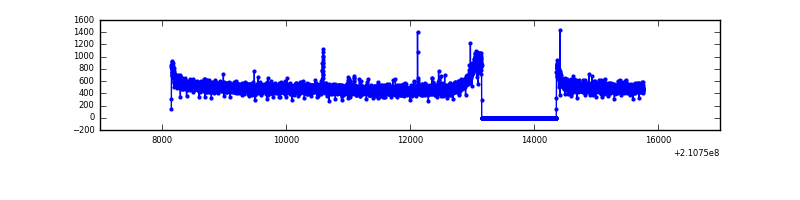 |
| B | 7613 | 6409 | 0 | 0 | 0.00% | 0.00% | 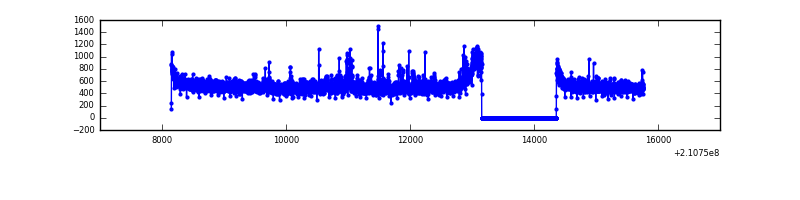 |
| C | 7613 | 6409 | 0 | 0 | 0.00% | 0.00% | 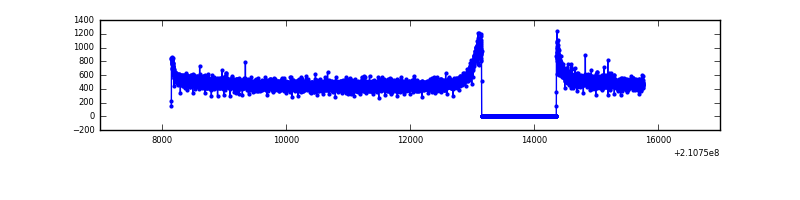 |
| D | 7613 | 6408 | 603 | 603 | 7.92% | 9.41% | 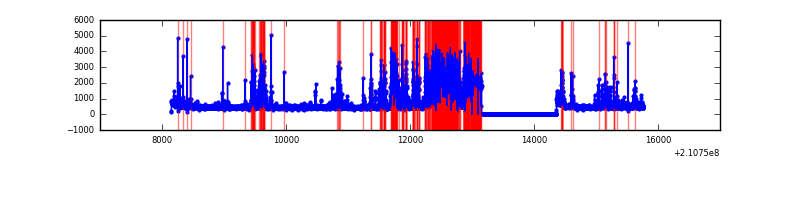 |
Top three noisy pixels from each quadrant. If the there are fewer than three noisy pixels in the level2.evt file, extra rows are filled as -1
| Pixel properties | Quadrant properties | ||||||
|---|---|---|---|---|---|---|---|
| Quadrant | DetID | PixID | Counts | Sigma | Mean | Median | Sigma |
| A | 0 | 50 | 21865 | 127.49 | 820 | 803 | 165.2 |
| A | 13 | 14 | 19991 | 116.15 | 820 | 803 | 165.2 |
| A | 13 | 251 | 8769 | 48.22 | 820 | 803 | 165.2 |
| B | 15 | 204 | 76125 | 477.89 | 825 | 810 | 157.6 |
| B | 8 | 3 | 45247 | 281.96 | 825 | 810 | 157.6 |
| B | 0 | 219 | 42740 | 266.05 | 825 | 810 | 157.6 |
| C | 1 | 16 | 69019 | 374.89 | 786 | 791 | 182.0 |
| C | 13 | 61 | 6400 | 30.82 | 786 | 791 | 182.0 |
| C | 12 | 4 | 2291 | 8.24 | 786 | 791 | 182.0 |
| D | 13 | 235 | 1262925 | 7338.63 | 709 | 686 | 172.0 |
| D | 12 | 22 | 926123 | 5380.47 | 709 | 686 | 172.0 |
| D | 13 | 239 | 207874 | 1204.59 | 709 | 686 | 172.0 |
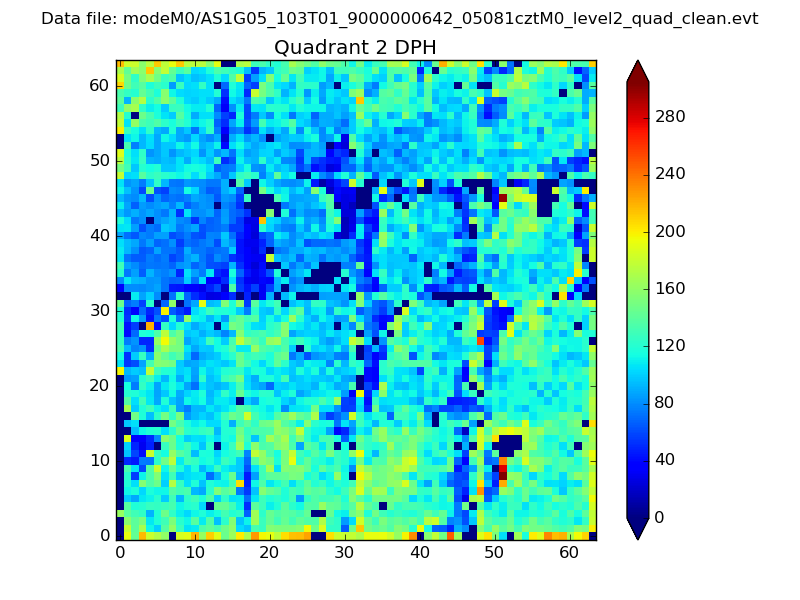
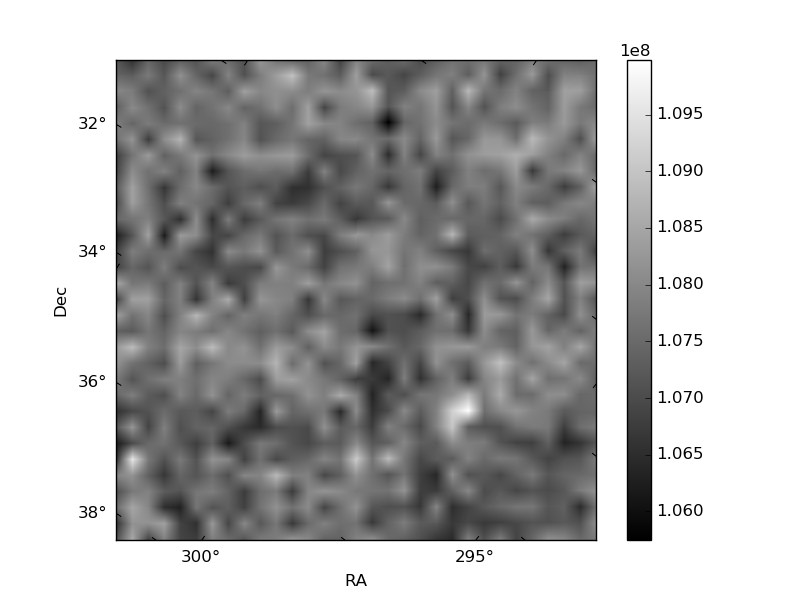
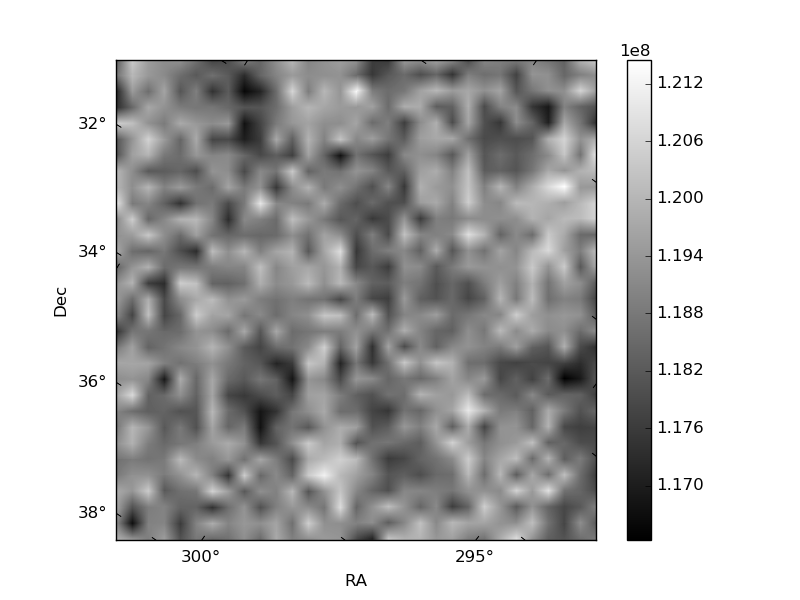
Histogram calculated using DETX and DETY for each event in the final _common_clean file
| Quadrant A | 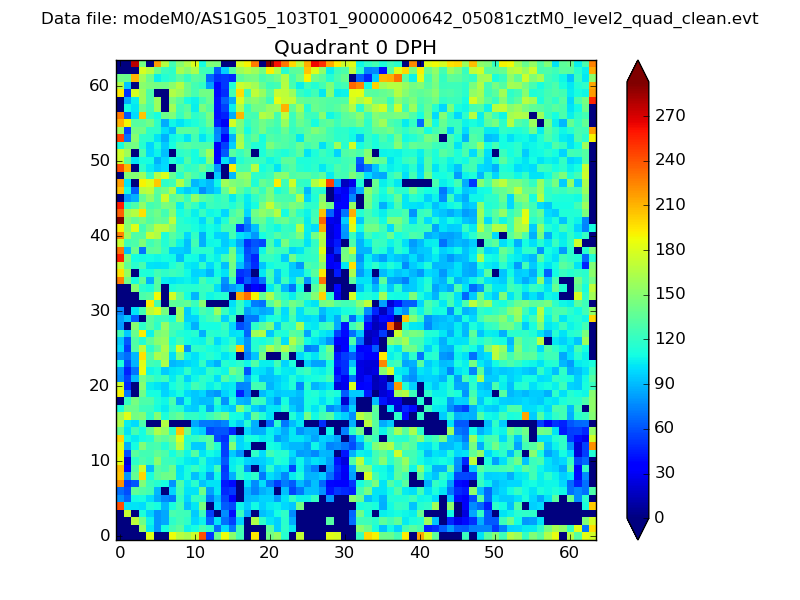 |
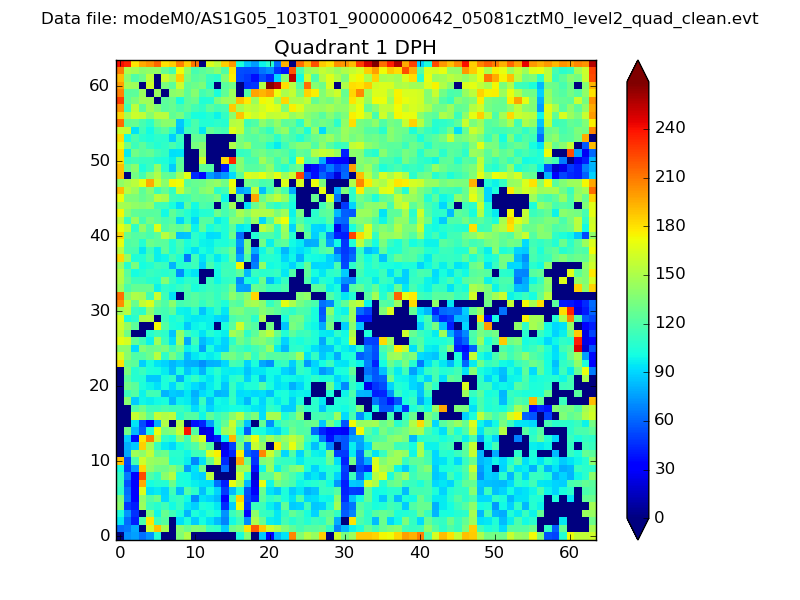 |
Quadrant B |
|---|---|---|---|
| Quadrant D | 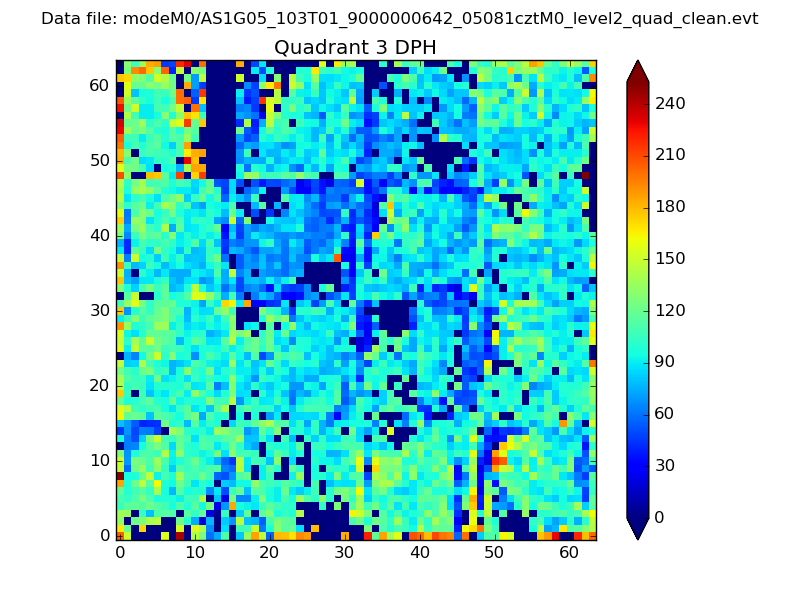 |
 |
Quadrant C |
| Plot type | Count rate plots | Images |
|---|---|---|
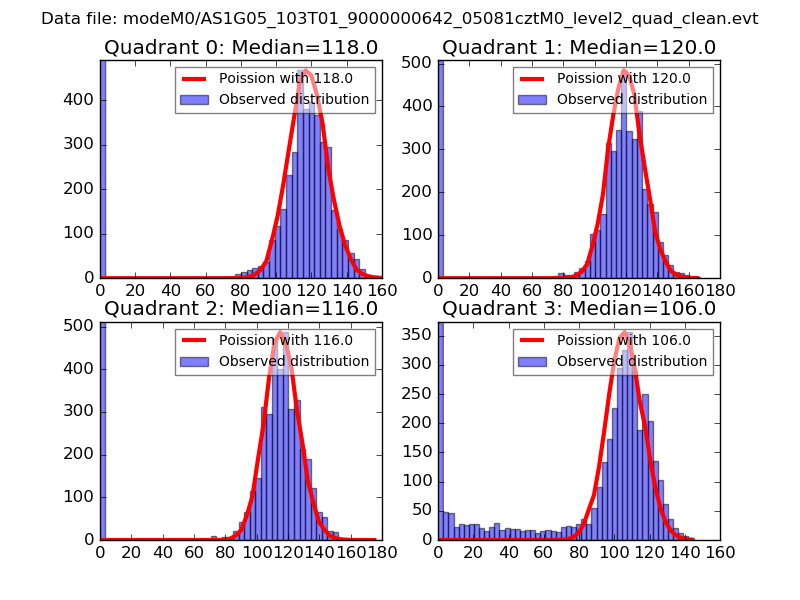
| Comparison with Poisson distribution Blue bars denote a histogram of data divided into 1 sec bins. Red curve is a Poisson curve with rate = median count rate of data. |
 |
 |
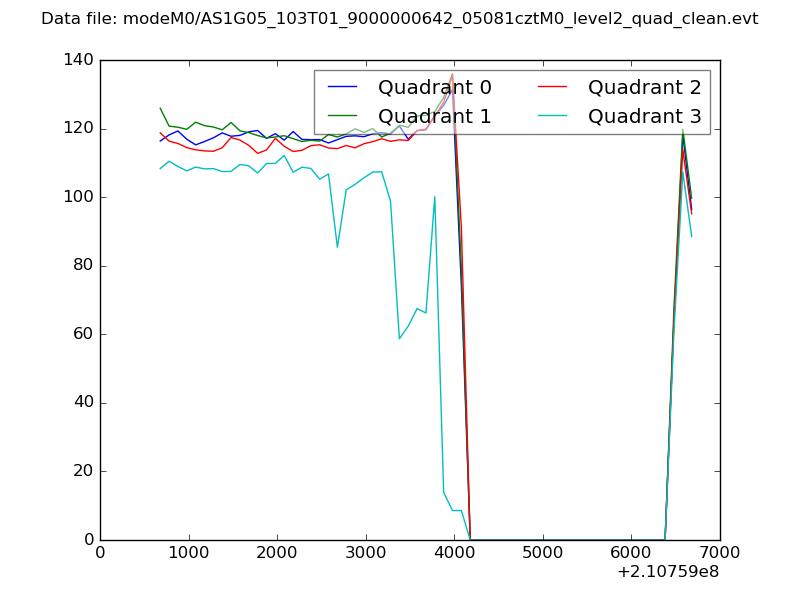
| Quadrant-wise count rates Data is divided into 100 sec bins |
 |
|
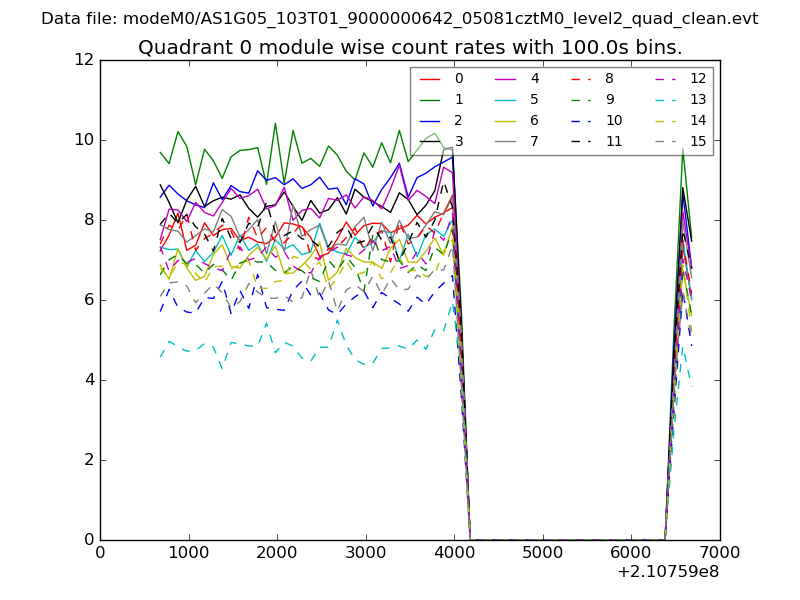
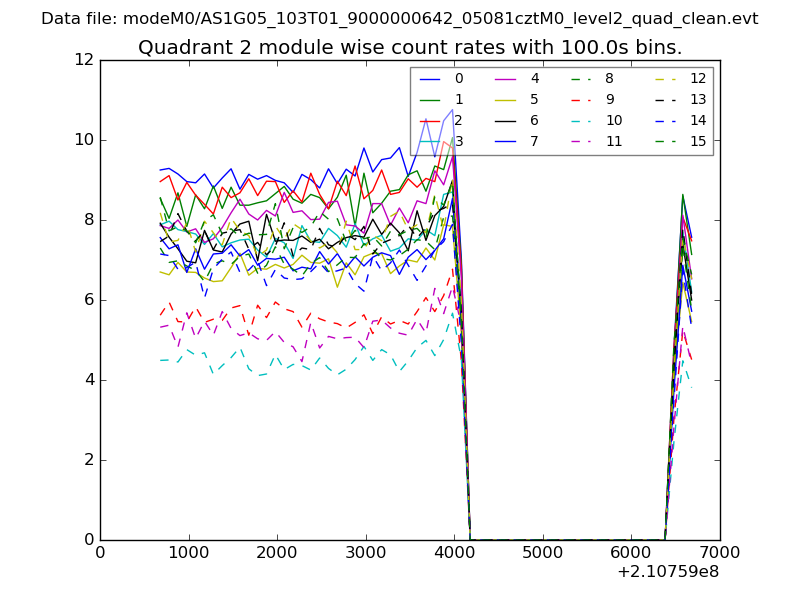
| Module-wise count rates for Quadrant A Data is divided into 100 sec bins |
 |
 |
| Module-wise count rates for Quadrant B Data is divided into 100 sec bins |
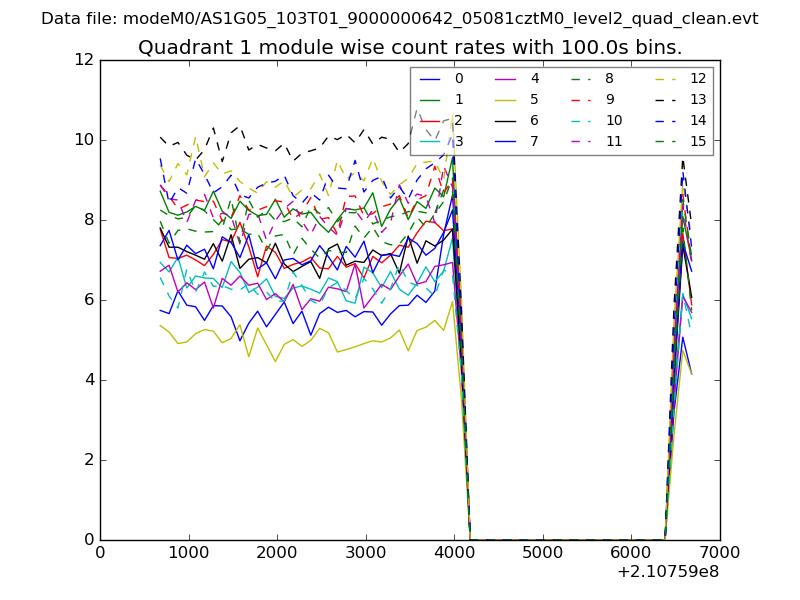 |
 |
| Module-wise count rates for Quadrant C Data is divided into 100 sec bins |
 |
 |
| Module-wise count rates for Quadrant D Data is divided into 100 sec bins |
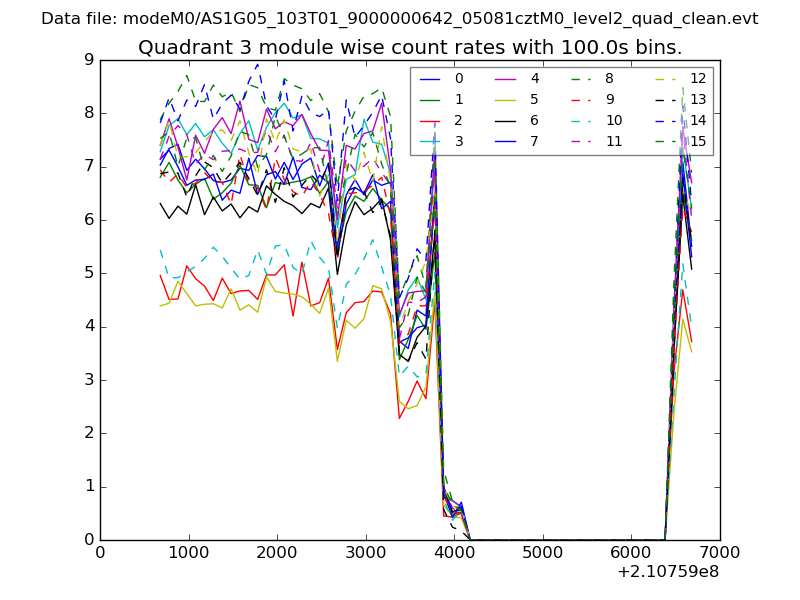 |
 |
| Parameter | Plot |
|---|---|
| CZT HV Monitor | 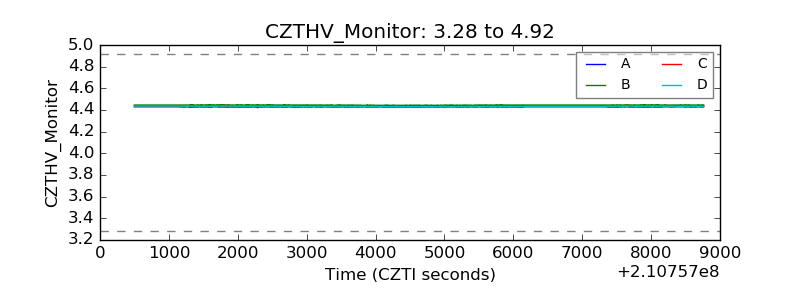 |
| D_VDD | 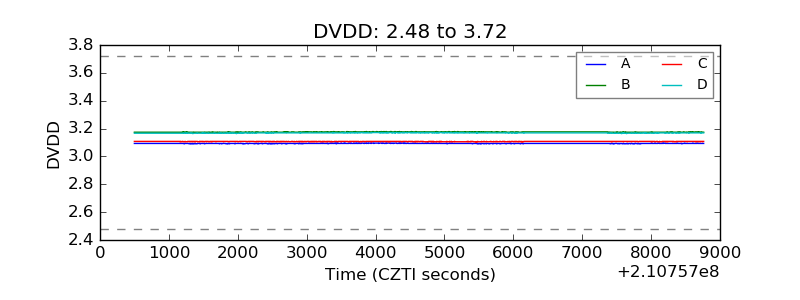 |
| Temperature 1 | 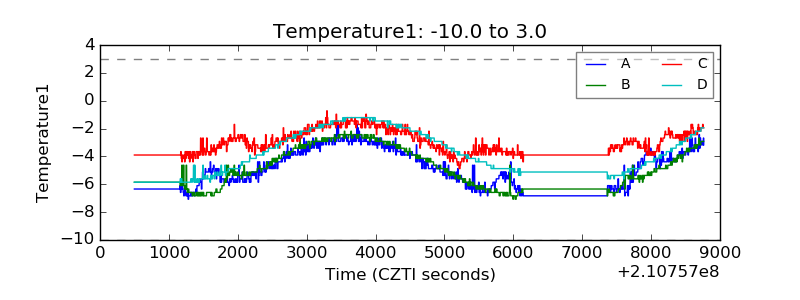 |
| Veto HV Monitor | 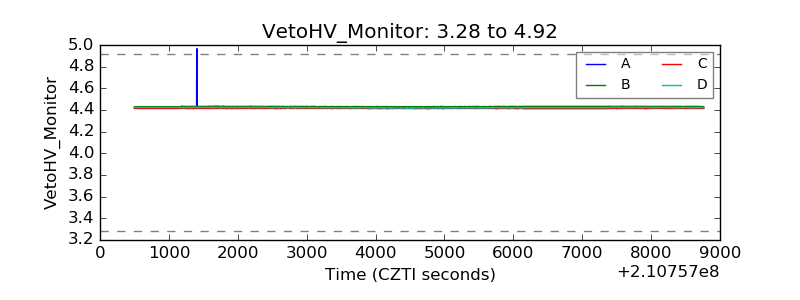 |
| Veto LLD | 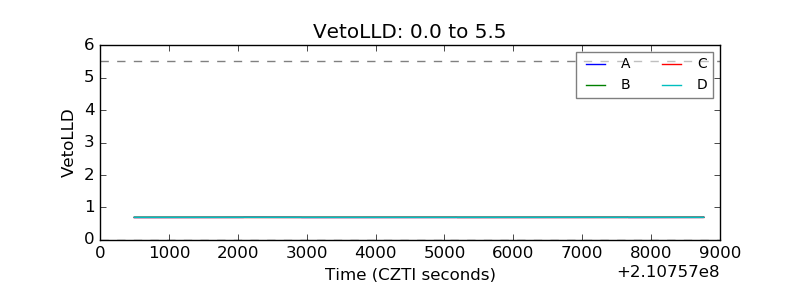 |
| Alpha Counter | 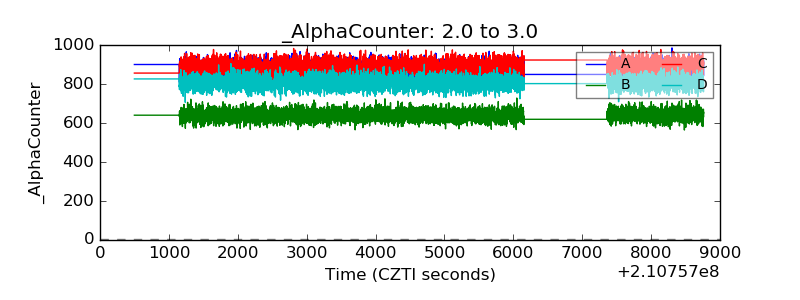 |
| _CPM_Rate | 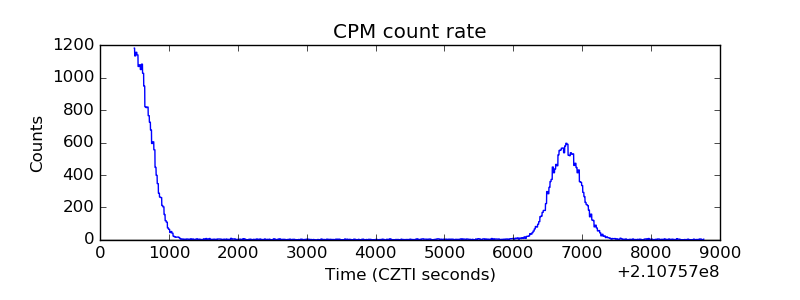 |
| CZT Counter | 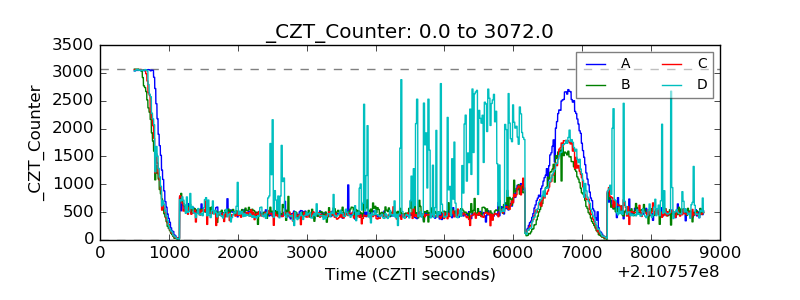 |
| +2.5 Volts monitor |  |
| +5 Volts monitor | 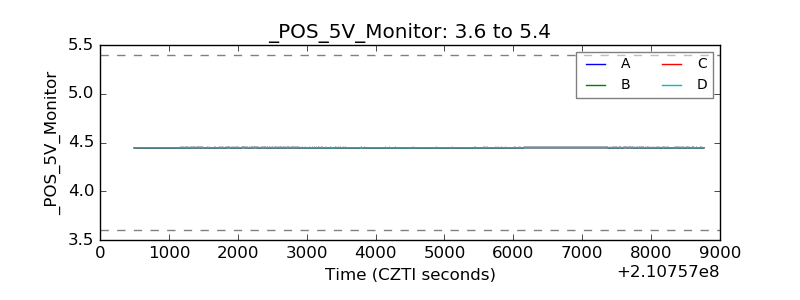 |
| _ROLL_ROT | 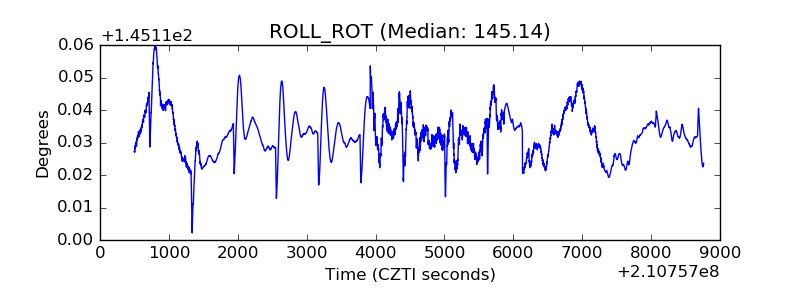 |
| _Roll_DEC | 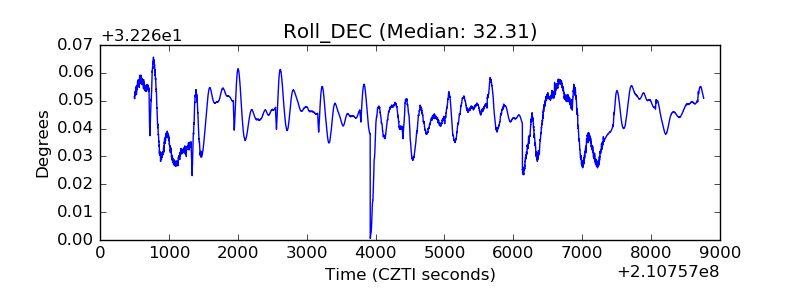 |
| _Roll_RA | 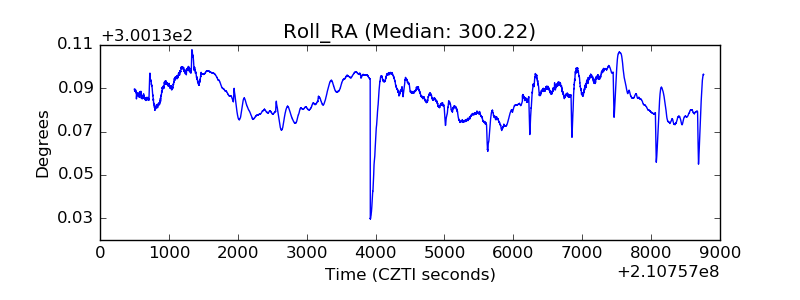 |
| Veto Counter | 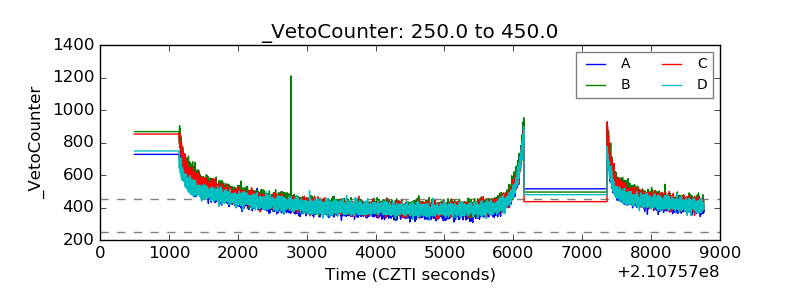 |