| Param | Original file | Final file |
|---|---|---|
| Filename | modeM0/AS1G05_103T01_9000000642_05084cztM0_level2.evt | modeM0/AS1G05_103T01_9000000642_05084cztM0_level2_quad_clean.evt |
| Size (bytes) | 671,466,240 | 88,712,640 |
| Size | 640.4 MB | 84.6 MB |
| Events in quadrant A | 3,659,946 | 566,655 |
| Events in quadrant B | 3,828,103 | 572,846 |
| Events in quadrant C | 3,557,574 | 560,612 |
| Events in quadrant D | 8,770,119 | 452,517 |
| Mode SS | |||
|---|---|---|---|
| Quadrant | BADHDUFLAG | Total packets | Discarded packets |
| A | 0 | 156 | 0 |
| B | 0 | 156 | 0 |
| C | 0 | 156 | 0 |
| D | 0 | 156 | 0 |
| Mode M0 | |||
|---|---|---|---|
| Quadrant | BADHDUFLAG | Total packets | Discarded packets |
| A | 0 | 16208 | 3 |
| B | 0 | 16418 | 2 |
| C | 0 | 16051 | 2 |
| D | 0 | 31311 | 2 |
| Mode M9 | |||
|---|---|---|---|
| Quadrant | BADHDUFLAG | Total packets | Discarded packets |
| A | 0 | 4 | 0 |
| B | 0 | 4 | 0 |
| C | 0 | 4 | 0 |
| D | 0 | 5 | 0 |
| Quadrant | Total seconds | Saturated seconds | Saturation percentage |
|---|---|---|---|
| A | 7669 | 251 | 3.272917% |
| B | 7669 | 237 | 3.090364% |
| C | 7669 | 163 | 2.125440% |
| D | 7669 | 2081 | 27.135220% |
Noise dominated data is calculated using 1-second bins in cleaned event files. If a bin has >2000 counts, and if more than 50% of those come from <1% of pixels, then it is considered to be noise-dominated and hence unusable.
| Quadrant | # 1 sec bins | Bins with >0 counts | Bins with >2000 counts | High rate bins dominated by noise | Noise dominated (total time) | Noise dominated (detector-on time) | Marked lightcurve |
|---|---|---|---|---|---|---|---|
| A | 7819 | 7671 | 2 | 2 | 0.03% | 0.03% | 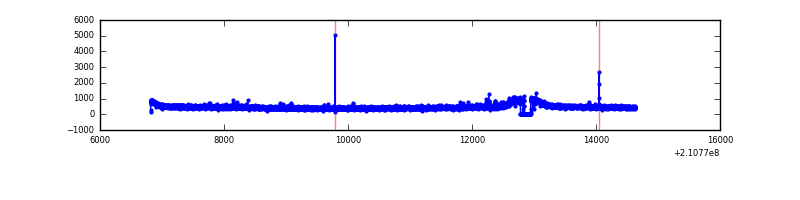 |
| B | 7819 | 7671 | 4 | 4 | 0.05% | 0.05% | 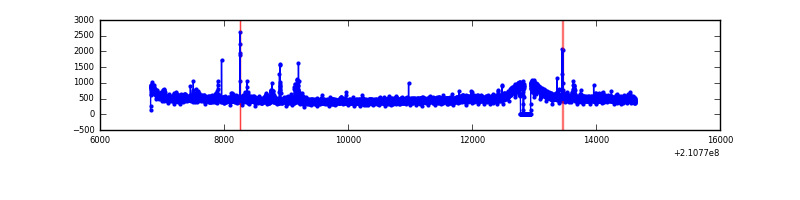 |
| C | 7819 | 7671 | 0 | 0 | 0.00% | 0.00% | 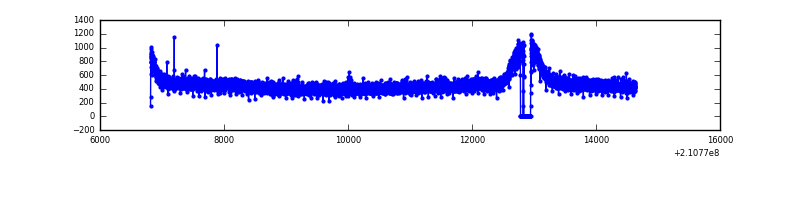 |
| D | 7819 | 7671 | 1609 | 1609 | 20.58% | 20.98% | 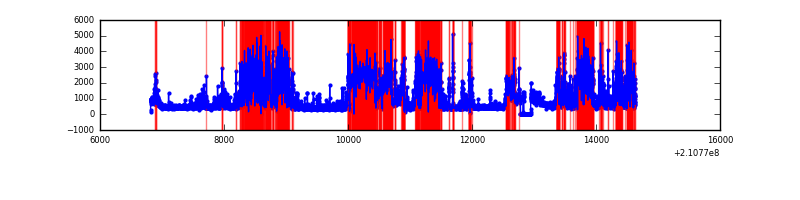 |
Top three noisy pixels from each quadrant. If the there are fewer than three noisy pixels in the level2.evt file, extra rows are filled as -1
| Pixel properties | Quadrant properties | ||||||
|---|---|---|---|---|---|---|---|
| Quadrant | DetID | PixID | Counts | Sigma | Mean | Median | Sigma |
| A | 0 | 247 | 27368 | 138.31 | 931 | 909 | 191.3 |
| A | 0 | 50 | 20535 | 102.59 | 931 | 909 | 191.3 |
| A | 13 | 251 | 17679 | 87.66 | 931 | 909 | 191.3 |
| B | 15 | 204 | 88818 | 479.42 | 937 | 915 | 183.4 |
| B | 0 | 219 | 49355 | 264.19 | 937 | 915 | 183.4 |
| B | 15 | 54 | 23307 | 122.12 | 937 | 915 | 183.4 |
| C | 1 | 16 | 7582 | 31.39 | 907 | 913 | 212.4 |
| C | 13 | 61 | 7498 | 31.0 | 907 | 913 | 212.4 |
| C | 14 | 67 | 3819 | 13.68 | 907 | 913 | 212.4 |
| D | 12 | 22 | 2518241 | 12549.69 | 812 | 787 | 200.6 |
| D | 13 | 235 | 2166468 | 10796.08 | 812 | 787 | 200.6 |
| D | 13 | 239 | 385602 | 1918.33 | 812 | 787 | 200.6 |
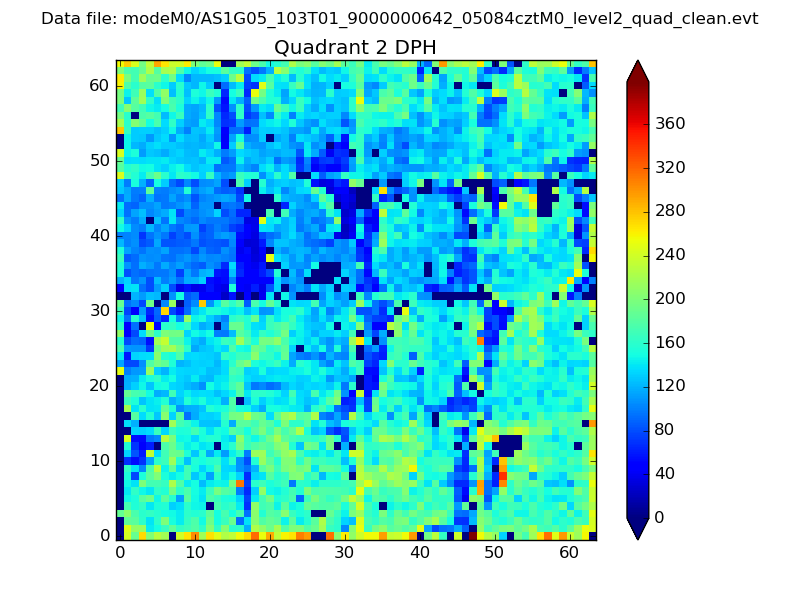
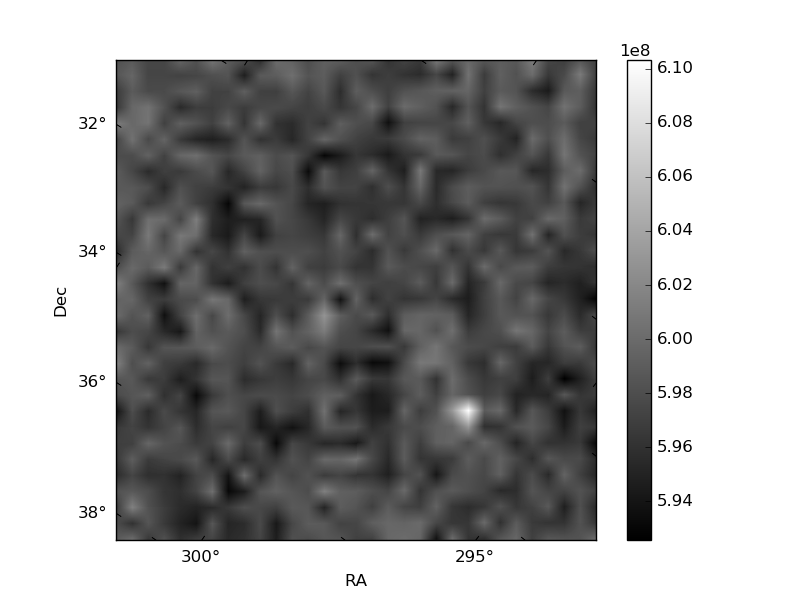
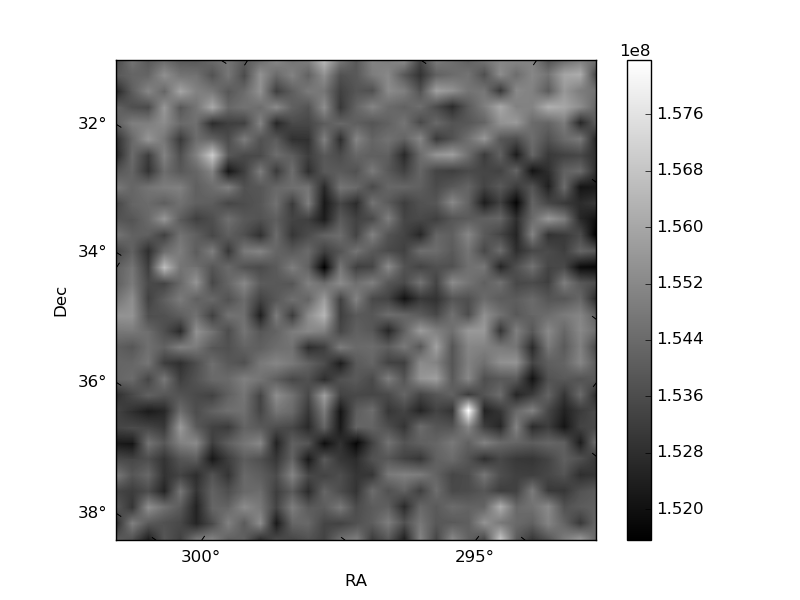
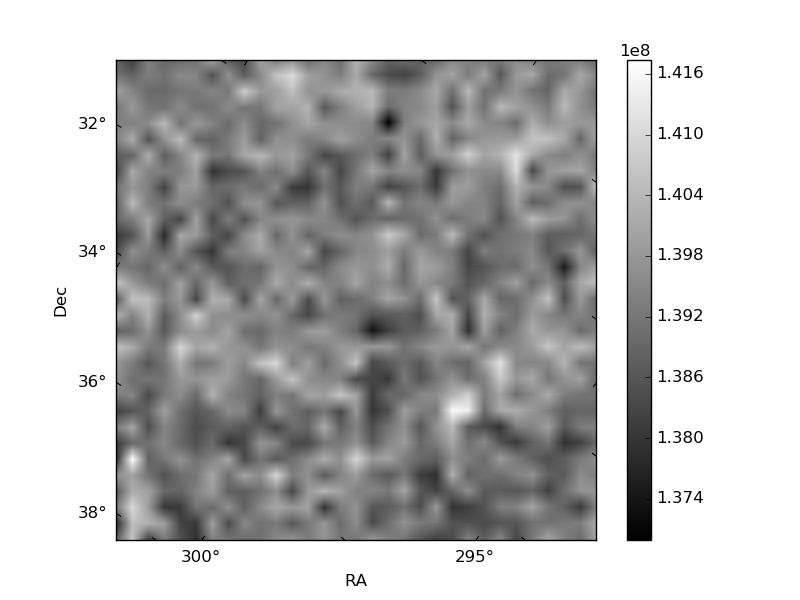
Histogram calculated using DETX and DETY for each event in the final _common_clean file
| Quadrant A | 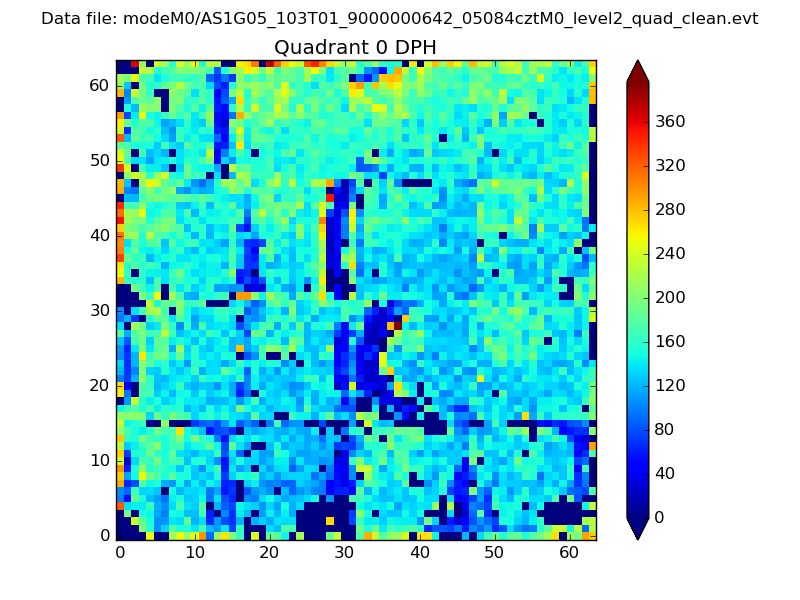 |
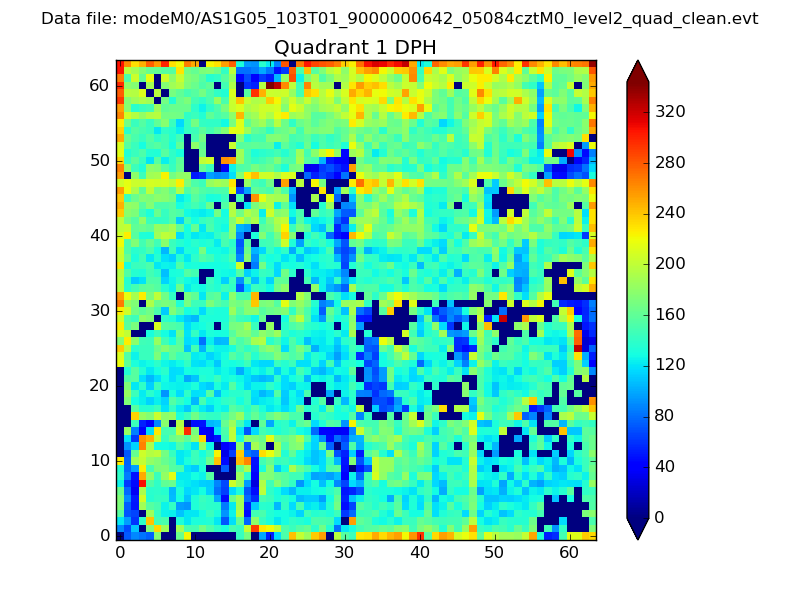 |
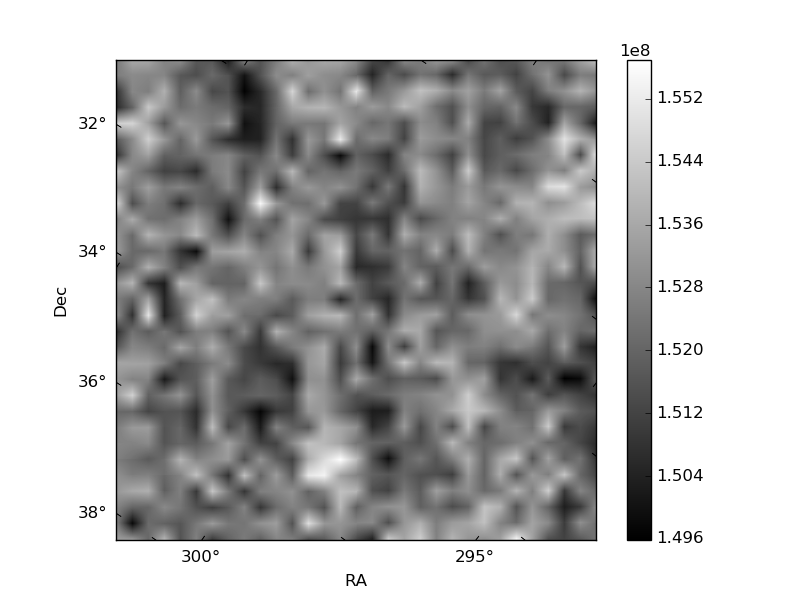
Quadrant B |
|---|---|---|---|
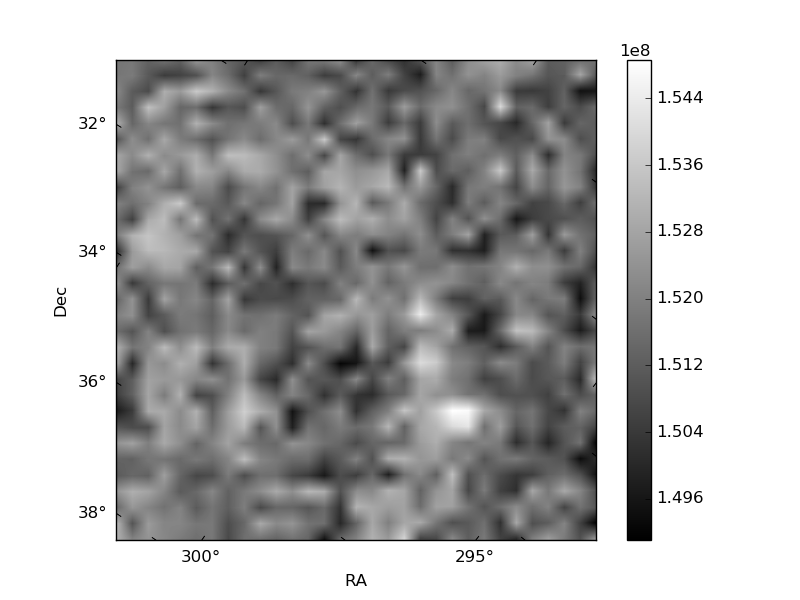
| Quadrant D | 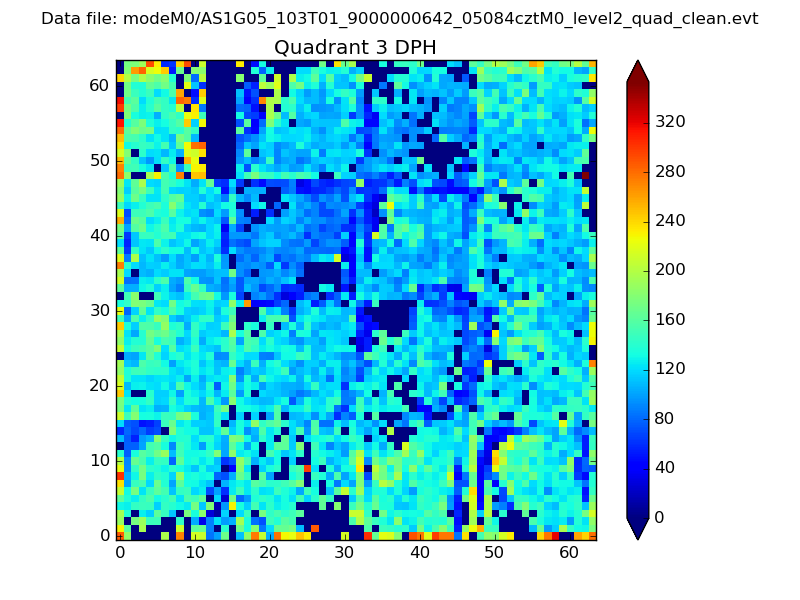 |
 |
Quadrant C |
| Plot type | Count rate plots | Images |
|---|---|---|
| Comparison with Poisson distribution Blue bars denote a histogram of data divided into 1 sec bins. Red curve is a Poisson curve with rate = median count rate of data. |
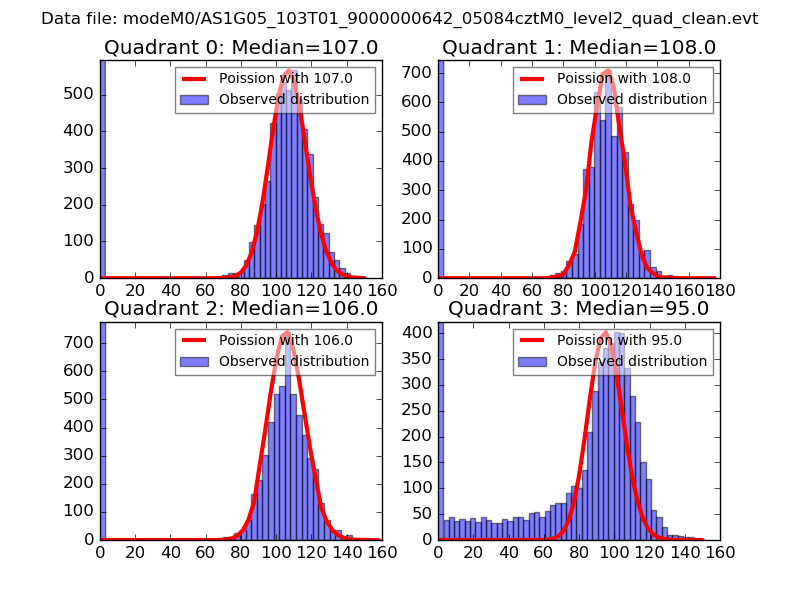 |
 |
| Quadrant-wise count rates Data is divided into 100 sec bins |
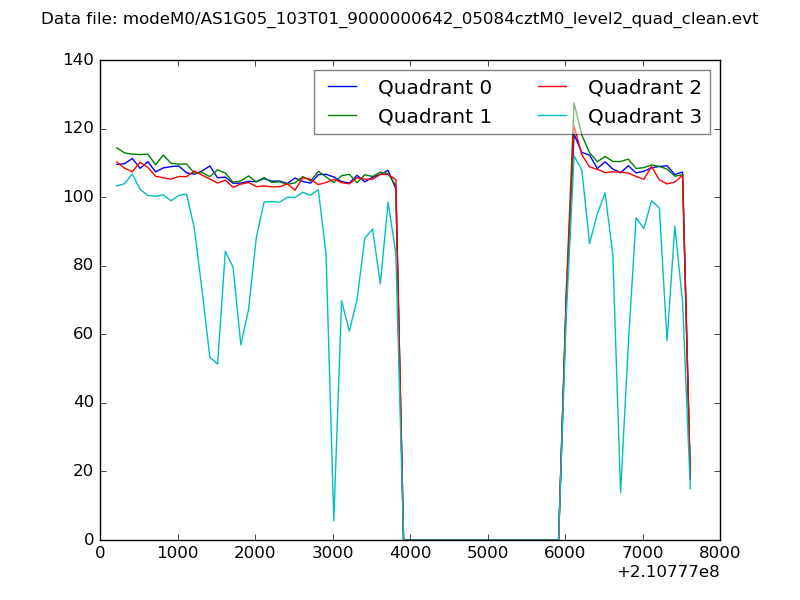 |
|
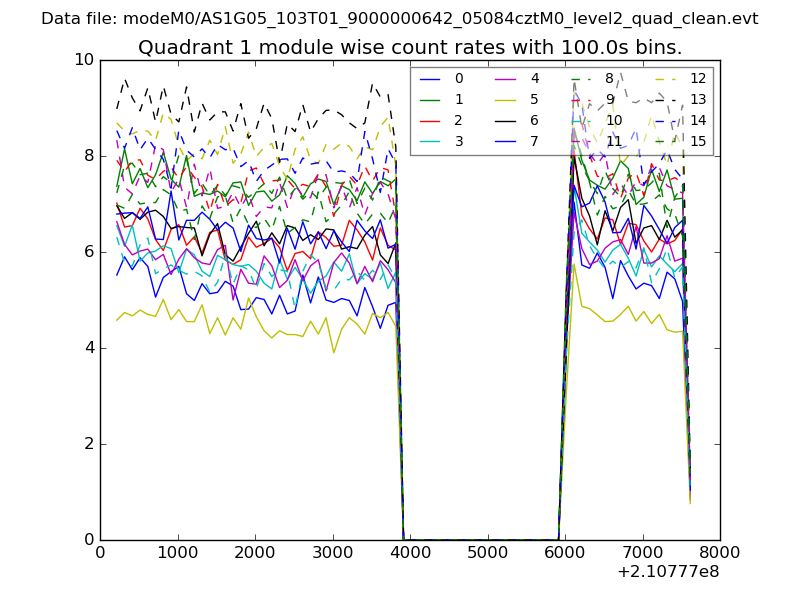
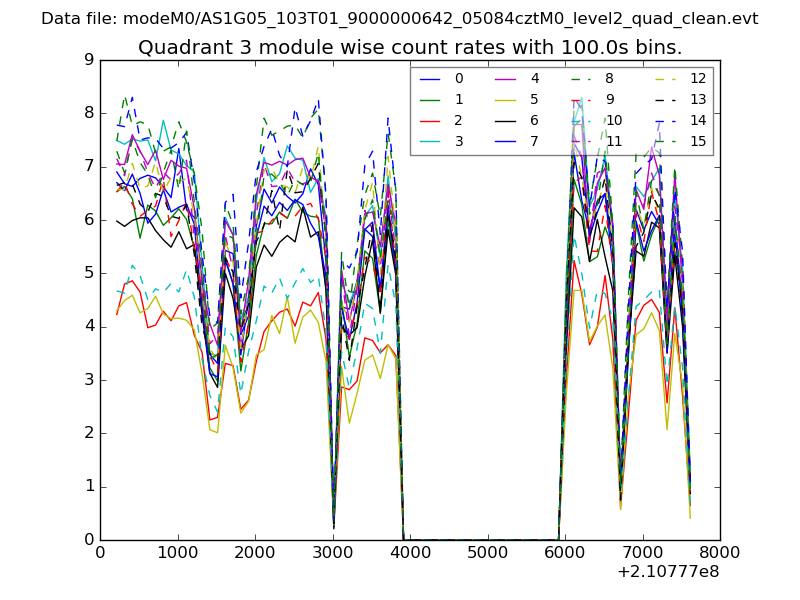
| Module-wise count rates for Quadrant A Data is divided into 100 sec bins |
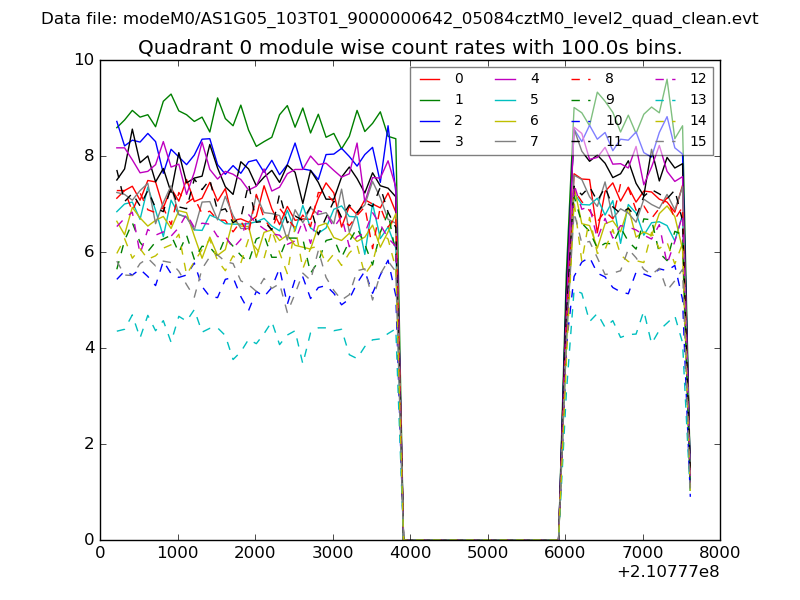 |
 |
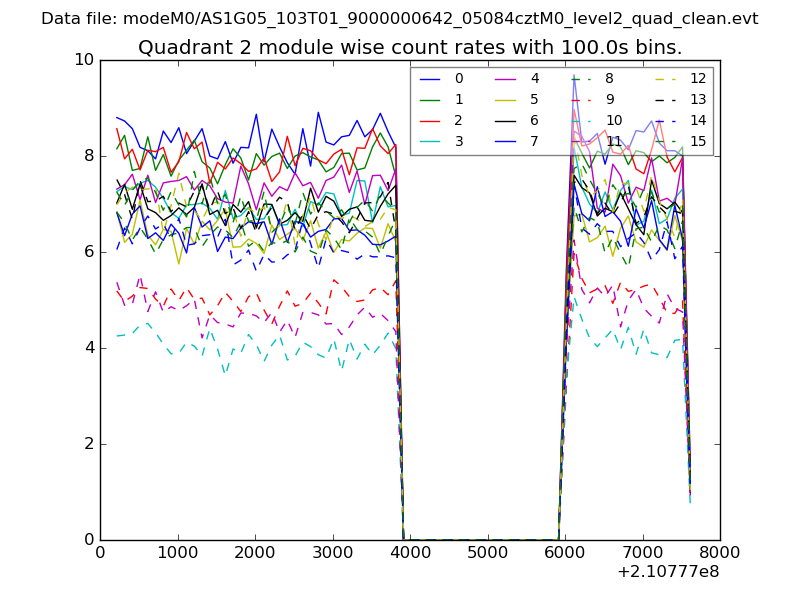
| Module-wise count rates for Quadrant B Data is divided into 100 sec bins |
 |
 |
| Module-wise count rates for Quadrant C Data is divided into 100 sec bins |
 |
 |
| Module-wise count rates for Quadrant D Data is divided into 100 sec bins |
 |
 |
| Parameter | Plot |
|---|---|
| CZT HV Monitor | 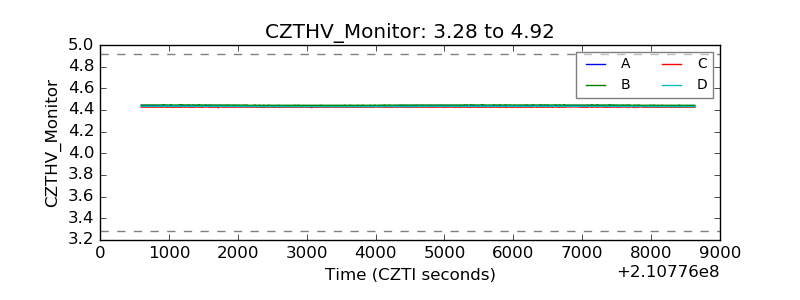 |
| D_VDD | 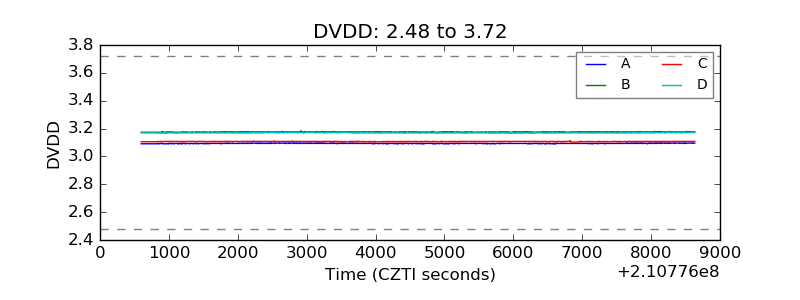 |
| Temperature 1 | 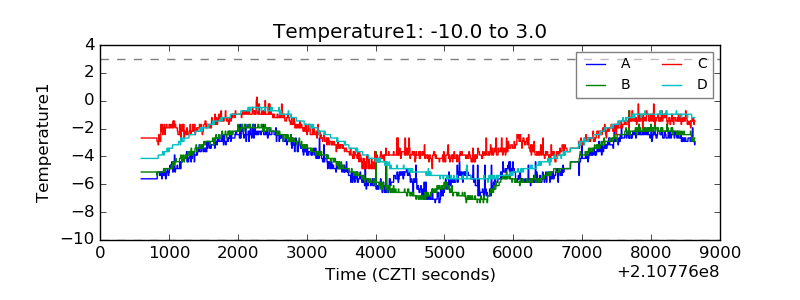 |
| Veto HV Monitor | 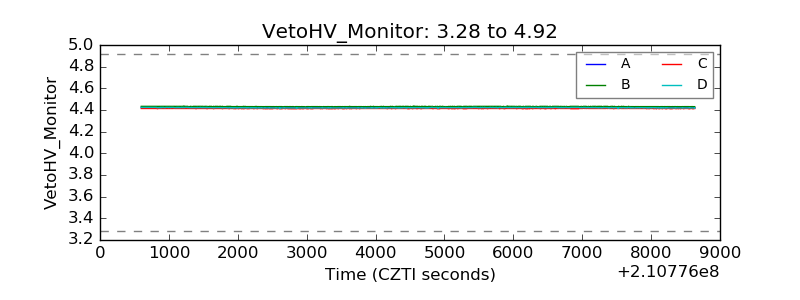 |
| Veto LLD | 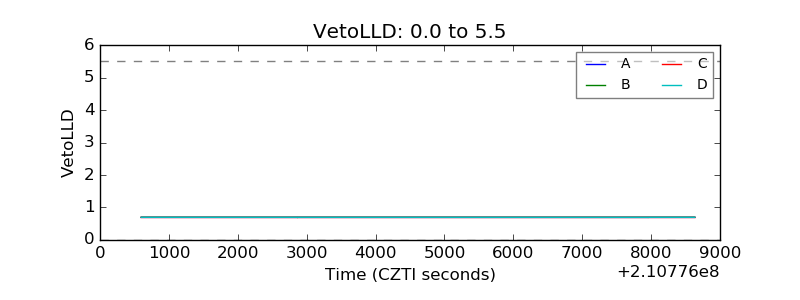 |
| Alpha Counter | 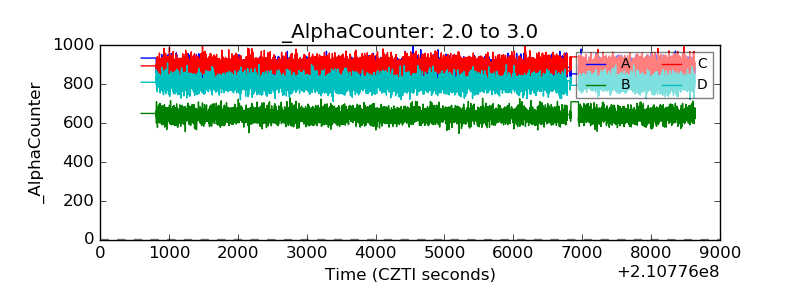 |
| _CPM_Rate | 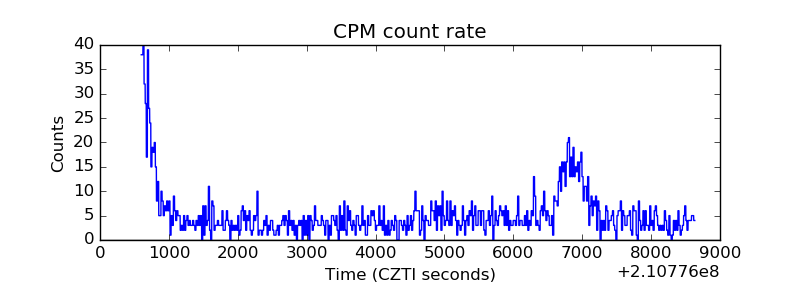 |
| CZT Counter | 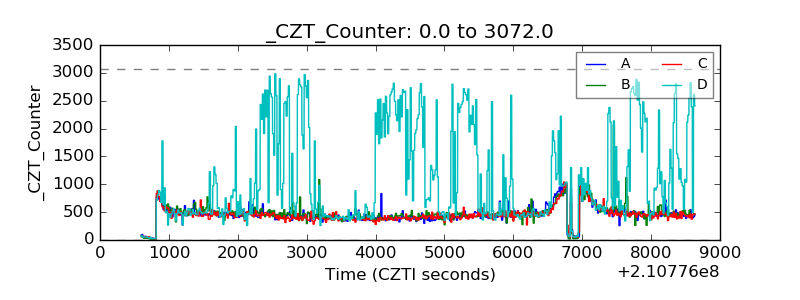 |
| +2.5 Volts monitor | 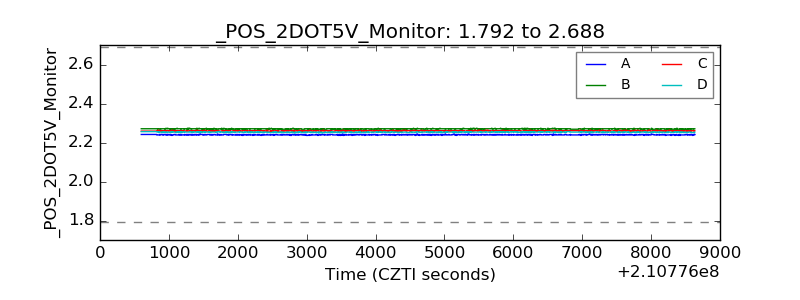 |
| +5 Volts monitor |  |
| _ROLL_ROT | 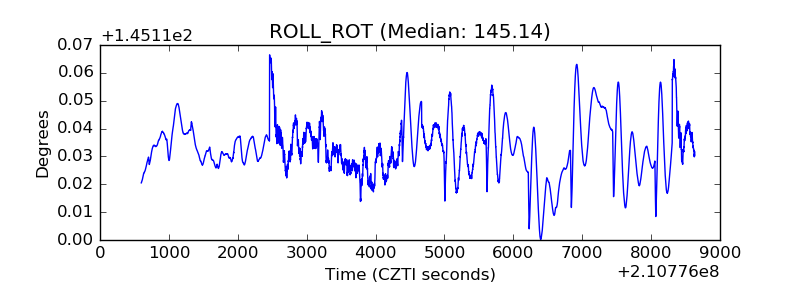 |
| _Roll_DEC | 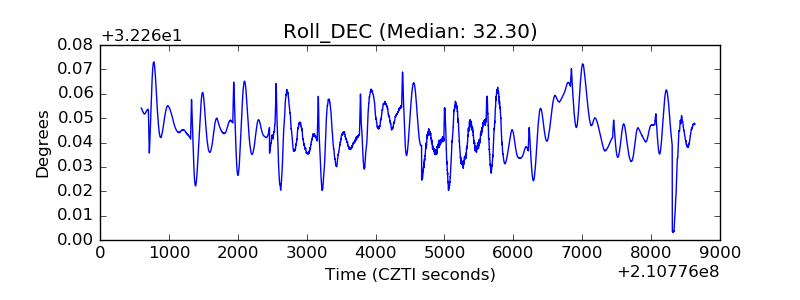 |
| _Roll_RA | 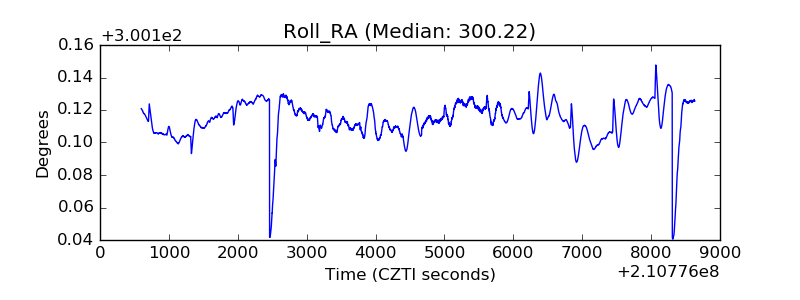 |
| Veto Counter | 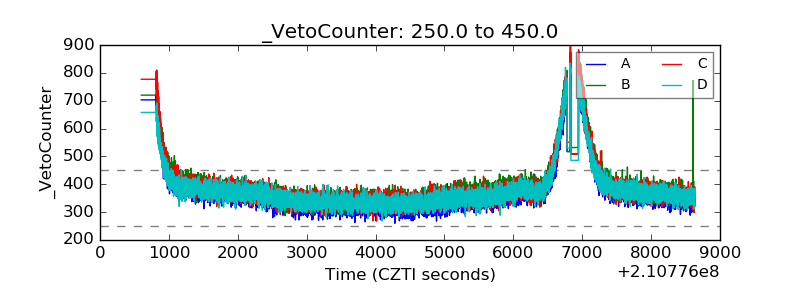 |