| Param | Original file | Final file |
|---|---|---|
| Filename | modeM0/AS1G05_103T01_9000000642_05085cztM0_level2.evt | modeM0/AS1G05_103T01_9000000642_05085cztM0_level2_quad_clean.evt |
| Size (bytes) | 682,251,840 | 95,448,960 |
| Size | 650.6 MB | 91.0 MB |
| Events in quadrant A | 3,738,625 | 617,714 |
| Events in quadrant B | 3,927,326 | 625,657 |
| Events in quadrant C | 3,663,192 | 611,825 |
| Events in quadrant D | 8,799,721 | 487,709 |
| Mode SS | |||
|---|---|---|---|
| Quadrant | BADHDUFLAG | Total packets | Discarded packets |
| A | 0 | 158 | 0 |
| B | 0 | 158 | 0 |
| C | 0 | 158 | 0 |
| D | 0 | 158 | 0 |
| Mode M0 | |||
|---|---|---|---|
| Quadrant | BADHDUFLAG | Total packets | Discarded packets |
| A | 0 | 16652 | 2 |
| B | 0 | 16930 | 1 |
| C | 0 | 16551 | 1 |
| D | 0 | 31666 | 1 |
| Quadrant | Total seconds | Saturated seconds | Saturation percentage |
|---|---|---|---|
| A | 7861 | 194 | 2.467879% |
| B | 7861 | 187 | 2.378832% |
| C | 7861 | 86 | 1.094008% |
| D | 7861 | 2066 | 26.281644% |
Noise dominated data is calculated using 1-second bins in cleaned event files. If a bin has >2000 counts, and if more than 50% of those come from <1% of pixels, then it is considered to be noise-dominated and hence unusable.
| Quadrant | # 1 sec bins | Bins with >0 counts | Bins with >2000 counts | High rate bins dominated by noise | Noise dominated (total time) | Noise dominated (detector-on time) | Marked lightcurve |
|---|---|---|---|---|---|---|---|
| A | 7881 | 7862 | 1 | 1 | 0.01% | 0.01% | 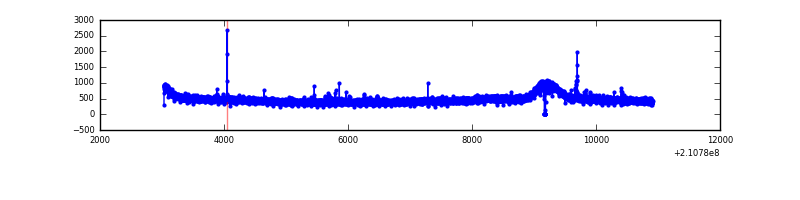 |
| B | 7881 | 7862 | 4 | 4 | 0.05% | 0.05% | 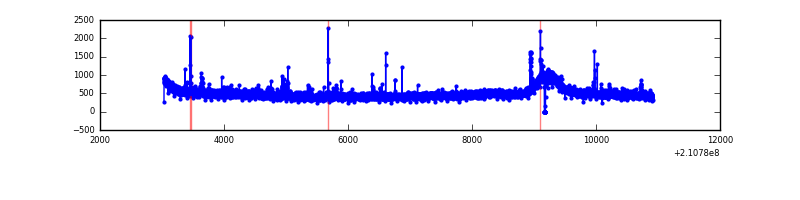 |
| C | 7881 | 7862 | 0 | 0 | 0.00% | 0.00% | 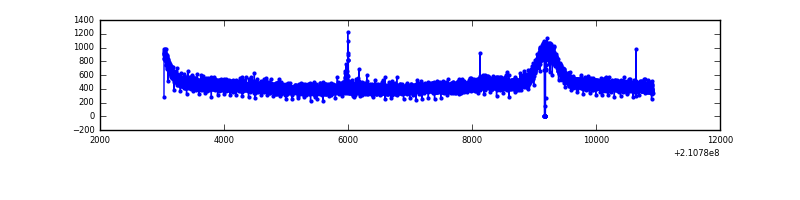 |
| D | 7881 | 7862 | 1419 | 1419 | 18.01% | 18.05% | 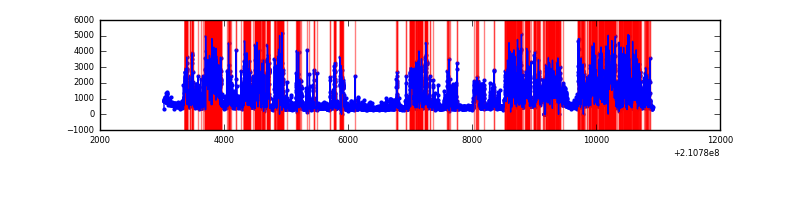 |
Top three noisy pixels from each quadrant. If the there are fewer than three noisy pixels in the level2.evt file, extra rows are filled as -1
| Pixel properties | Quadrant properties | ||||||
|---|---|---|---|---|---|---|---|
| Quadrant | DetID | PixID | Counts | Sigma | Mean | Median | Sigma |
| A | 0 | 50 | 28062 | 138.62 | 957 | 936 | 195.7 |
| A | 13 | 251 | 18660 | 90.57 | 957 | 936 | 195.7 |
| A | 12 | 194 | 9699 | 44.78 | 957 | 936 | 195.7 |
| B | 15 | 204 | 59824 | 314.59 | 964 | 943 | 187.2 |
| B | 0 | 219 | 59189 | 311.2 | 964 | 943 | 187.2 |
| B | 0 | 187 | 26666 | 137.43 | 964 | 943 | 187.2 |
| C | 9 | 54 | 13039 | 55.55 | 931 | 936 | 217.9 |
| C | 13 | 61 | 7638 | 30.76 | 931 | 936 | 217.9 |
| C | 1 | 16 | 6378 | 24.98 | 931 | 936 | 217.9 |
| D | 12 | 22 | 3946217 | 19636.0 | 811 | 784 | 200.9 |
| D | 13 | 239 | 471416 | 2342.29 | 811 | 784 | 200.9 |
| D | 12 | 233 | 463684 | 2303.8 | 811 | 784 | 200.9 |
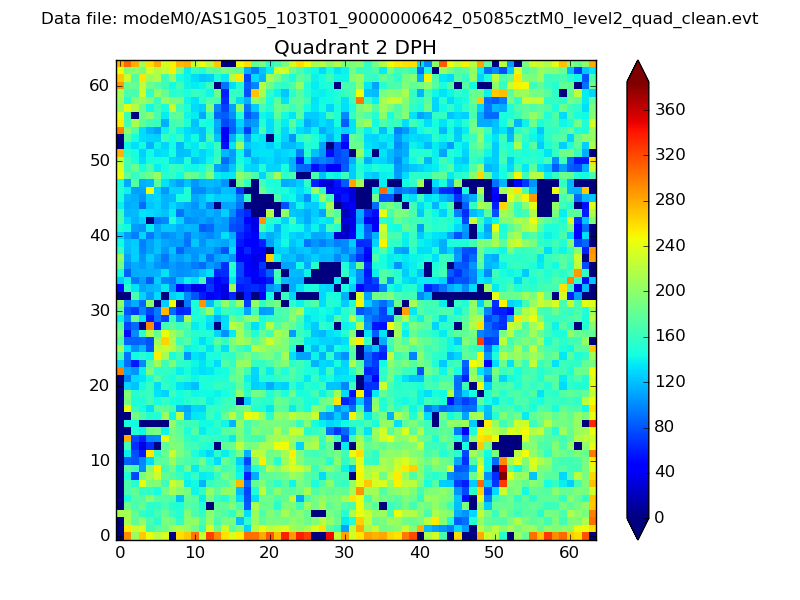
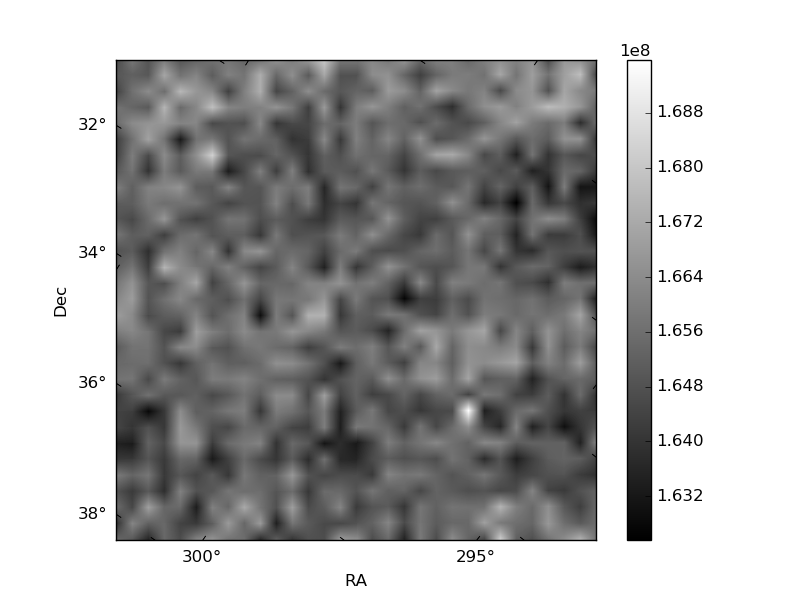
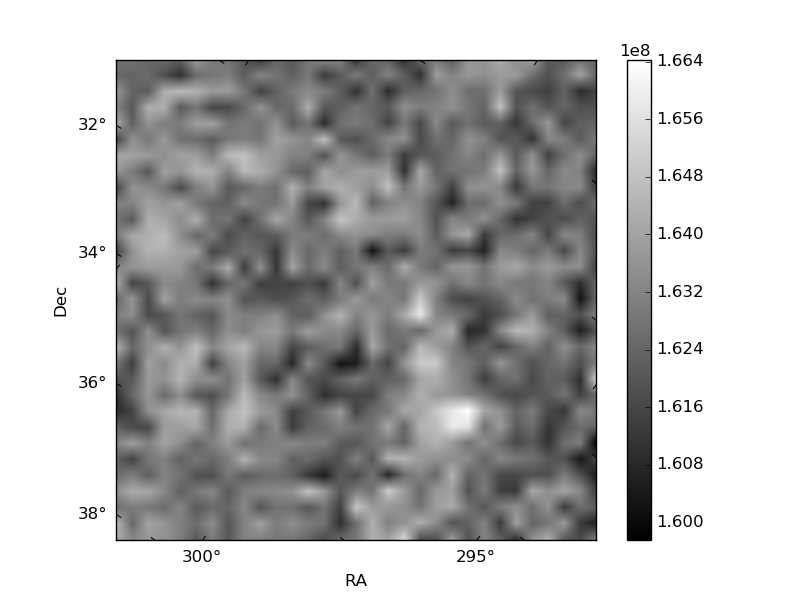
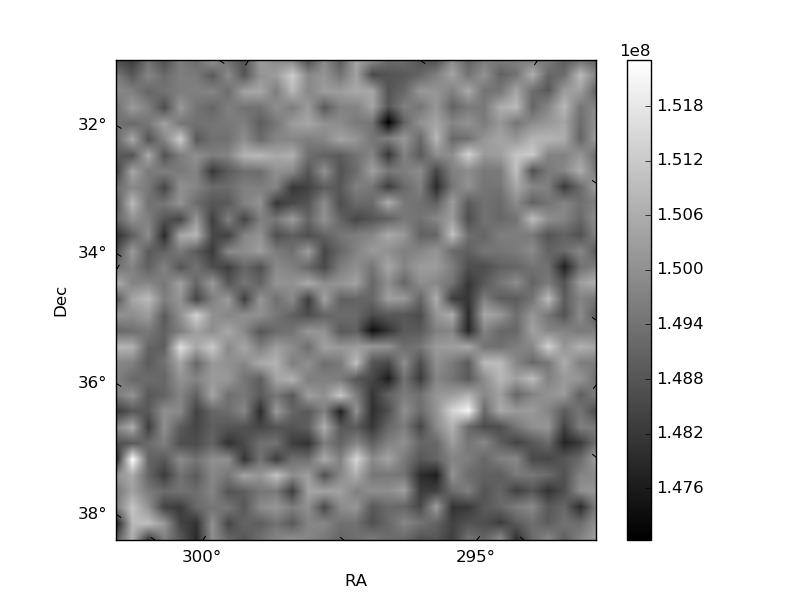
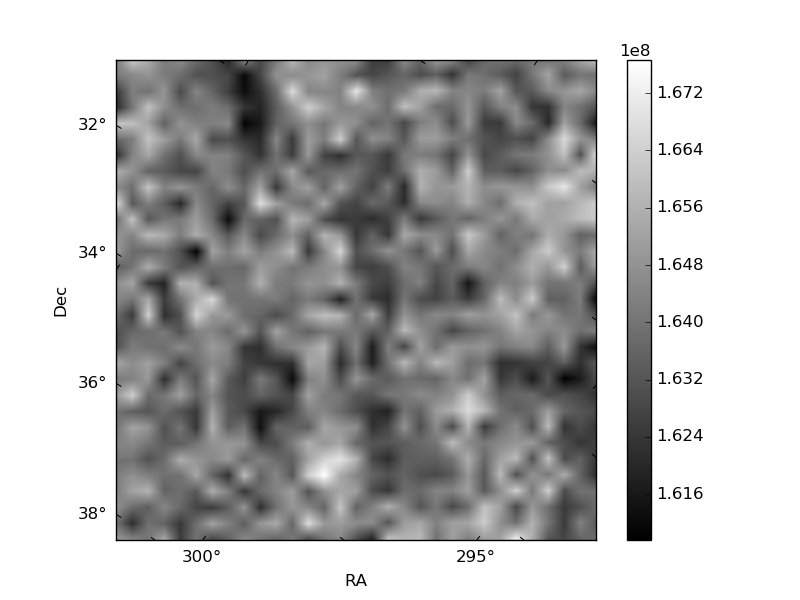
Histogram calculated using DETX and DETY for each event in the final _common_clean file
| Quadrant A | 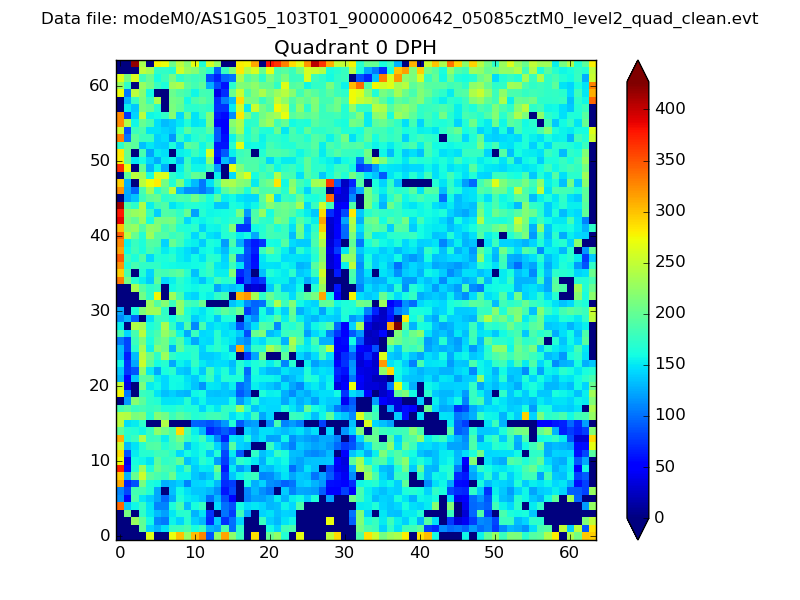 |
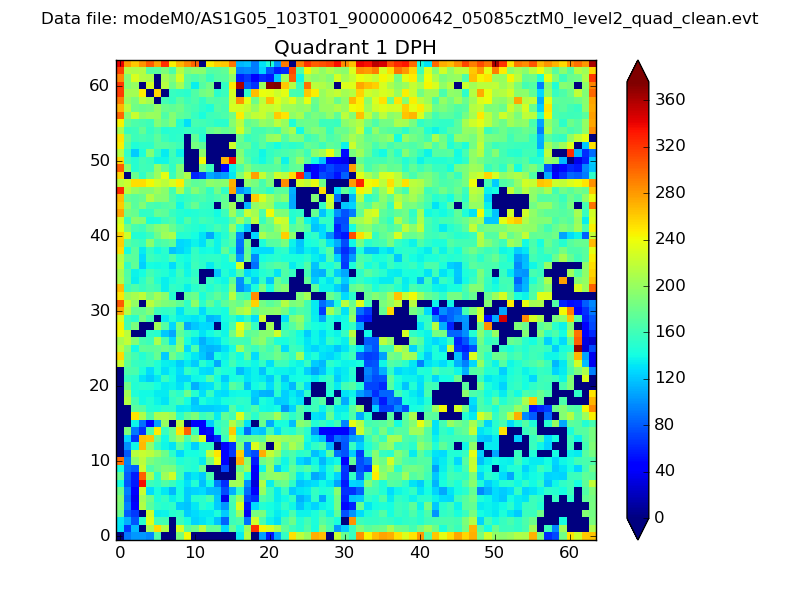 |
Quadrant B |
|---|---|---|---|
| Quadrant D | 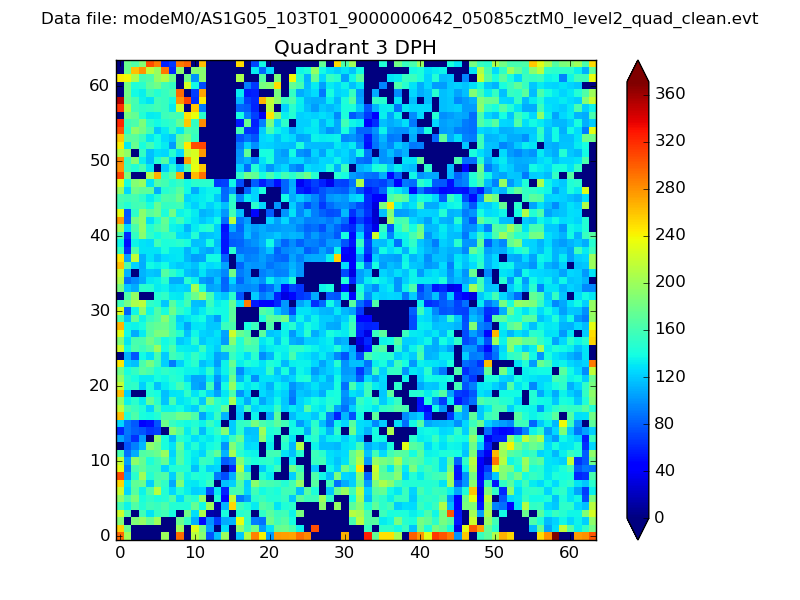 |
 |
Quadrant C |
| Plot type | Count rate plots | Images |
|---|---|---|
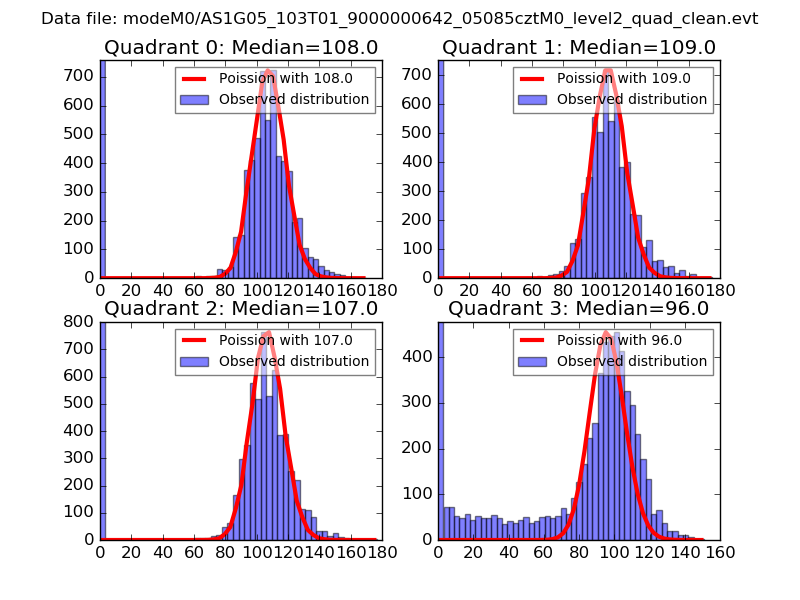
| Comparison with Poisson distribution Blue bars denote a histogram of data divided into 1 sec bins. Red curve is a Poisson curve with rate = median count rate of data. |
 |
 |
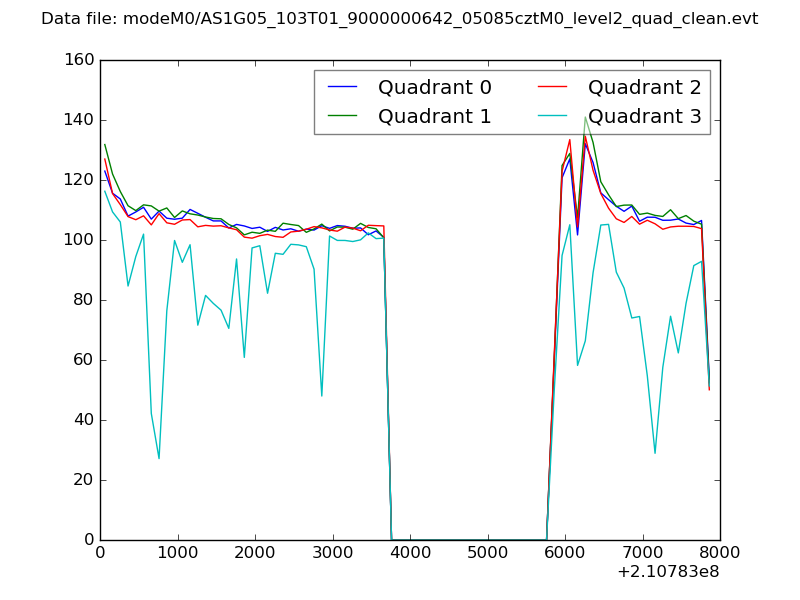
| Quadrant-wise count rates Data is divided into 100 sec bins |
 |
|
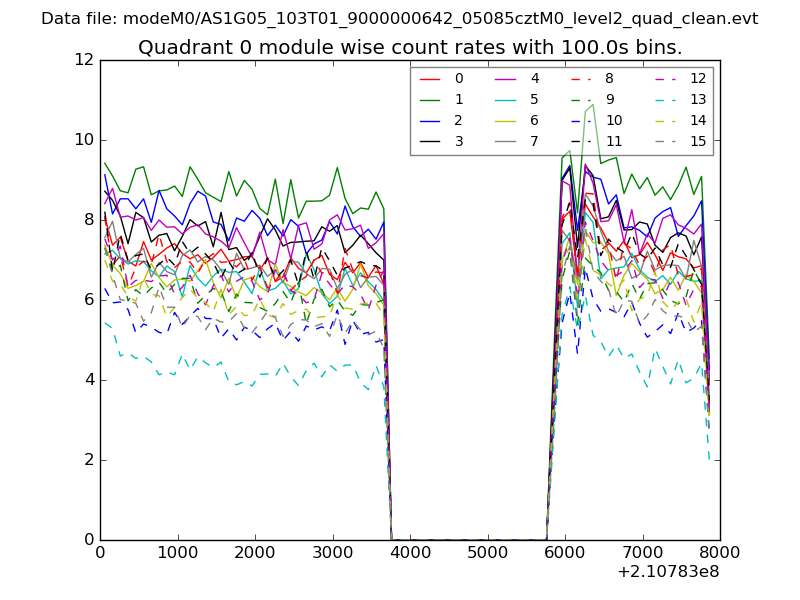
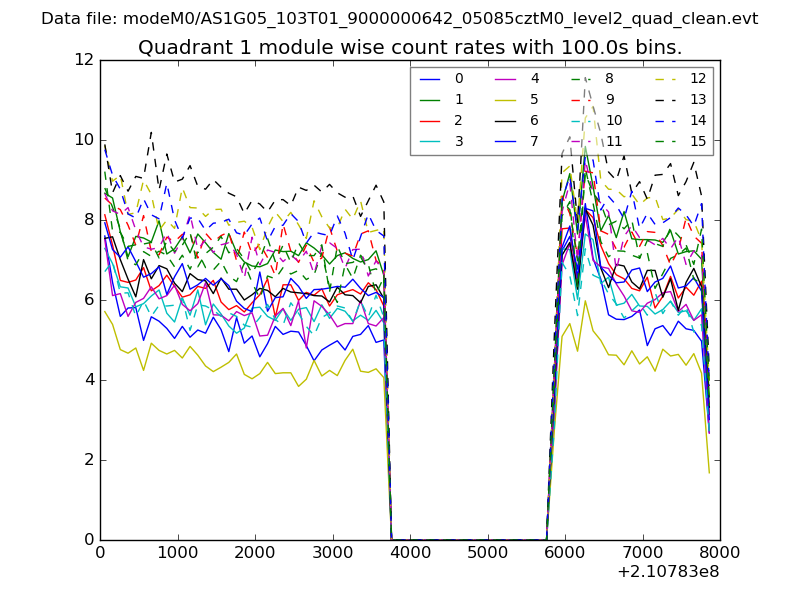
| Module-wise count rates for Quadrant A Data is divided into 100 sec bins |
 |
 |
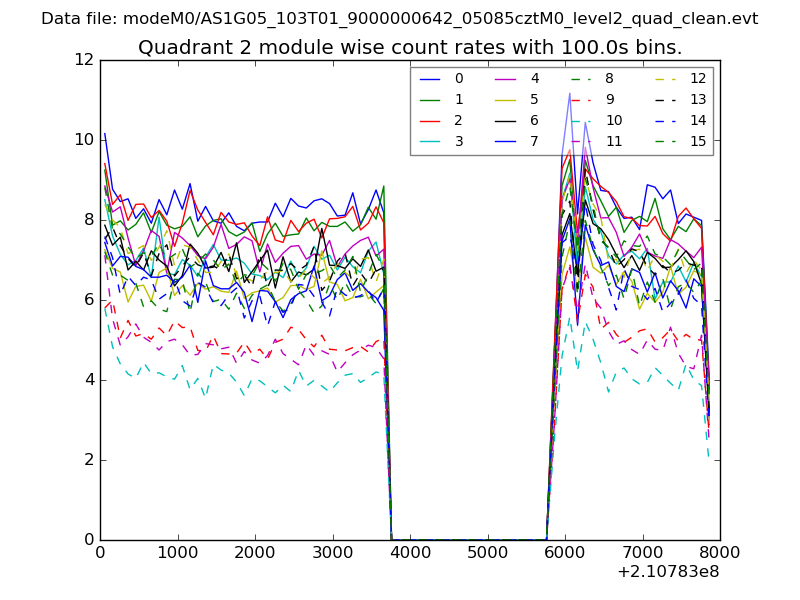
| Module-wise count rates for Quadrant B Data is divided into 100 sec bins |
 |
 |
| Module-wise count rates for Quadrant C Data is divided into 100 sec bins |
 |
 |
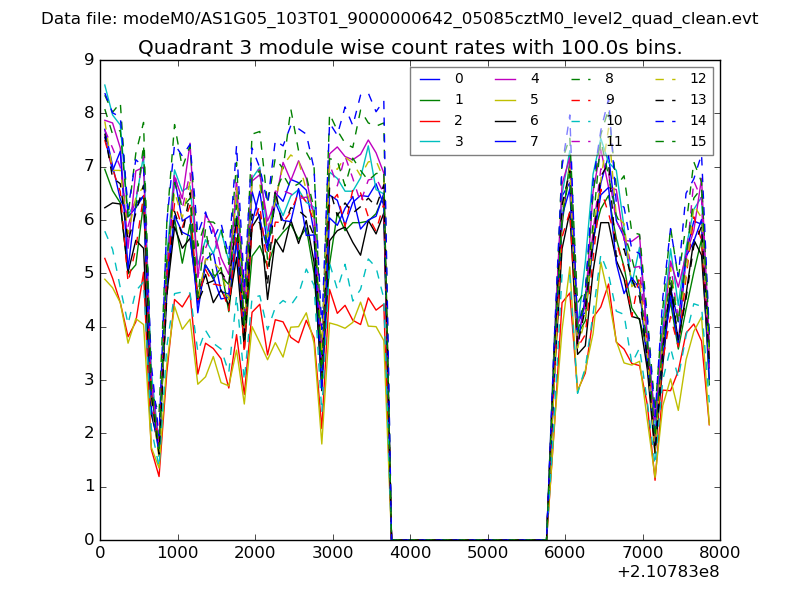
| Module-wise count rates for Quadrant D Data is divided into 100 sec bins |
 |
 |
| Parameter | Plot |
|---|---|
| CZT HV Monitor | 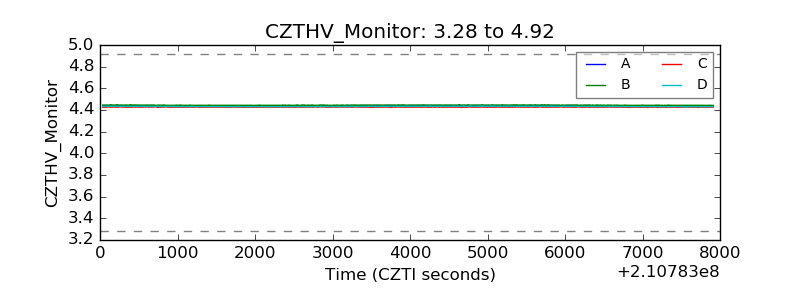 |
| D_VDD | 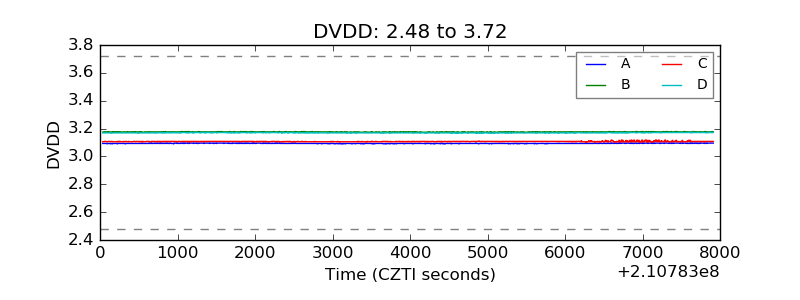 |
| Temperature 1 | 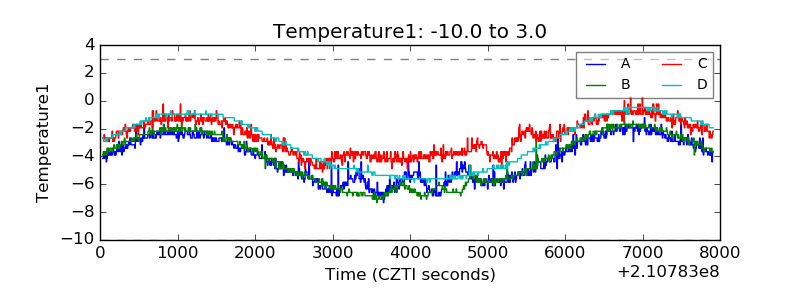 |
| Veto HV Monitor | 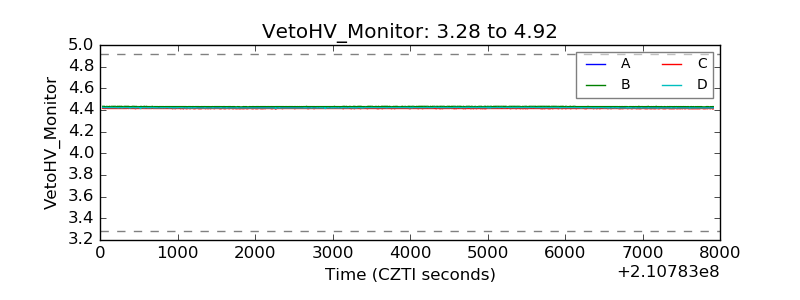 |
| Veto LLD | 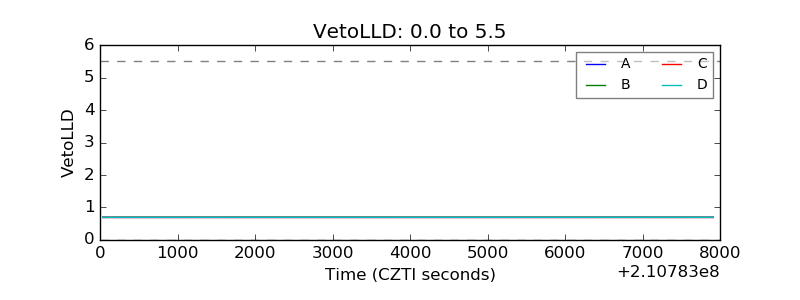 |
| Alpha Counter | 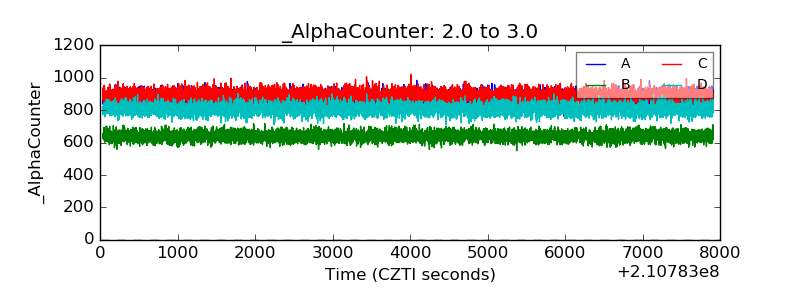 |
| _CPM_Rate | 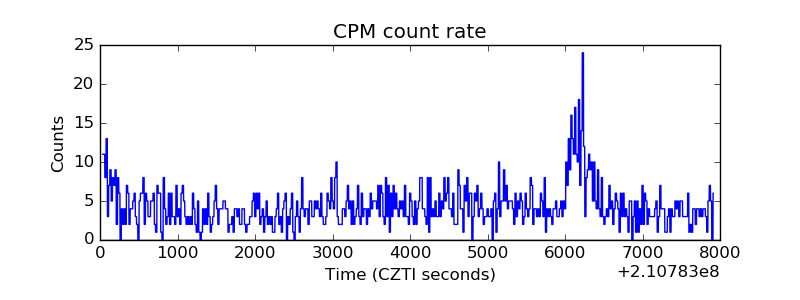 |
| CZT Counter | 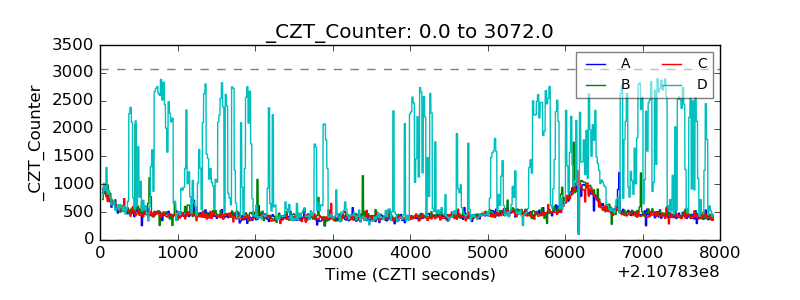 |
| +2.5 Volts monitor |  |
| +5 Volts monitor |  |
| _ROLL_ROT | 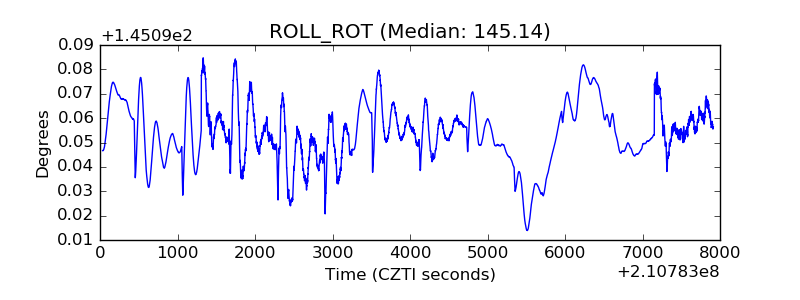 |
| _Roll_DEC | 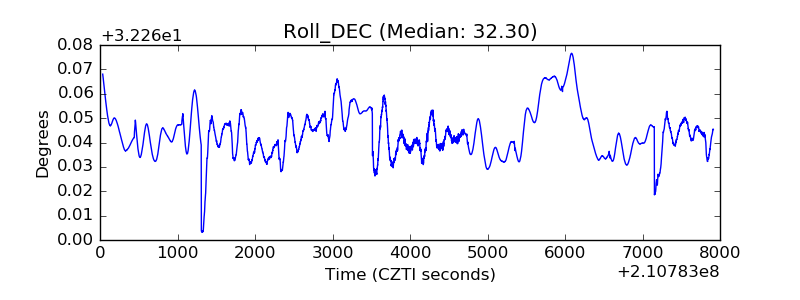 |
| _Roll_RA | 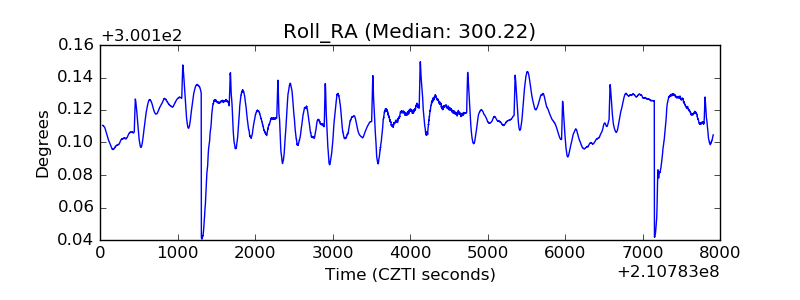 |
| Veto Counter | 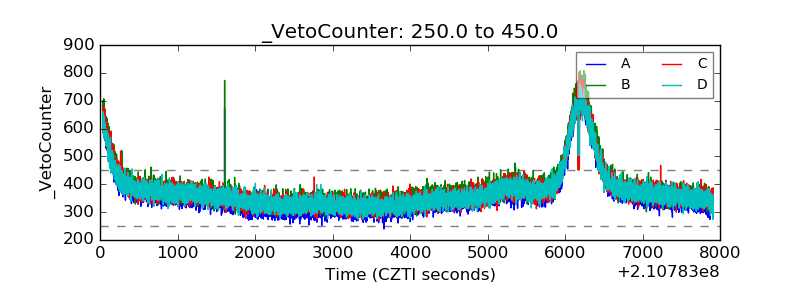 |