| Param | Original file | Final file |
|---|---|---|
| Filename | modeM0/AS1G05_103T01_9000000642_05086cztM0_level2.evt | modeM0/AS1G05_103T01_9000000642_05086cztM0_level2_quad_clean.evt |
| Size (bytes) | 652,682,880 | 97,102,080 |
| Size | 622.4 MB | 92.6 MB |
| Events in quadrant A | 3,690,794 | 618,641 |
| Events in quadrant B | 3,852,423 | 629,566 |
| Events in quadrant C | 3,644,573 | 617,618 |
| Events in quadrant D | 8,044,227 | 526,240 |
| Mode SS | |||
|---|---|---|---|
| Quadrant | BADHDUFLAG | Total packets | Discarded packets |
| A | 0 | 160 | 0 |
| B | 0 | 160 | 0 |
| C | 0 | 160 | 0 |
| D | 0 | 160 | 0 |
| Mode M0 | |||
|---|---|---|---|
| Quadrant | BADHDUFLAG | Total packets | Discarded packets |
| A | 0 | 16644 | 9 |
| B | 0 | 16873 | 4 |
| C | 0 | 16507 | 2 |
| D | 0 | 29304 | 12 |
| Mode M9 | |||
|---|---|---|---|
| Quadrant | BADHDUFLAG | Total packets | Discarded packets |
| A | 0 | 3 | 0 |
| B | 0 | 3 | 0 |
| C | 0 | 3 | 0 |
| D | 0 | 3 | 0 |
| Quadrant | Total seconds | Saturated seconds | Saturation percentage |
|---|---|---|---|
| A | 7878 | 201 | 2.551409% |
| B | 7880 | 188 | 2.385787% |
| C | 7881 | 100 | 1.268875% |
| D | 7879 | 1616 | 20.510217% |
Noise dominated data is calculated using 1-second bins in cleaned event files. If a bin has >2000 counts, and if more than 50% of those come from <1% of pixels, then it is considered to be noise-dominated and hence unusable.
| Quadrant | # 1 sec bins | Bins with >0 counts | Bins with >2000 counts | High rate bins dominated by noise | Noise dominated (total time) | Noise dominated (detector-on time) | Marked lightcurve |
|---|---|---|---|---|---|---|---|
| A | 8216 | 7883 | 2 | 2 | 0.02% | 0.03% | 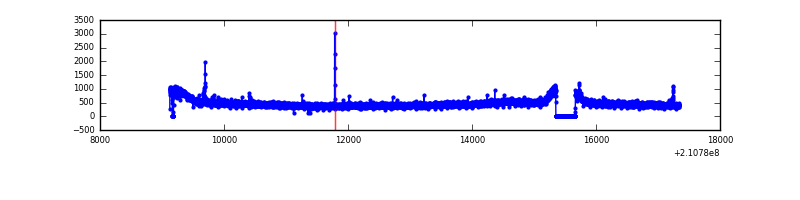 |
| B | 8216 | 7883 | 3 | 3 | 0.04% | 0.04% | 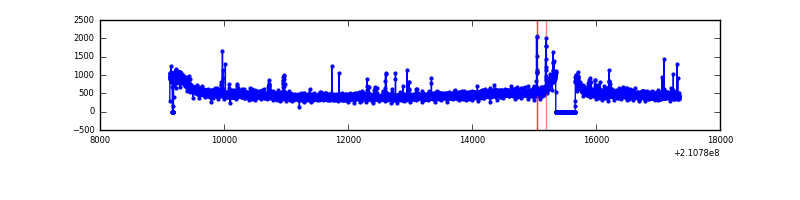 |
| C | 8216 | 7883 | 0 | 0 | 0.00% | 0.00% | 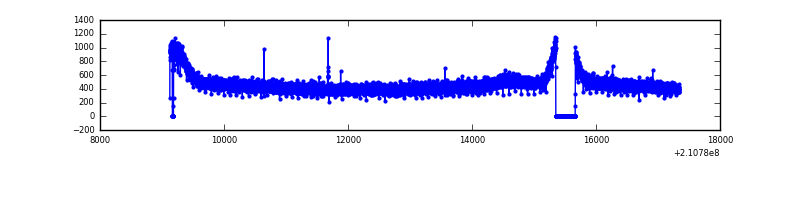 |
| D | 8216 | 7883 | 1212 | 1212 | 14.75% | 15.37% | 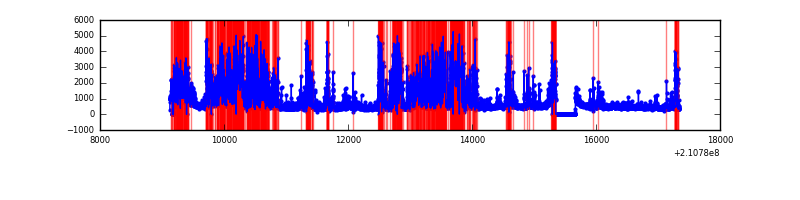 |
Top three noisy pixels from each quadrant. If the there are fewer than three noisy pixels in the level2.evt file, extra rows are filled as -1
| Pixel properties | Quadrant properties | ||||||
|---|---|---|---|---|---|---|---|
| Quadrant | DetID | PixID | Counts | Sigma | Mean | Median | Sigma |
| A | 0 | 50 | 24556 | 121.69 | 947 | 927 | 194.2 |
| A | 13 | 251 | 10403 | 48.8 | 947 | 927 | 194.2 |
| A | 12 | 194 | 9606 | 44.7 | 947 | 927 | 194.2 |
| B | 0 | 219 | 48256 | 253.99 | 957 | 936 | 186.3 |
| B | 15 | 54 | 37705 | 197.36 | 957 | 936 | 186.3 |
| B | 15 | 204 | 33558 | 175.1 | 957 | 936 | 186.3 |
| C | 8 | 128 | 9365 | 38.84 | 925 | 931 | 217.1 |
| C | 1 | 16 | 7595 | 30.69 | 925 | 931 | 217.1 |
| C | 13 | 61 | 7414 | 29.86 | 925 | 931 | 217.1 |
| D | 12 | 22 | 3372633 | 16676.77 | 820 | 794 | 202.2 |
| D | 13 | 239 | 641266 | 3167.71 | 820 | 794 | 202.2 |
| D | 12 | 233 | 383242 | 1891.55 | 820 | 794 | 202.2 |
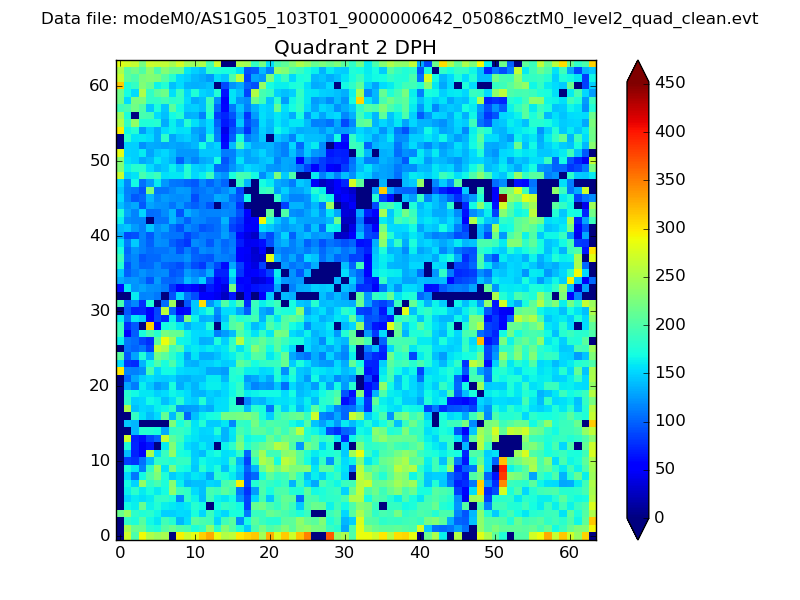
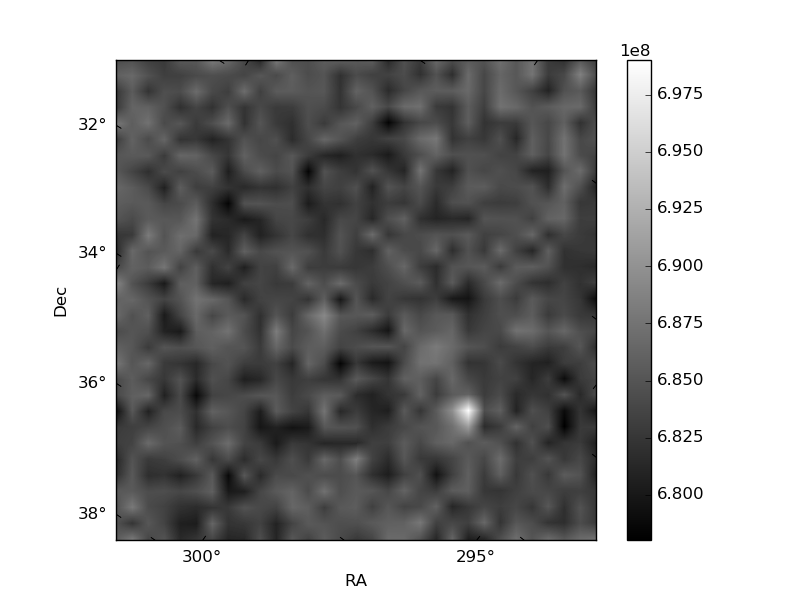
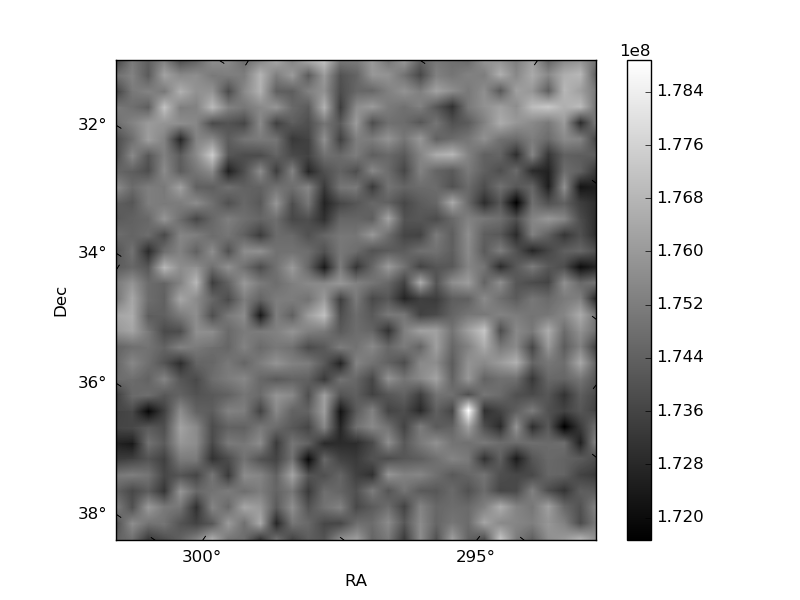
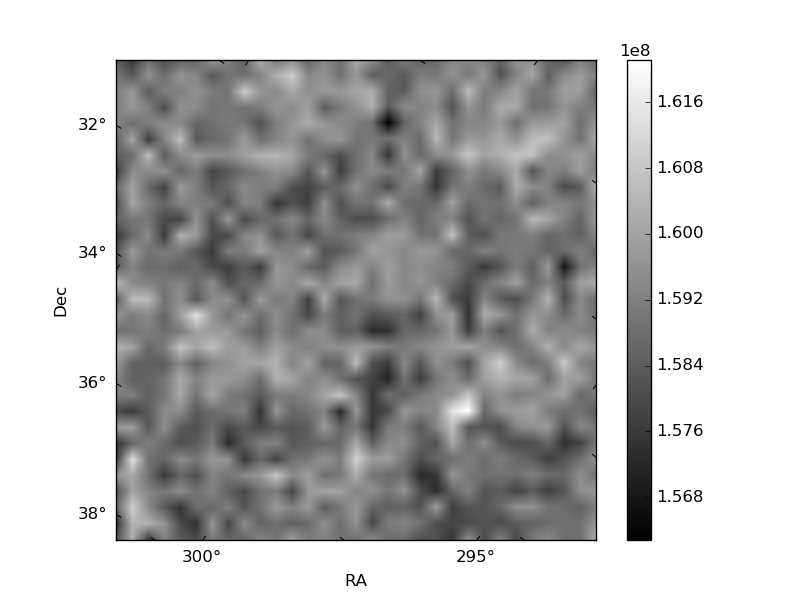
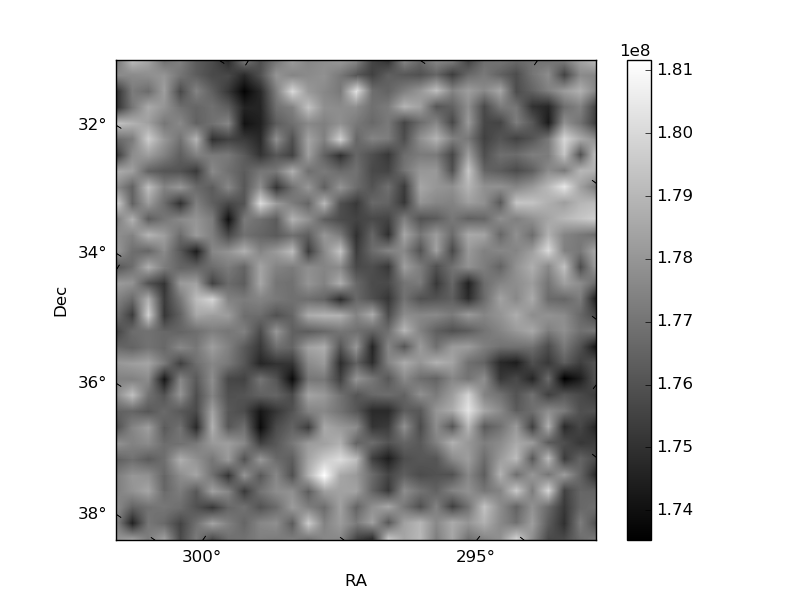
Histogram calculated using DETX and DETY for each event in the final _common_clean file
| Quadrant A | 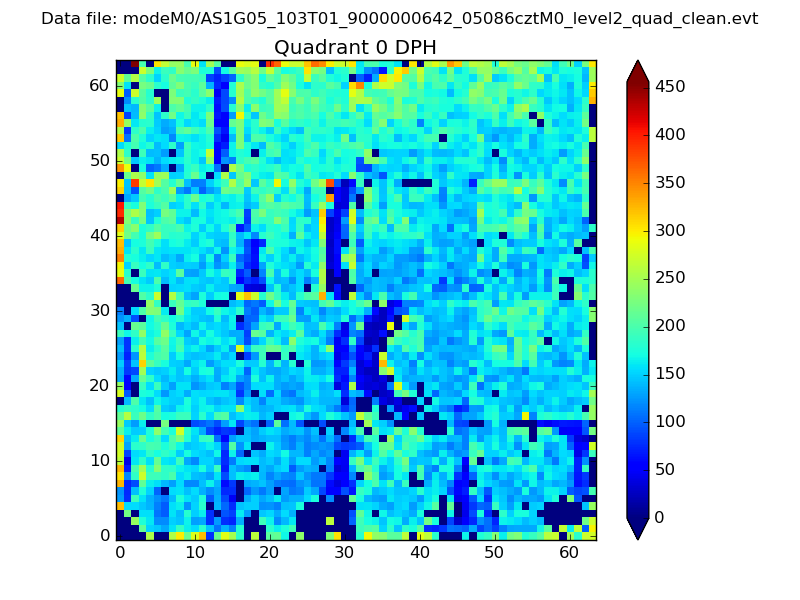 |
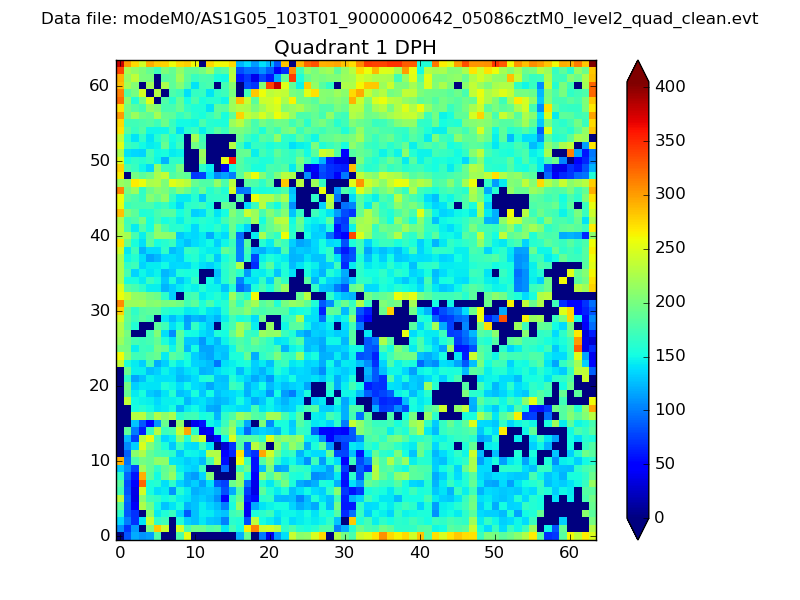 |
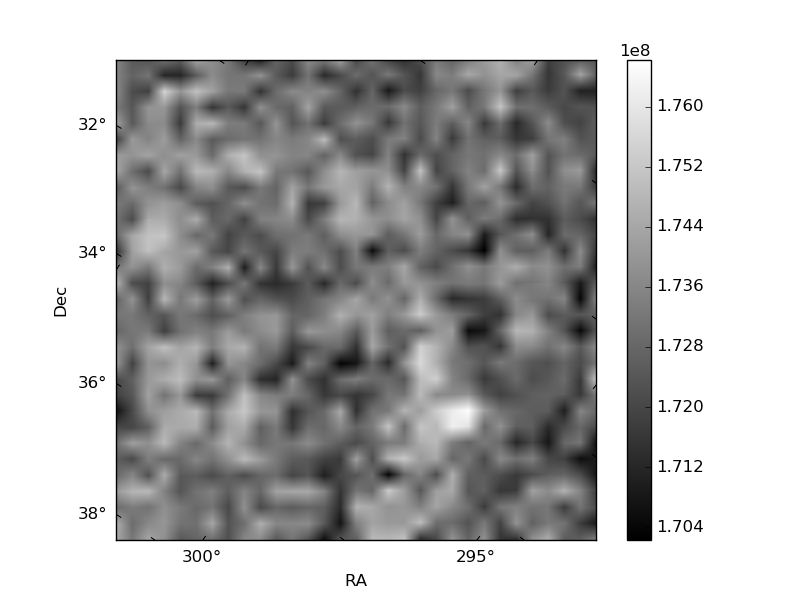
Quadrant B |
|---|---|---|---|
| Quadrant D | 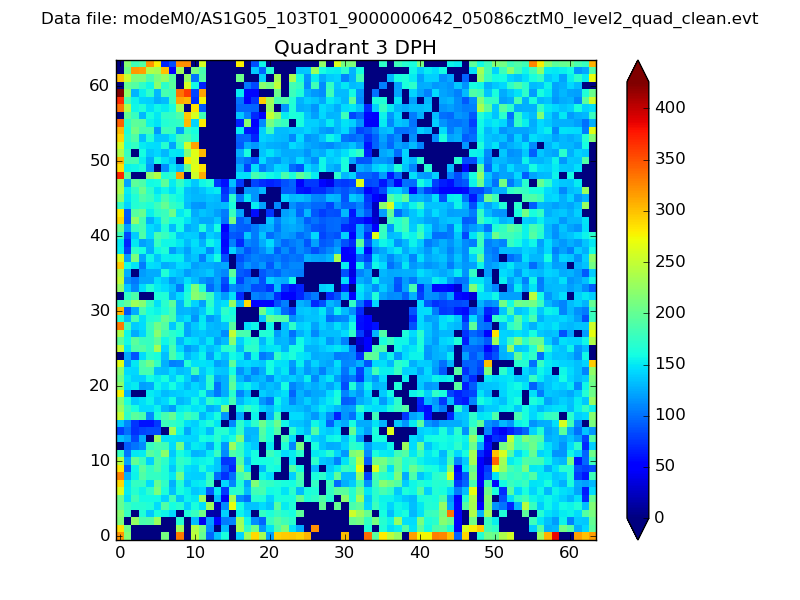 |
 |
Quadrant C |
| Plot type | Count rate plots | Images |
|---|---|---|
| Comparison with Poisson distribution Blue bars denote a histogram of data divided into 1 sec bins. Red curve is a Poisson curve with rate = median count rate of data. |
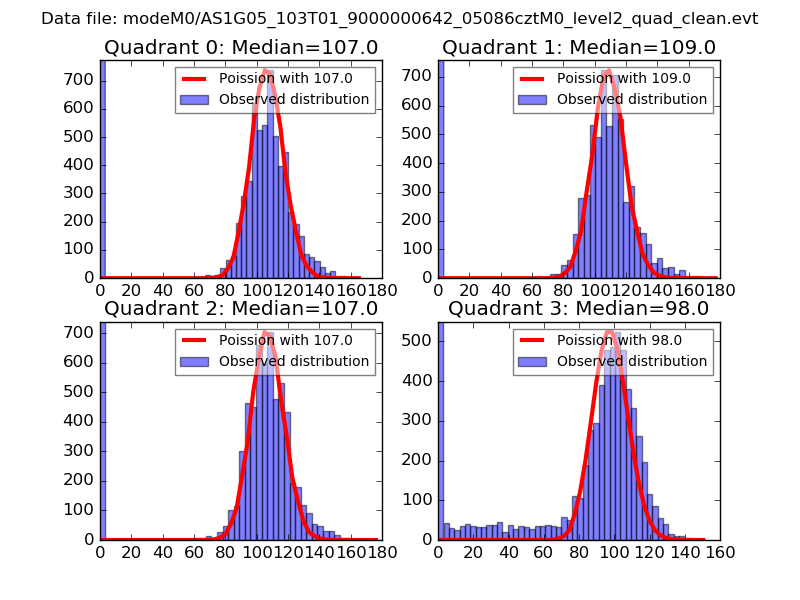 |
 |
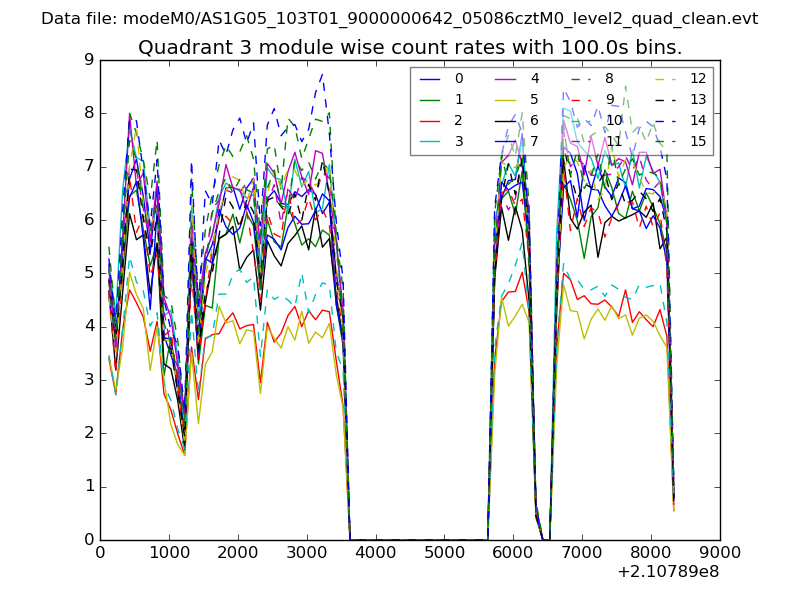
| Quadrant-wise count rates Data is divided into 100 sec bins |
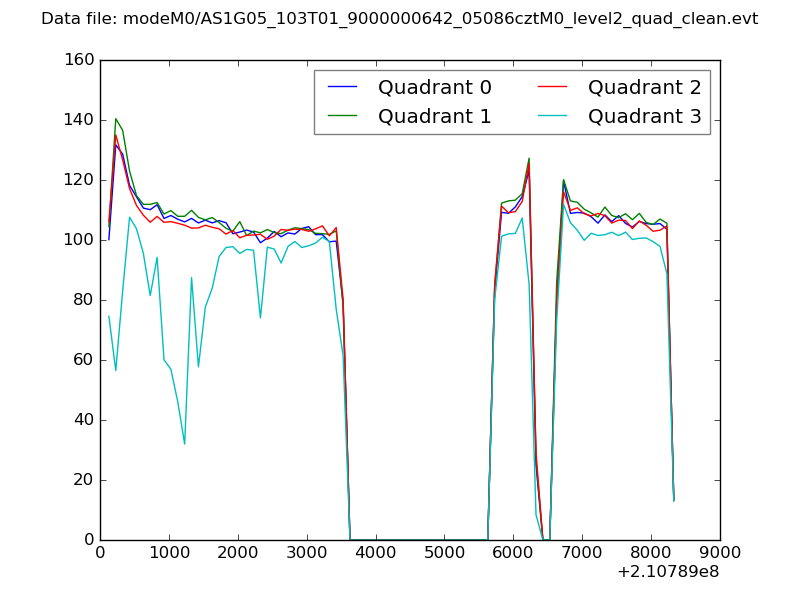 |
|
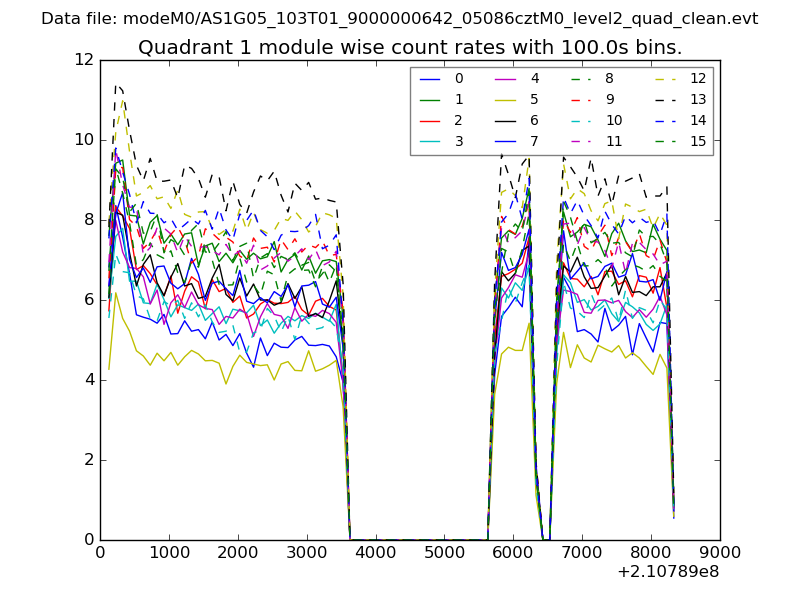
| Module-wise count rates for Quadrant A Data is divided into 100 sec bins |
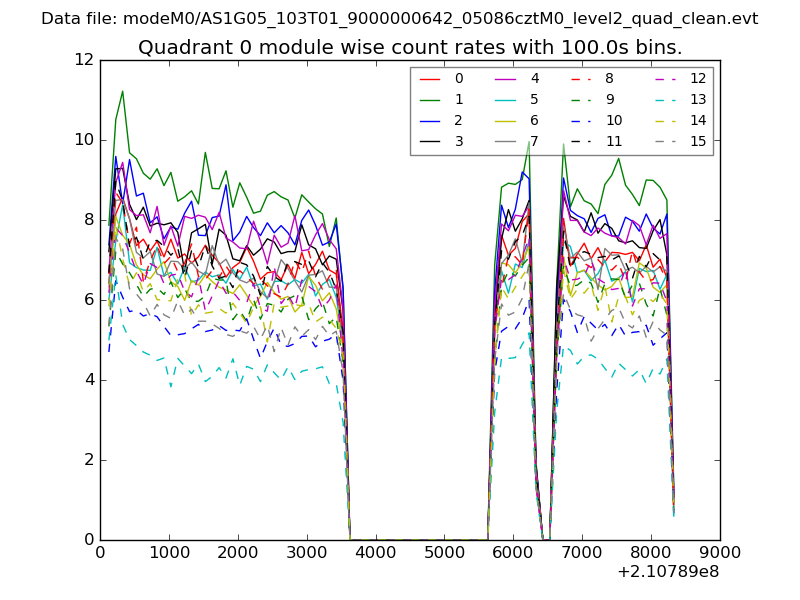 |
 |
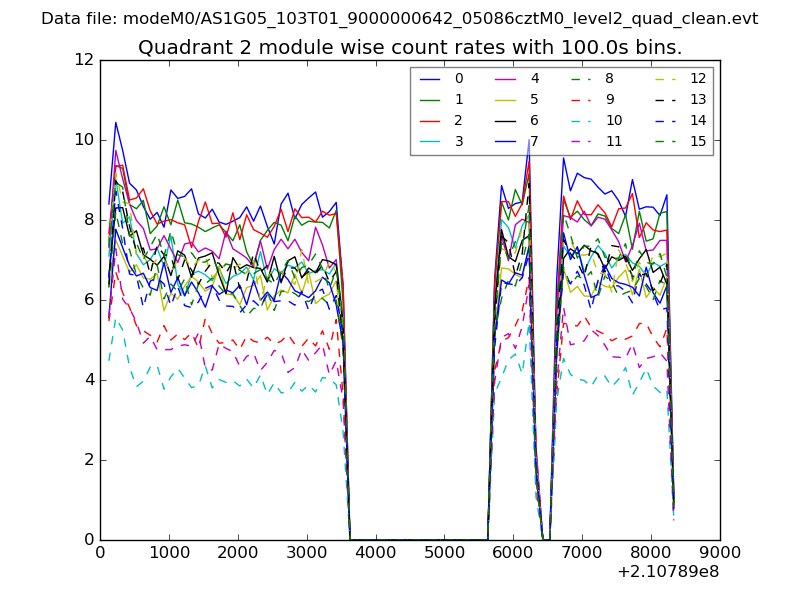
| Module-wise count rates for Quadrant B Data is divided into 100 sec bins |
 |
 |
| Module-wise count rates for Quadrant C Data is divided into 100 sec bins |
 |
 |
| Module-wise count rates for Quadrant D Data is divided into 100 sec bins |
 |
 |
| Parameter | Plot |
|---|---|
| CZT HV Monitor | 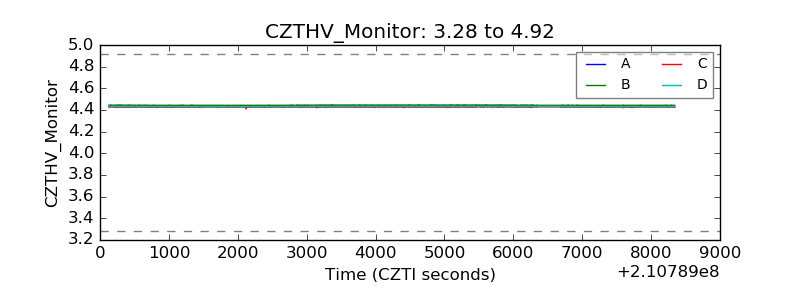 |
| D_VDD | 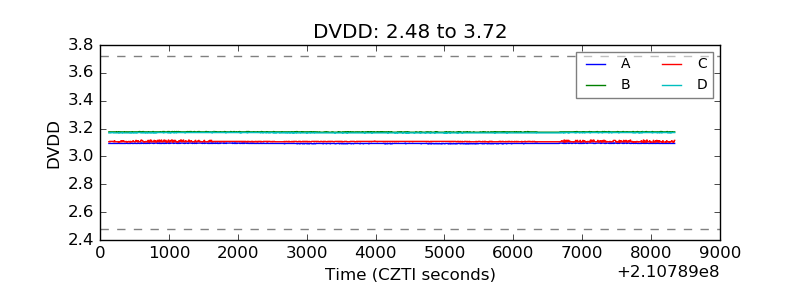 |
| Temperature 1 | 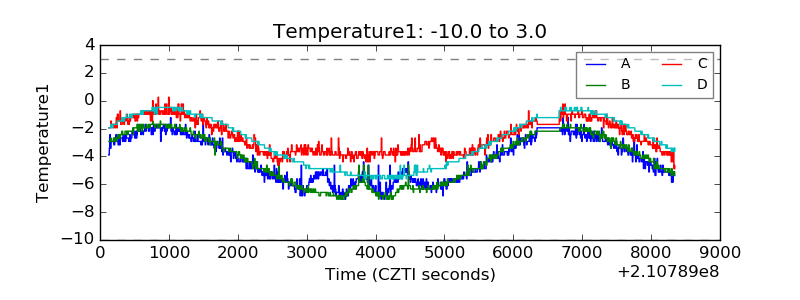 |
| Veto HV Monitor | 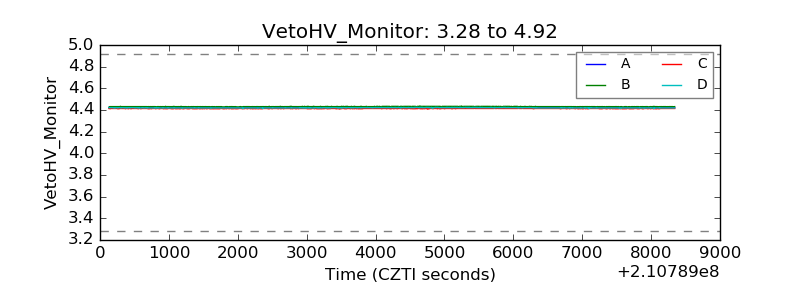 |
| Veto LLD | 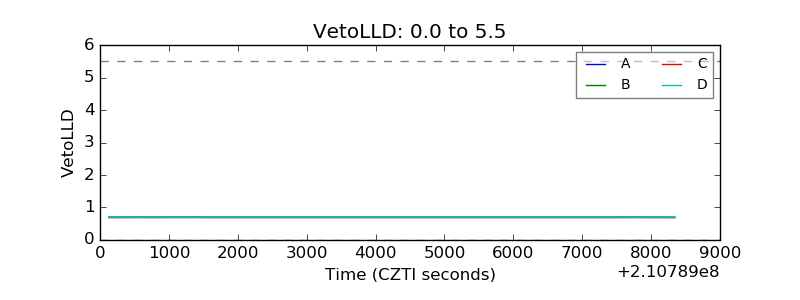 |
| Alpha Counter | 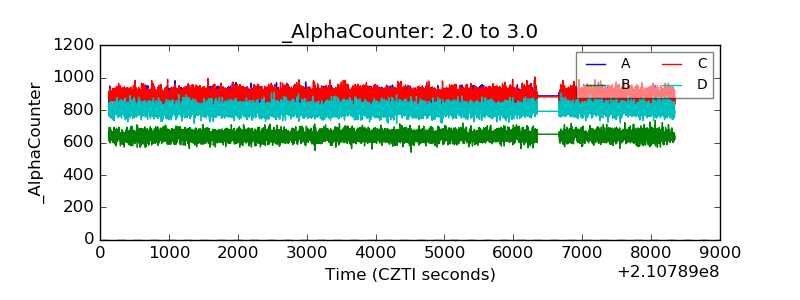 |
| _CPM_Rate | 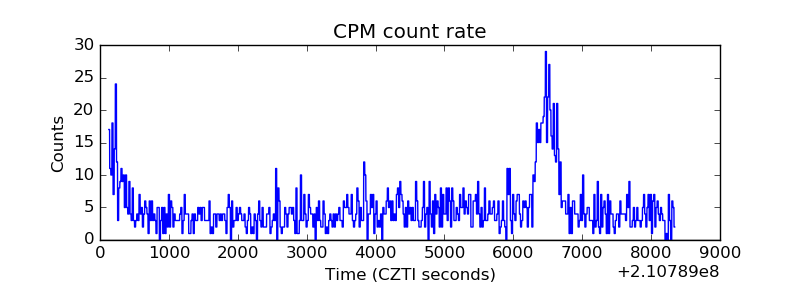 |
| CZT Counter | 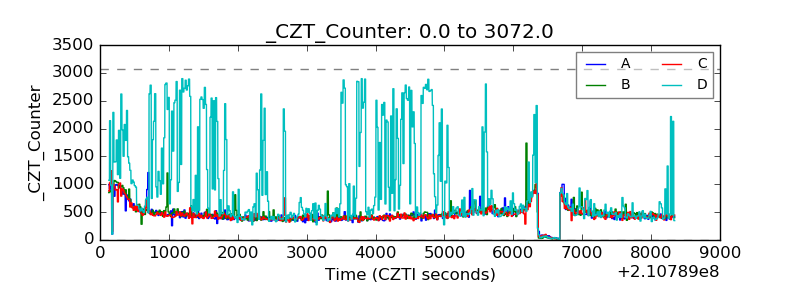 |
| +2.5 Volts monitor | 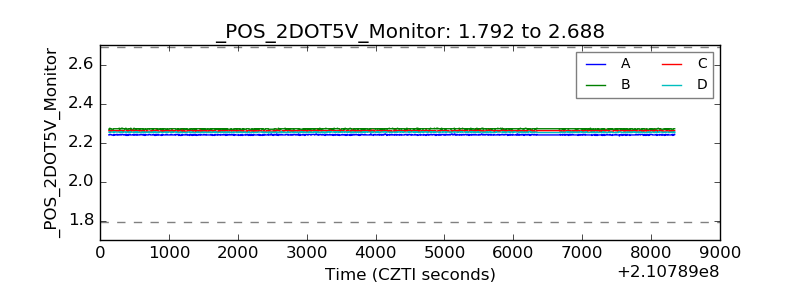 |
| +5 Volts monitor | 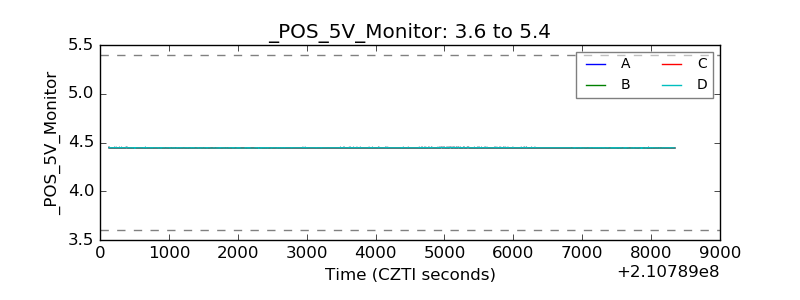 |
| _ROLL_ROT | 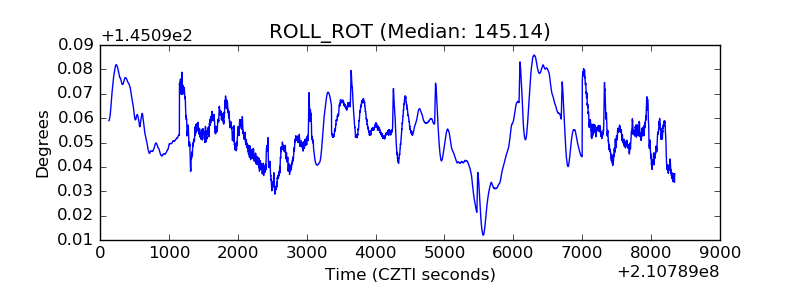 |
| _Roll_DEC | 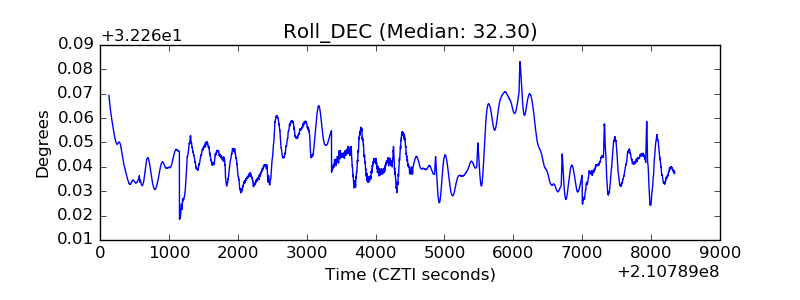 |
| _Roll_RA | 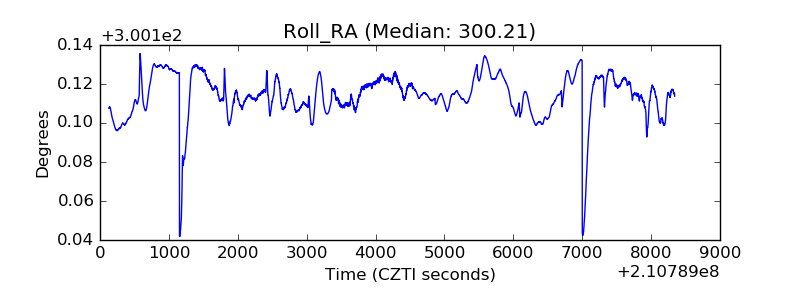 |
| Veto Counter | 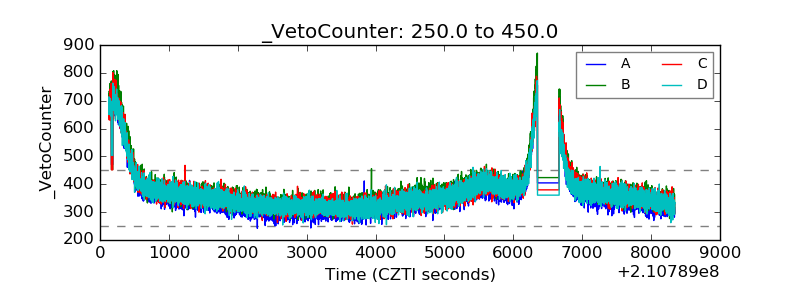 |