| Param | Original file | Final file |
|---|---|---|
| Filename | modeM0/AS1G05_103T01_9000000642_05088cztM0_level2.evt | modeM0/AS1G05_103T01_9000000642_05088cztM0_level2_quad_clean.evt |
| Size (bytes) | 1,025,625,600 | 152,654,400 |
| Size | 978.1 MB | 145.6 MB |
| Events in quadrant A | 6,073,309 | 963,312 |
| Events in quadrant B | 6,261,696 | 970,885 |
| Events in quadrant C | 5,836,908 | 958,971 |
| Events in quadrant D | 12,000,404 | 821,580 |
| Mode SS | |||
|---|---|---|---|
| Quadrant | BADHDUFLAG | Total packets | Discarded packets |
| A | 0 | 270 | 0 |
| B | 0 | 270 | 0 |
| C | 0 | 270 | 0 |
| D | 0 | 270 | 0 |
| Mode M0 | |||
|---|---|---|---|
| Quadrant | BADHDUFLAG | Total packets | Discarded packets |
| A | 0 | 27601 | 4 |
| B | 0 | 27634 | 3 |
| C | 0 | 26865 | 3 |
| D | 0 | 44696 | 3 |
| Mode M9 | |||
|---|---|---|---|
| Quadrant | BADHDUFLAG | Total packets | Discarded packets |
| A | 0 | 14 | 0 |
| B | 0 | 14 | 0 |
| C | 0 | 14 | 0 |
| D | 0 | 14 | 0 |
| Quadrant | Total seconds | Saturated seconds | Saturation percentage |
|---|---|---|---|
| A | 13134 | 139 | 1.058322% |
| B | 13134 | 119 | 0.906045% |
| C | 13134 | 49 | 0.373078% |
| D | 13134 | 2094 | 15.943353% |
Noise dominated data is calculated using 1-second bins in cleaned event files. If a bin has >2000 counts, and if more than 50% of those come from <1% of pixels, then it is considered to be noise-dominated and hence unusable.
| Quadrant | # 1 sec bins | Bins with >0 counts | Bins with >2000 counts | High rate bins dominated by noise | Noise dominated (total time) | Noise dominated (detector-on time) | Marked lightcurve |
|---|---|---|---|---|---|---|---|
| A | 14664 | 13137 | 30 | 30 | 0.20% | 0.23% | 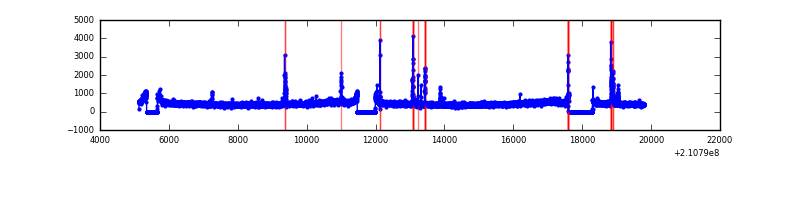 |
| B | 14664 | 13136 | 4 | 4 | 0.03% | 0.03% | 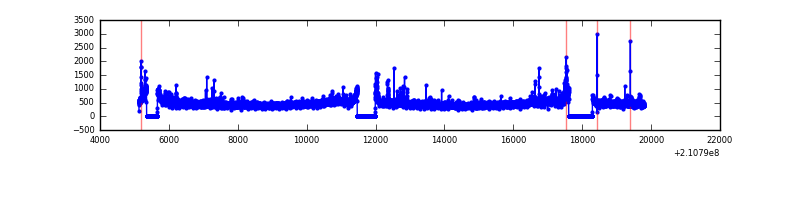 |
| C | 14664 | 13136 | 0 | 0 | 0.00% | 0.00% | 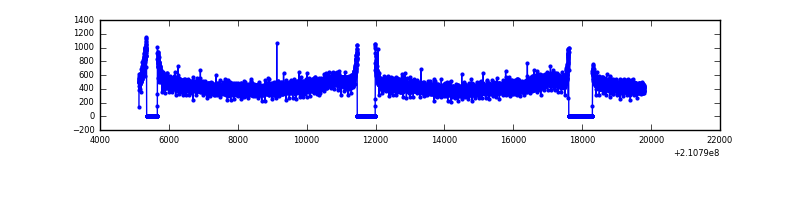 |
| D | 14664 | 13136 | 1709 | 1709 | 11.65% | 13.01% | 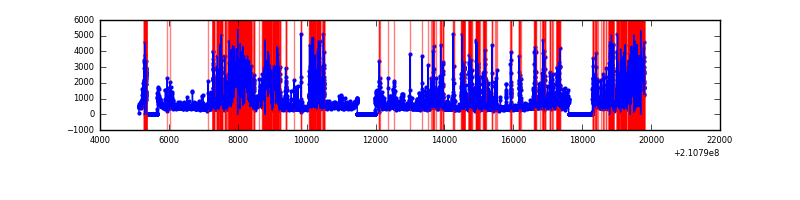 |
Top three noisy pixels from each quadrant. If the there are fewer than three noisy pixels in the level2.evt file, extra rows are filled as -1
| Pixel properties | Quadrant properties | ||||||
|---|---|---|---|---|---|---|---|
| Quadrant | DetID | PixID | Counts | Sigma | Mean | Median | Sigma |
| A | 15 | 174 | 160842 | 518.14 | 1515 | 1483 | 307.6 |
| A | 0 | 50 | 68866 | 219.09 | 1515 | 1483 | 307.6 |
| A | 12 | 194 | 15243 | 44.74 | 1515 | 1483 | 307.6 |
| B | 0 | 219 | 129634 | 432.94 | 1535 | 1501 | 296.0 |
| B | 15 | 204 | 110978 | 369.9 | 1535 | 1501 | 296.0 |
| B | 15 | 54 | 42083 | 137.12 | 1535 | 1501 | 296.0 |
| C | 8 | 128 | 17953 | 47.76 | 1482 | 1491 | 344.7 |
| C | 1 | 16 | 13657 | 35.29 | 1482 | 1491 | 344.7 |
| C | 13 | 61 | 12134 | 30.88 | 1482 | 1491 | 344.7 |
| D | 13 | 235 | 2878103 | 8610.99 | 1362 | 1322 | 334.1 |
| D | 12 | 22 | 2556845 | 7649.38 | 1362 | 1322 | 334.1 |
| D | 13 | 239 | 726126 | 2169.54 | 1362 | 1322 | 334.1 |
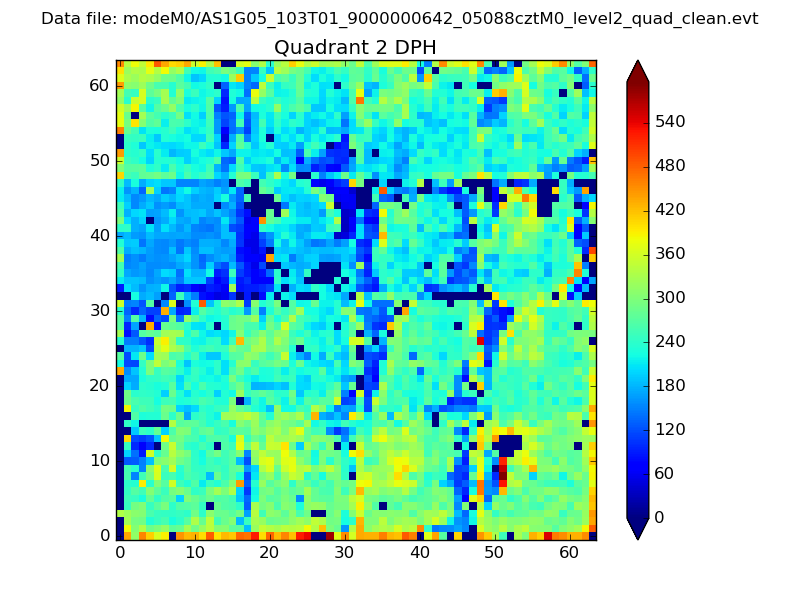
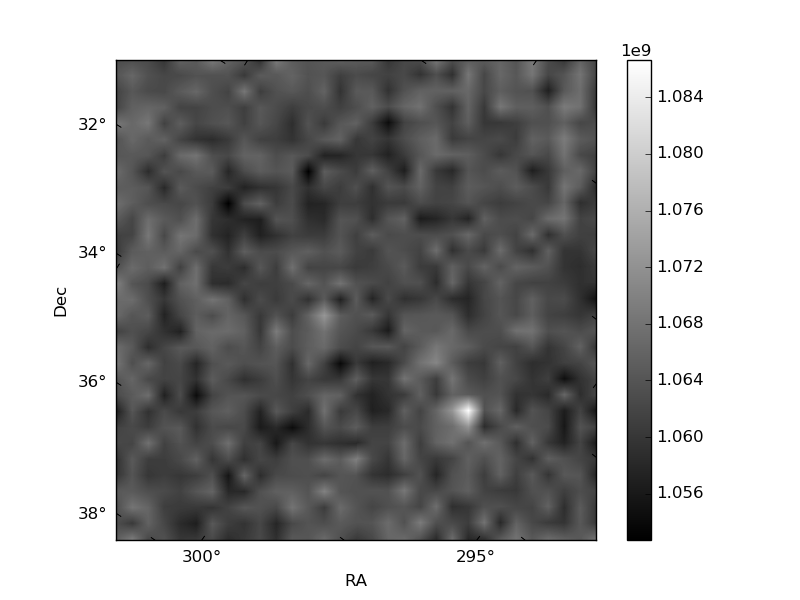
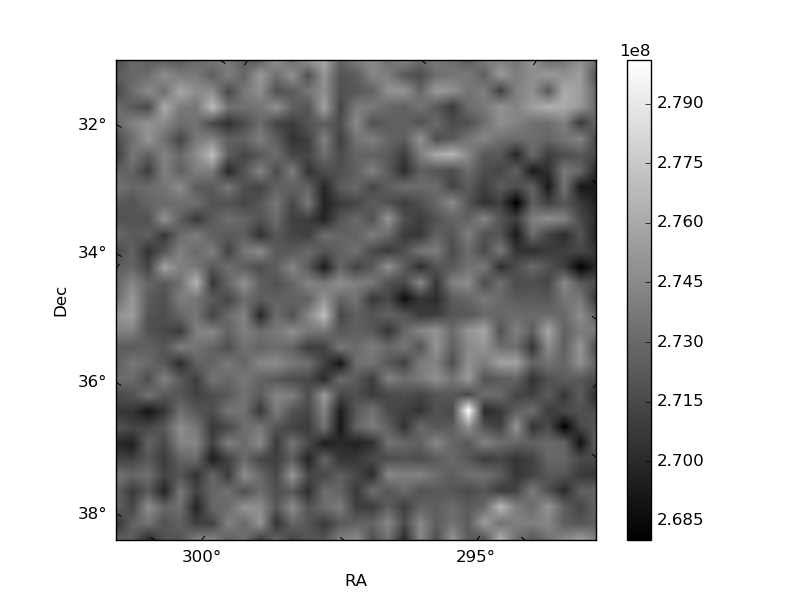
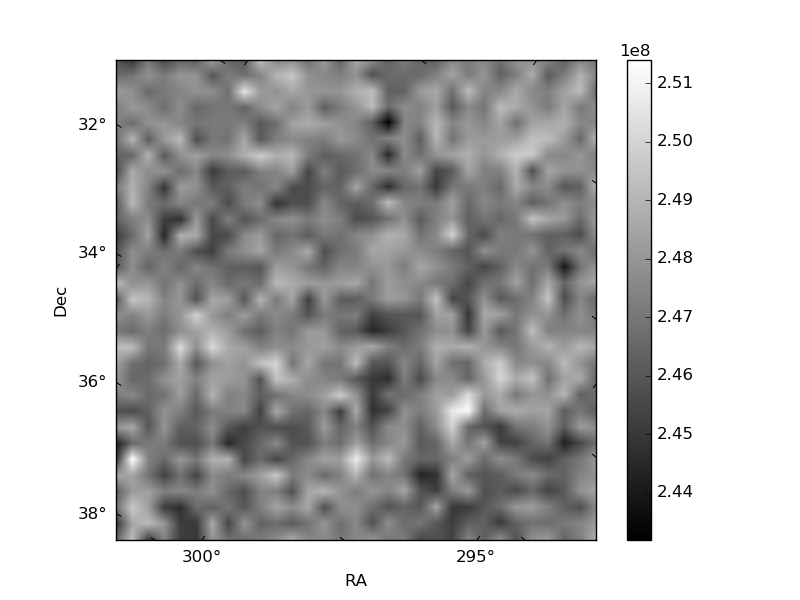
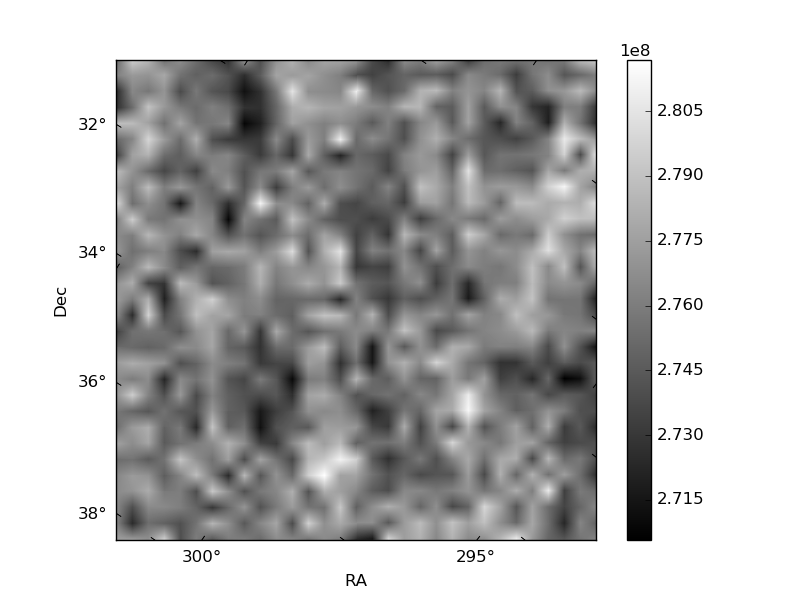
Histogram calculated using DETX and DETY for each event in the final _common_clean file
| Quadrant A | 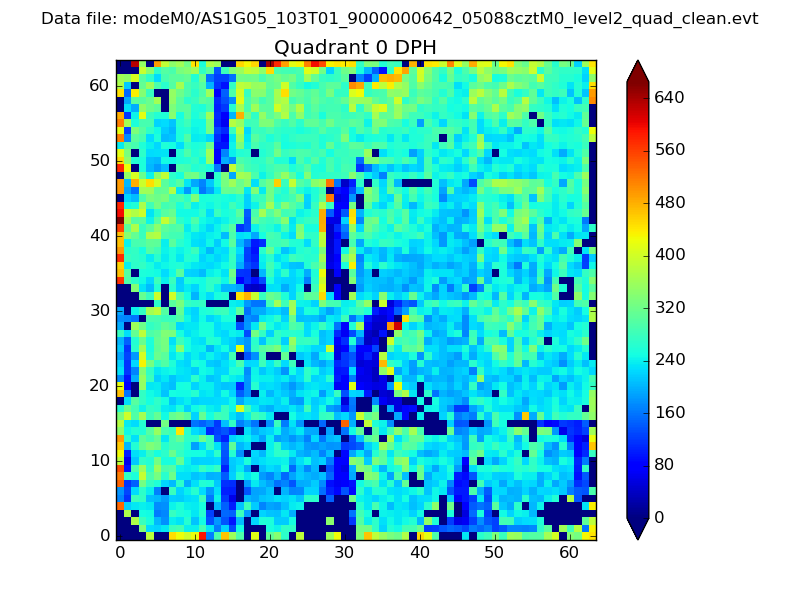 |
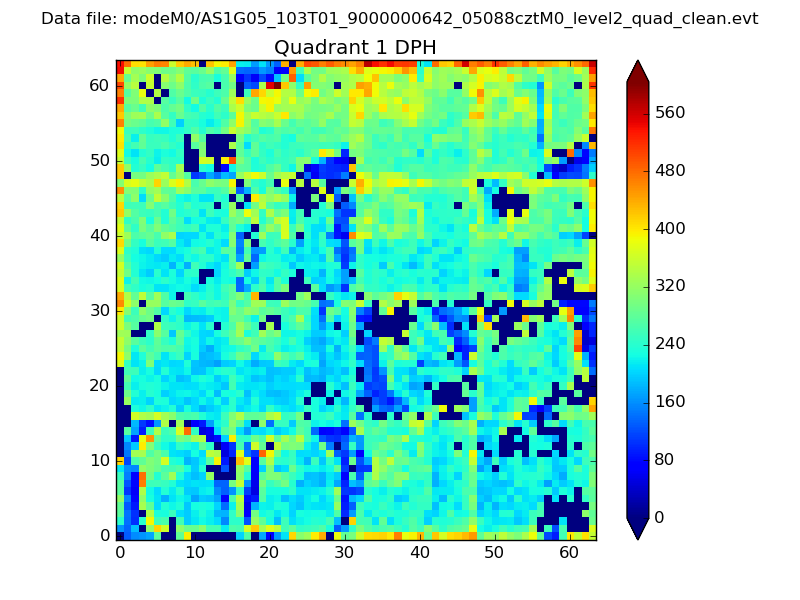 |
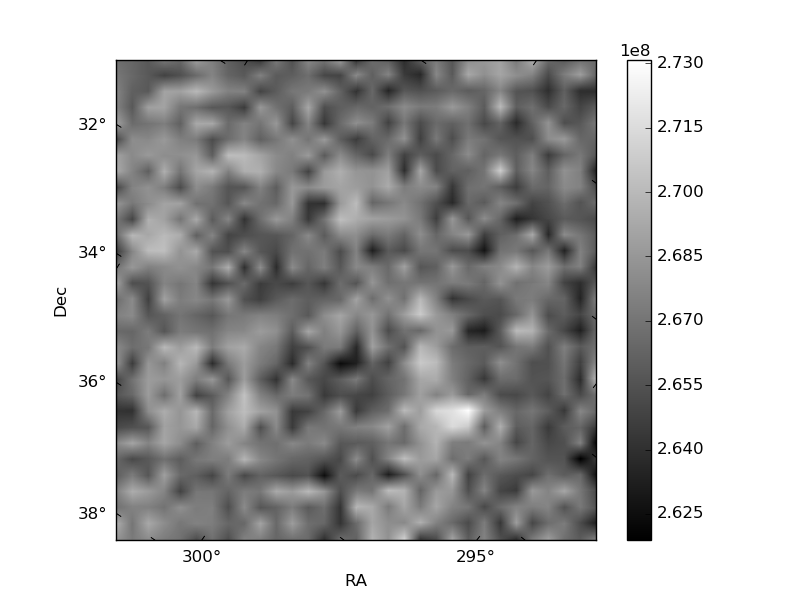
Quadrant B |
|---|---|---|---|
| Quadrant D | 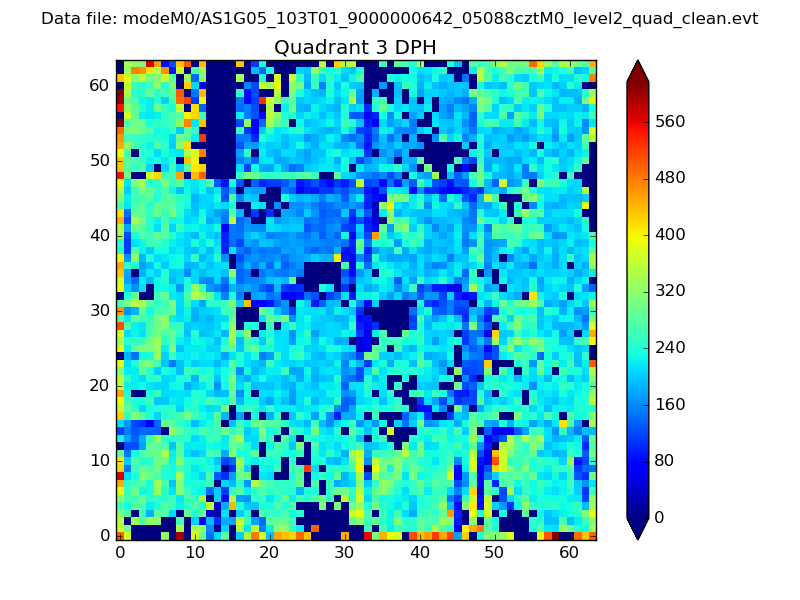 |
 |
Quadrant C |
| Plot type | Count rate plots | Images |
|---|---|---|
| Comparison with Poisson distribution Blue bars denote a histogram of data divided into 1 sec bins. Red curve is a Poisson curve with rate = median count rate of data. |
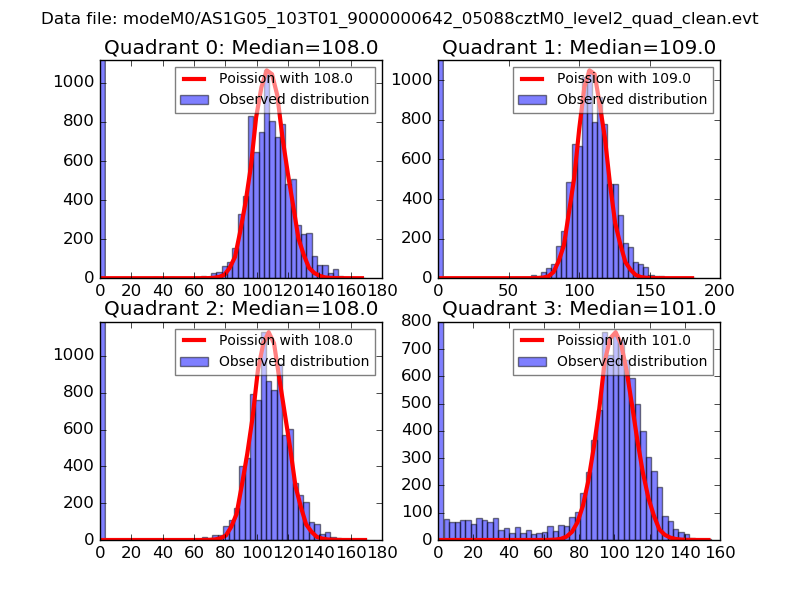 |
 |
| Quadrant-wise count rates Data is divided into 100 sec bins |
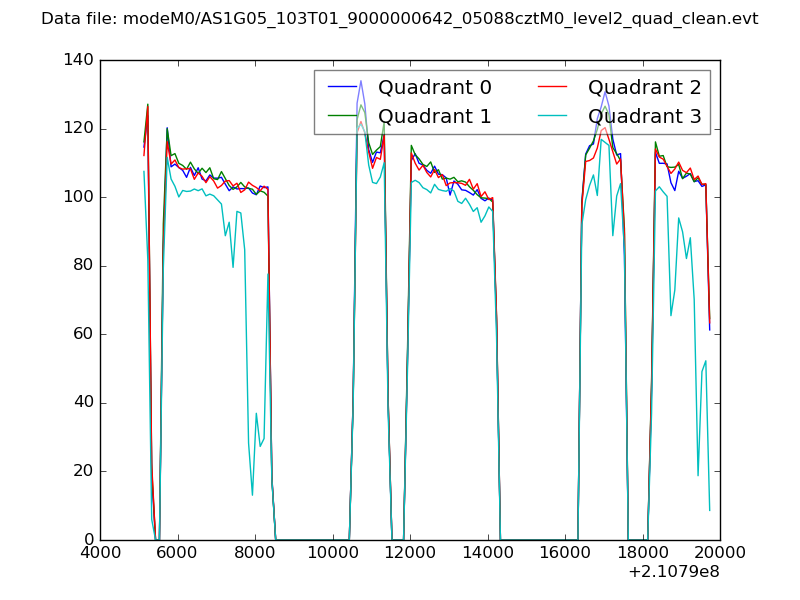 |
|
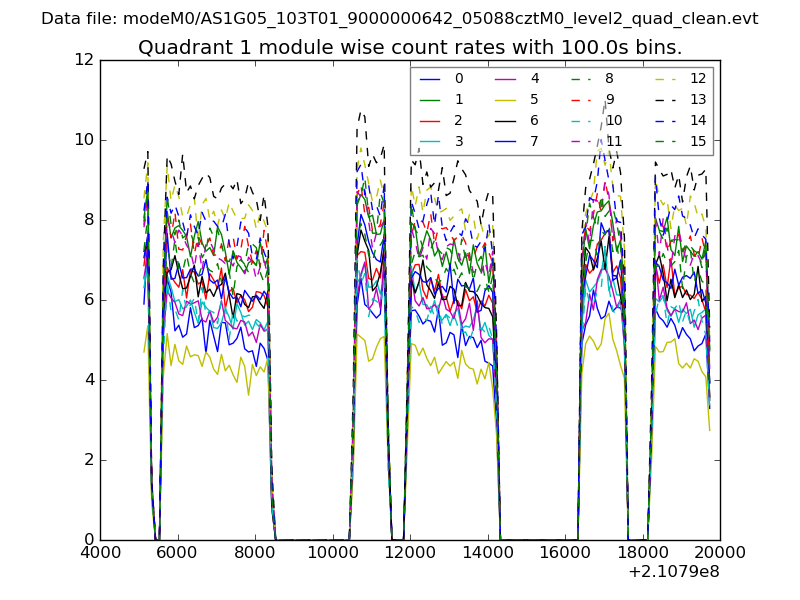
| Module-wise count rates for Quadrant A Data is divided into 100 sec bins |
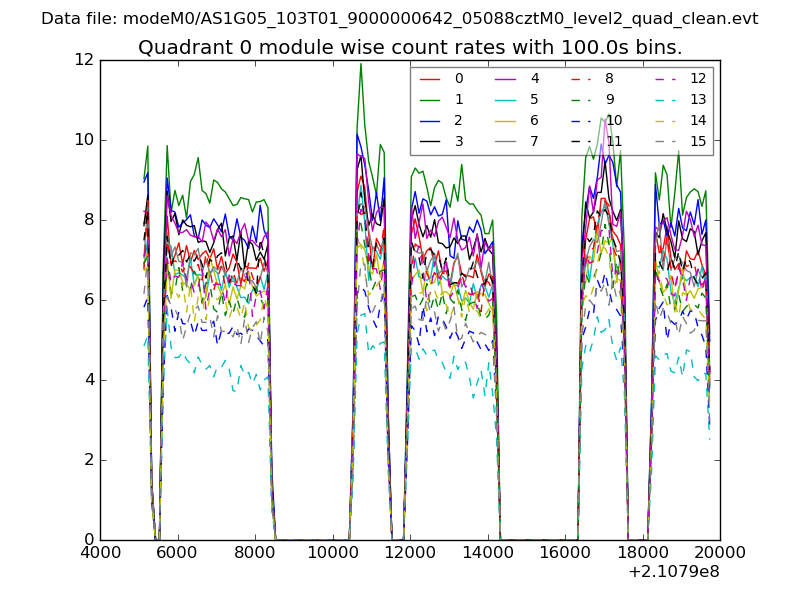 |
 |
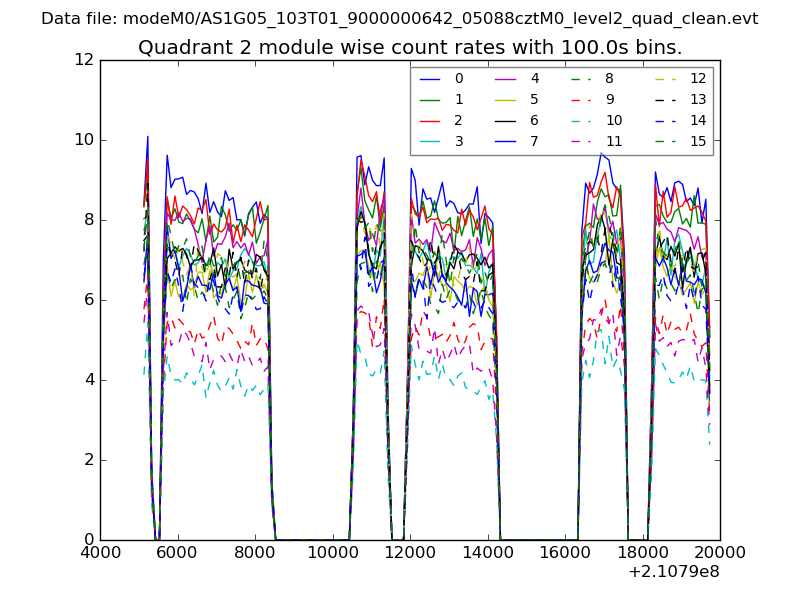
| Module-wise count rates for Quadrant B Data is divided into 100 sec bins |
 |
 |
| Module-wise count rates for Quadrant C Data is divided into 100 sec bins |
 |
 |
| Module-wise count rates for Quadrant D Data is divided into 100 sec bins |
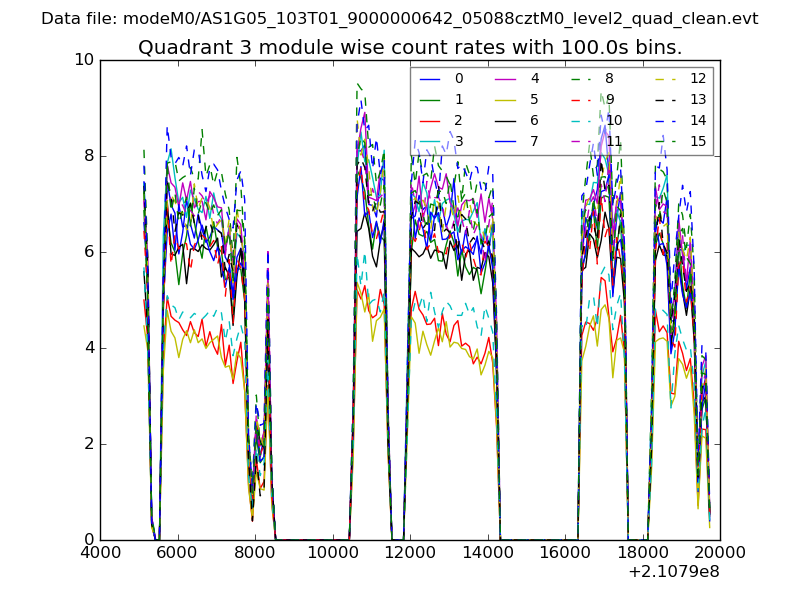 |
 |
| Parameter | Plot |
|---|---|
| CZT HV Monitor | 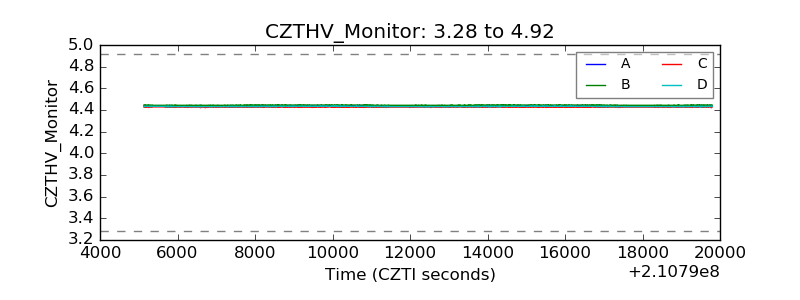 |
| D_VDD | 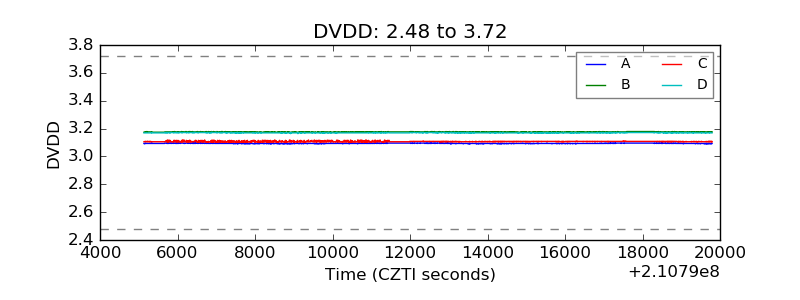 |
| Temperature 1 | 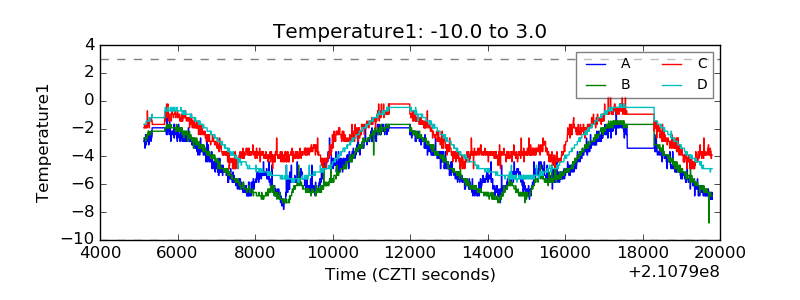 |
| Veto HV Monitor | 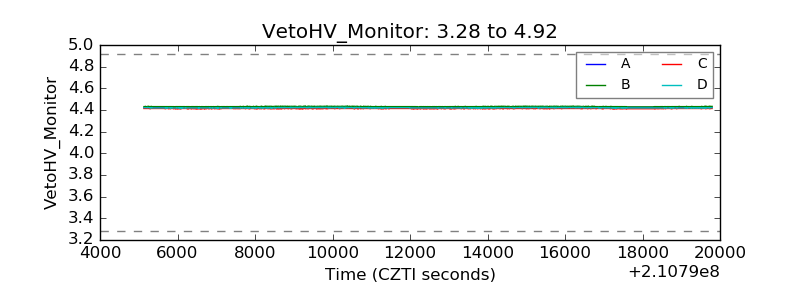 |
| Veto LLD | 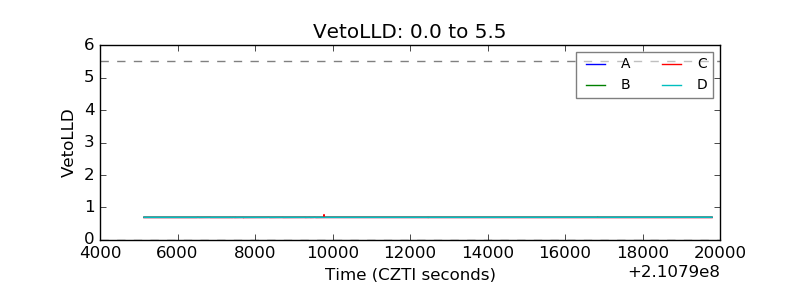 |
| Alpha Counter | 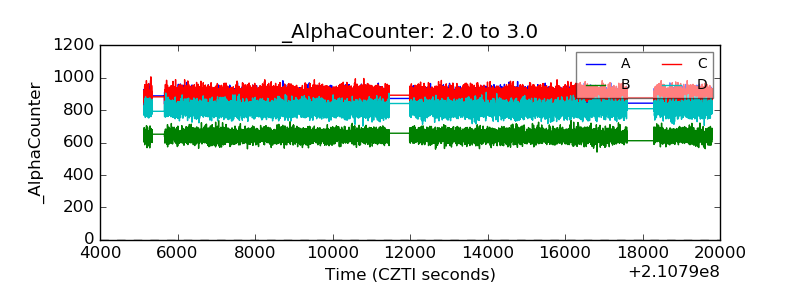 |
| _CPM_Rate |  |
| CZT Counter | 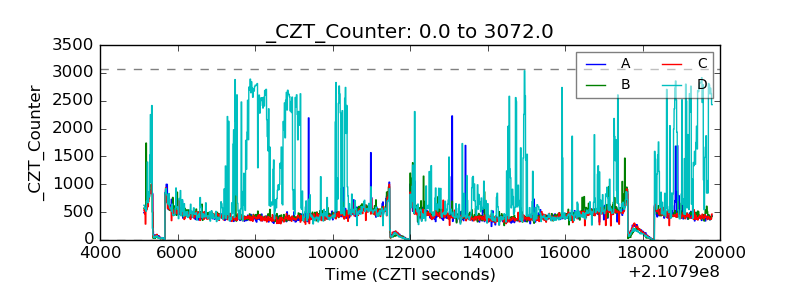 |
| +2.5 Volts monitor | 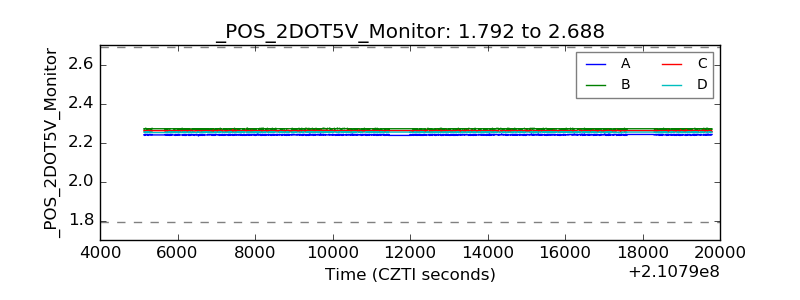 |
| +5 Volts monitor | 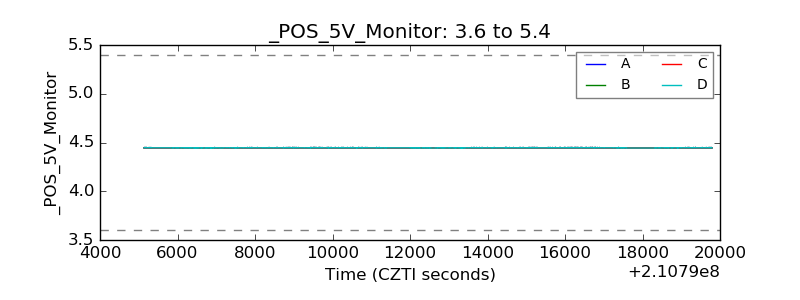 |
| _ROLL_ROT | 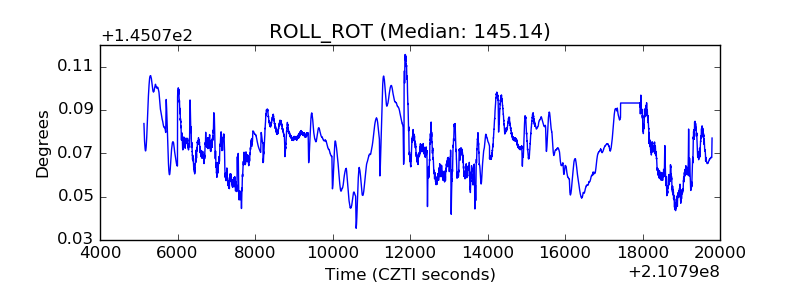 |
| _Roll_DEC | 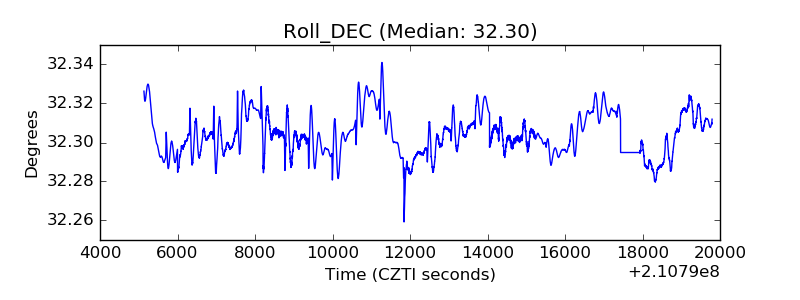 |
| _Roll_RA | 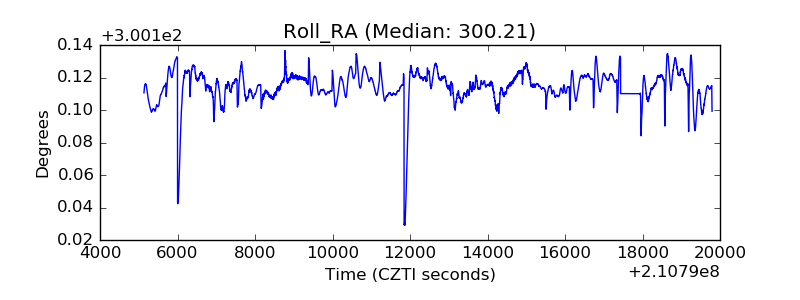 |
| Veto Counter | 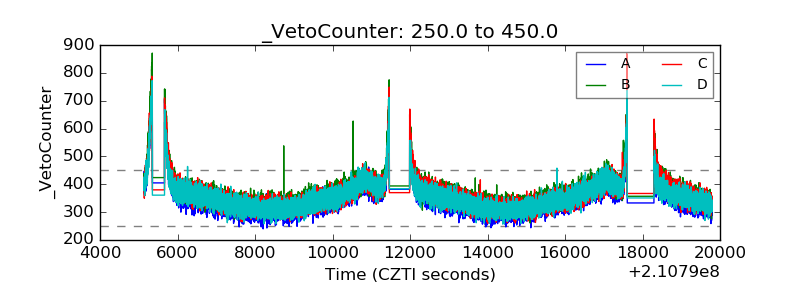 |