| Param | Original file | Final file |
|---|---|---|
| Filename | modeM0/AS1G05_103T01_9000000642_05089cztM0_level2.evt | modeM0/AS1G05_103T01_9000000642_05089cztM0_level2_quad_clean.evt |
| Size (bytes) | 631,915,200 | 78,917,760 |
| Size | 602.6 MB | 75.3 MB |
| Events in quadrant A | 3,102,747 | 512,337 |
| Events in quadrant B | 3,220,187 | 519,815 |
| Events in quadrant C | 3,009,986 | 515,242 |
| Events in quadrant D | 9,335,798 | 359,825 |
| Mode SS | |||
|---|---|---|---|
| Quadrant | BADHDUFLAG | Total packets | Discarded packets |
| A | 0 | 140 | 0 |
| B | 0 | 140 | 0 |
| C | 0 | 140 | 0 |
| D | 0 | 140 | 0 |
| Mode M0 | |||
|---|---|---|---|
| Quadrant | BADHDUFLAG | Total packets | Discarded packets |
| A | 0 | 14251 | 3 |
| B | 0 | 14284 | 2 |
| C | 0 | 13963 | 2 |
| D | 0 | 32514 | 2 |
| Mode M9 | |||
|---|---|---|---|
| Quadrant | BADHDUFLAG | Total packets | Discarded packets |
| A | 0 | 11 | 0 |
| B | 0 | 11 | 0 |
| C | 0 | 11 | 0 |
| D | 0 | 12 | 0 |
| Quadrant | Total seconds | Saturated seconds | Saturation percentage |
|---|---|---|---|
| A | 6914 | 39 | 0.564073% |
| B | 6914 | 22 | 0.318195% |
| C | 6914 | 12 | 0.173561% |
| D | 6914 | 2359 | 34.119178% |
Noise dominated data is calculated using 1-second bins in cleaned event files. If a bin has >2000 counts, and if more than 50% of those come from <1% of pixels, then it is considered to be noise-dominated and hence unusable.
| Quadrant | # 1 sec bins | Bins with >0 counts | Bins with >2000 counts | High rate bins dominated by noise | Noise dominated (total time) | Noise dominated (detector-on time) | Marked lightcurve |
|---|---|---|---|---|---|---|---|
| A | 7779 | 6915 | 9 | 9 | 0.12% | 0.13% | 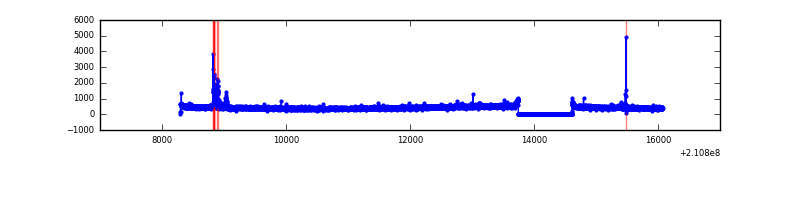 |
| B | 7779 | 6914 | 2 | 2 | 0.03% | 0.03% | 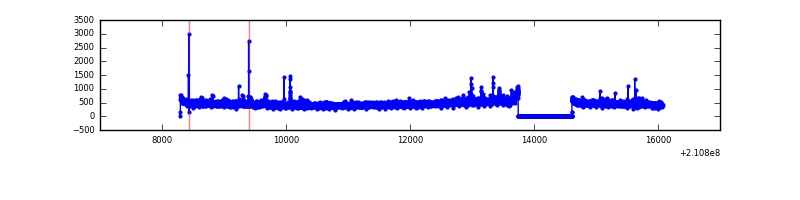 |
| C | 7779 | 6914 | 0 | 0 | 0.00% | 0.00% | 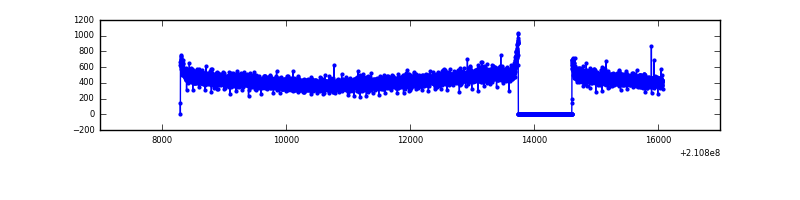 |
| D | 7779 | 6914 | 1958 | 1958 | 25.17% | 28.32% | 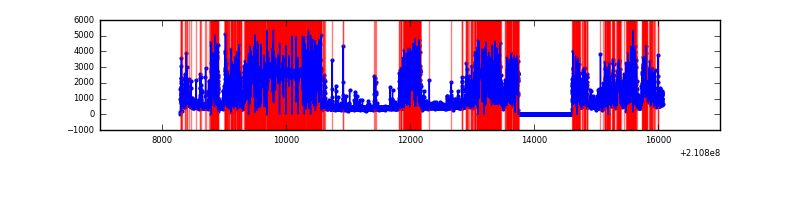 |
Top three noisy pixels from each quadrant. If the there are fewer than three noisy pixels in the level2.evt file, extra rows are filled as -1
| Pixel properties | Quadrant properties | ||||||
|---|---|---|---|---|---|---|---|
| Quadrant | DetID | PixID | Counts | Sigma | Mean | Median | Sigma |
| A | 15 | 174 | 77962 | 481.13 | 781 | 762 | 160.5 |
| A | 0 | 50 | 19187 | 114.83 | 781 | 762 | 160.5 |
| A | 12 | 194 | 7815 | 43.96 | 781 | 762 | 160.5 |
| B | 0 | 219 | 49180 | 315.74 | 793 | 775 | 153.3 |
| B | 15 | 204 | 48738 | 312.85 | 793 | 775 | 153.3 |
| B | 0 | 231 | 24112 | 152.22 | 793 | 775 | 153.3 |
| C | 8 | 128 | 6326 | 31.03 | 768 | 774 | 178.9 |
| C | 13 | 61 | 6150 | 30.05 | 768 | 774 | 178.9 |
| C | 8 | 112 | 3080 | 12.89 | 768 | 774 | 178.9 |
| D | 12 | 22 | 5091240 | 34464.41 | 602 | 584 | 147.7 |
| D | 13 | 235 | 717067 | 4850.68 | 602 | 584 | 147.7 |
| D | 13 | 239 | 555648 | 3757.86 | 602 | 584 | 147.7 |
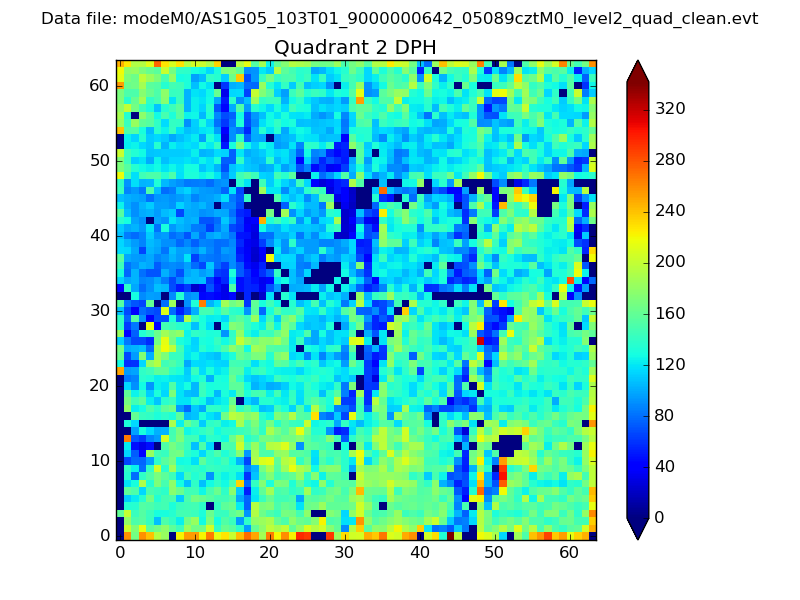
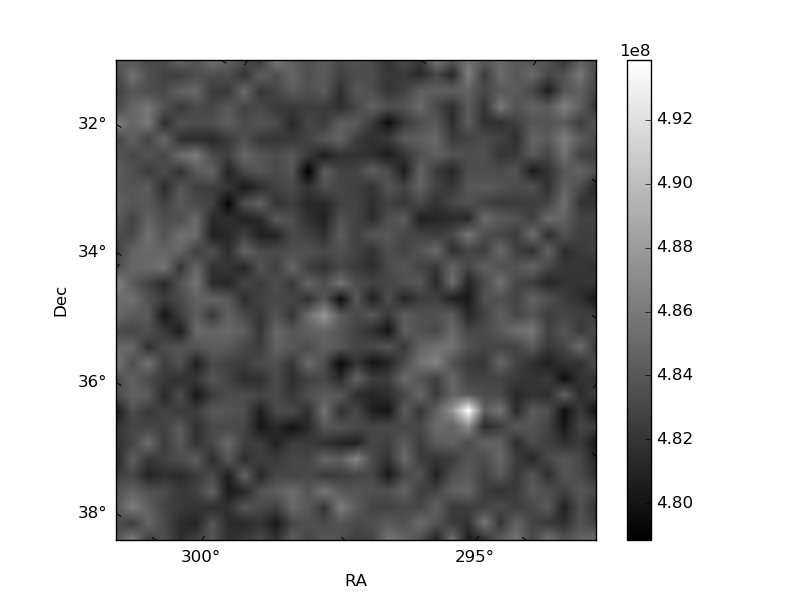
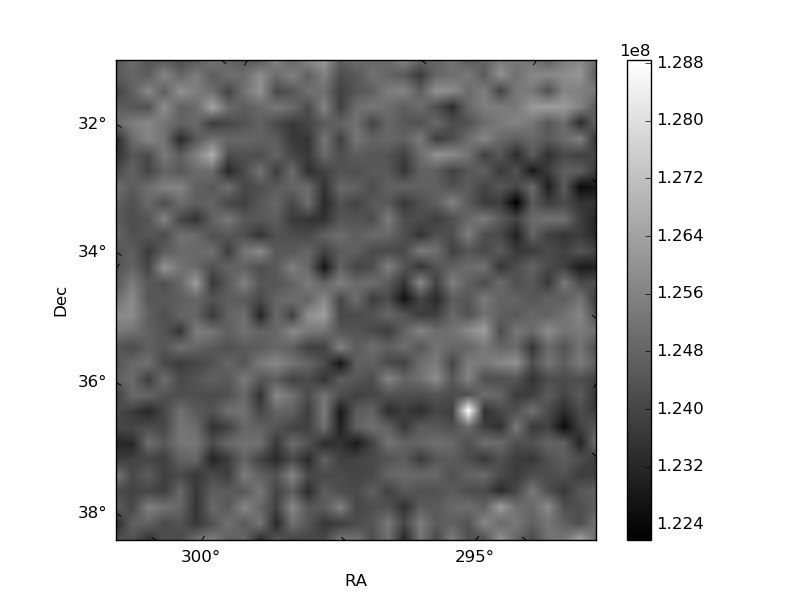
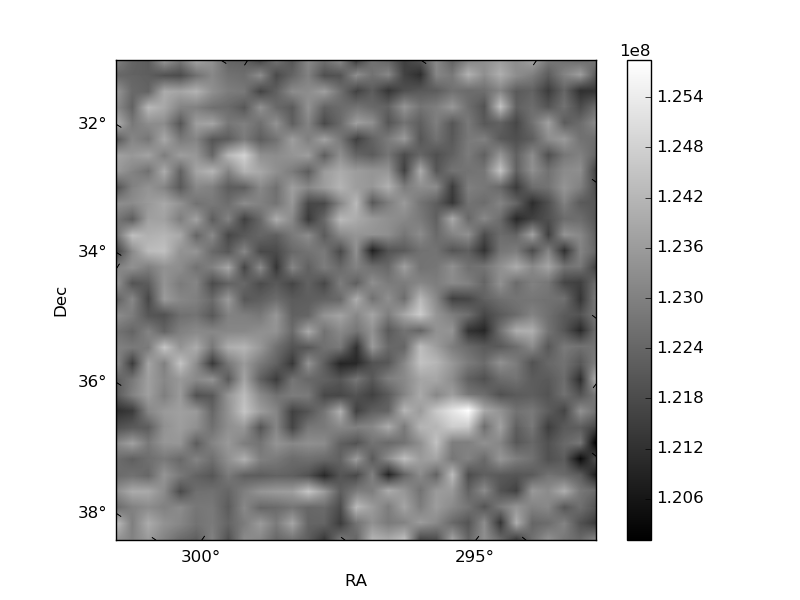
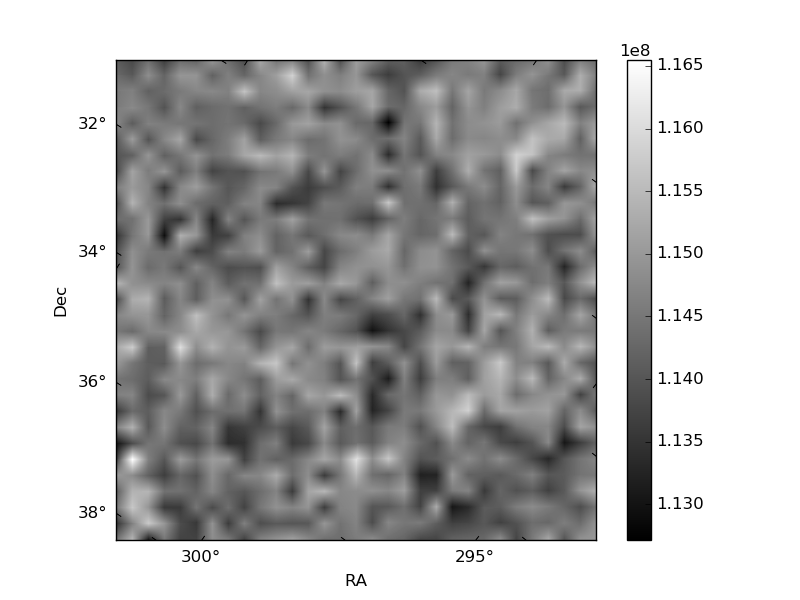
Histogram calculated using DETX and DETY for each event in the final _common_clean file
| Quadrant A | 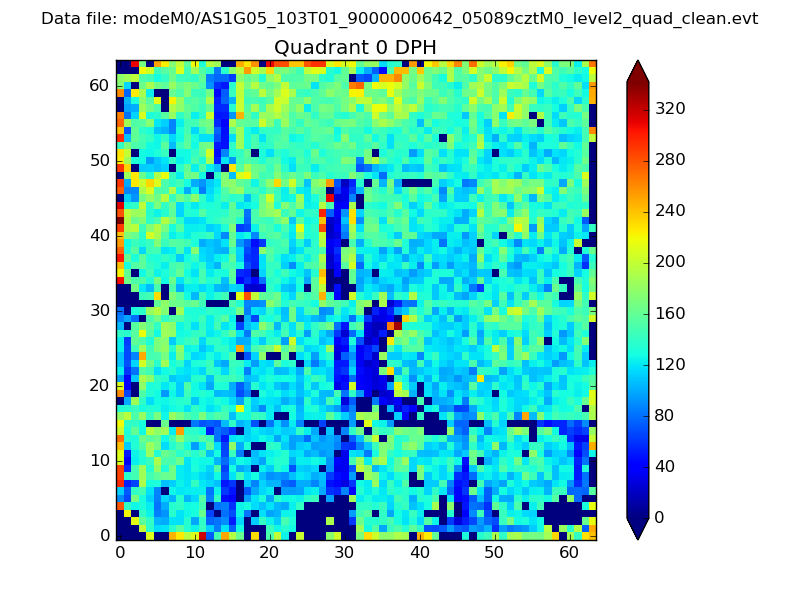 |
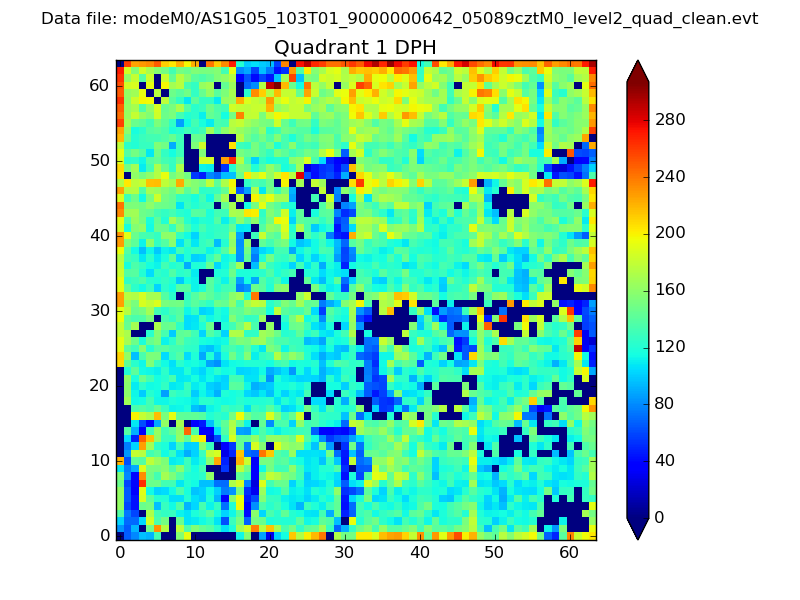 |
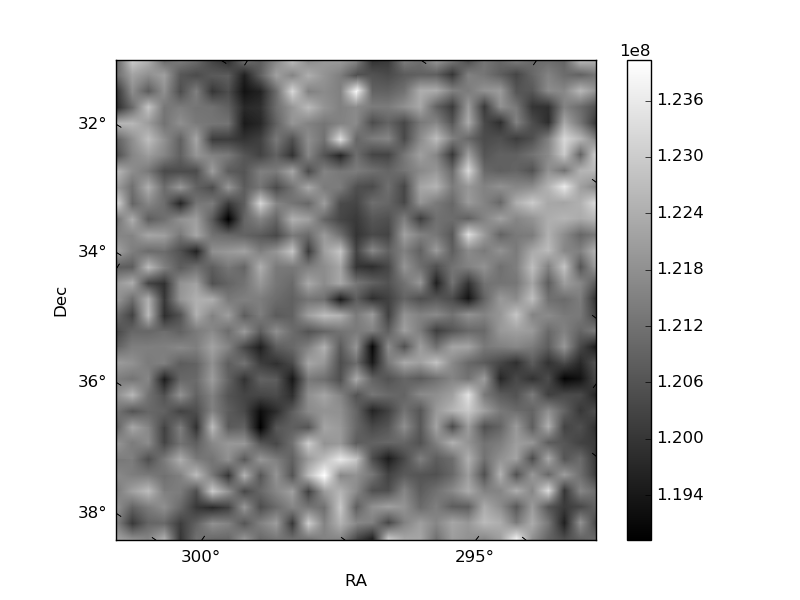
Quadrant B |
|---|---|---|---|
| Quadrant D | 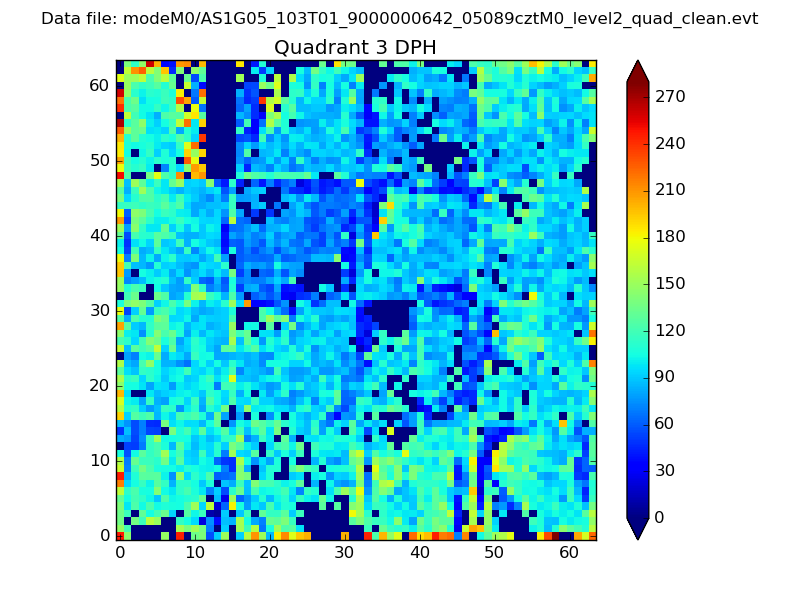 |
 |
Quadrant C |
| Plot type | Count rate plots | Images |
|---|---|---|
| Comparison with Poisson distribution Blue bars denote a histogram of data divided into 1 sec bins. Red curve is a Poisson curve with rate = median count rate of data. |
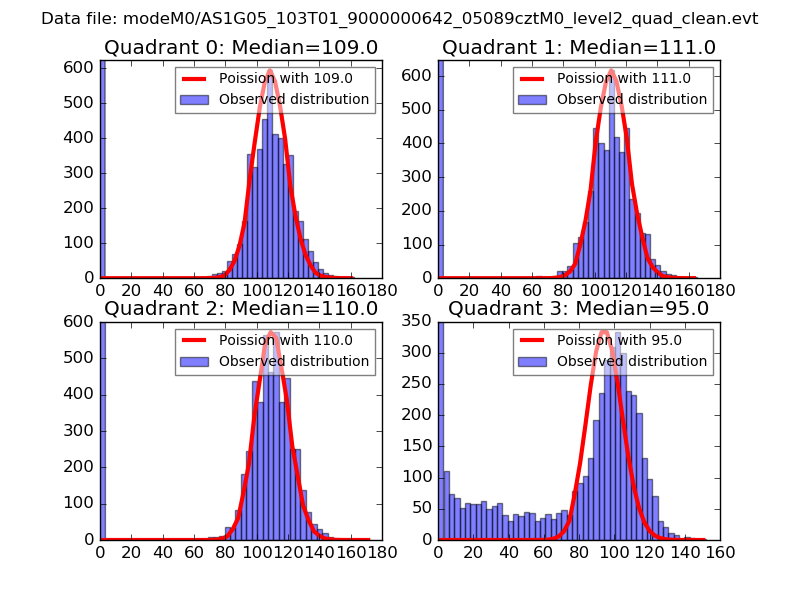 |
 |
| Quadrant-wise count rates Data is divided into 100 sec bins |
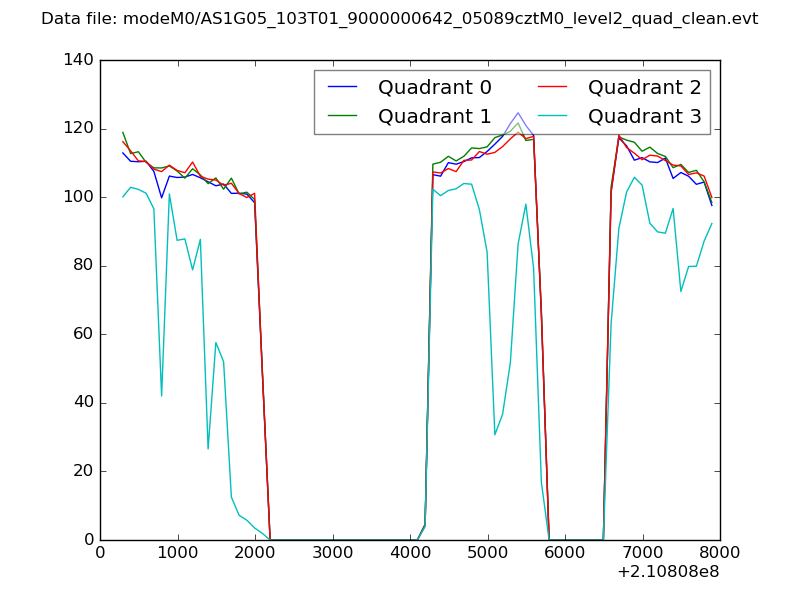 |
|
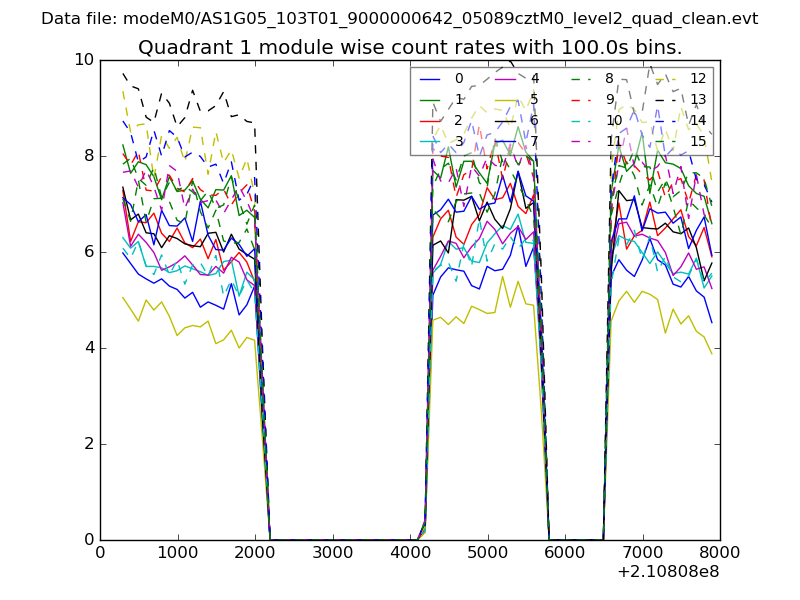
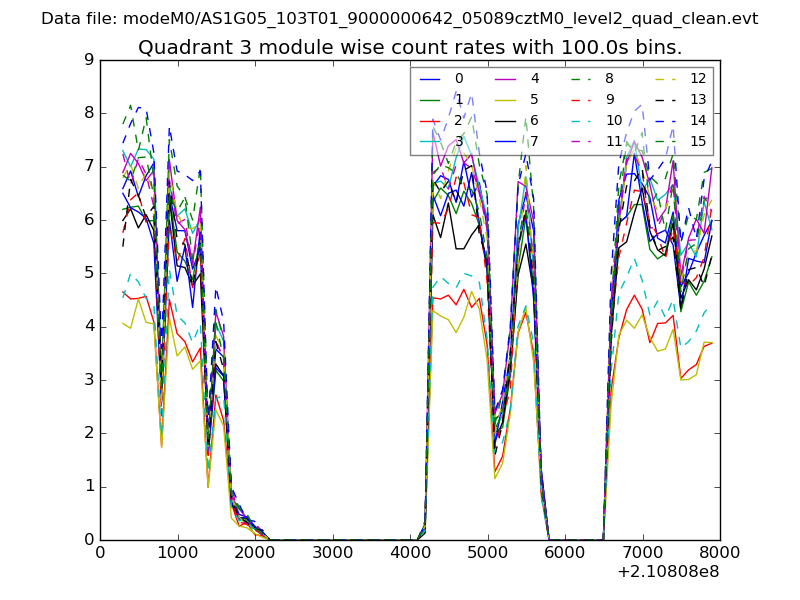
| Module-wise count rates for Quadrant A Data is divided into 100 sec bins |
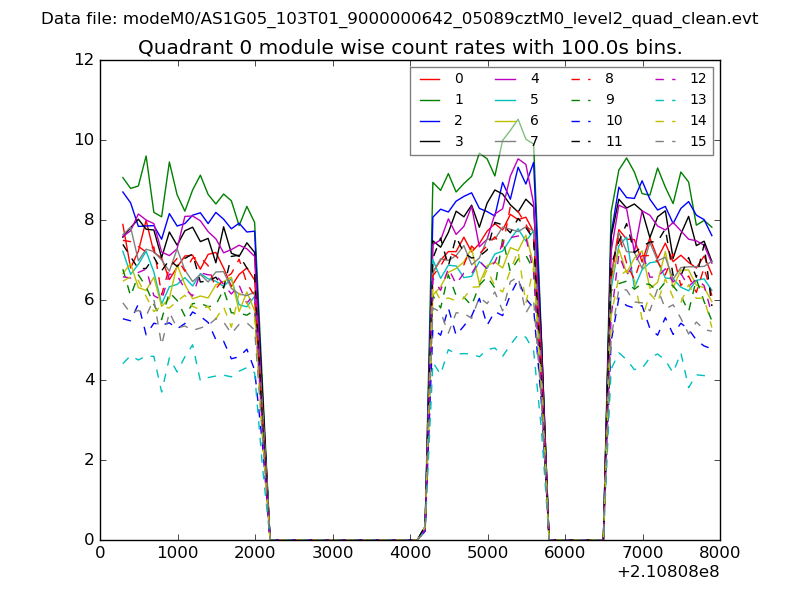 |
 |
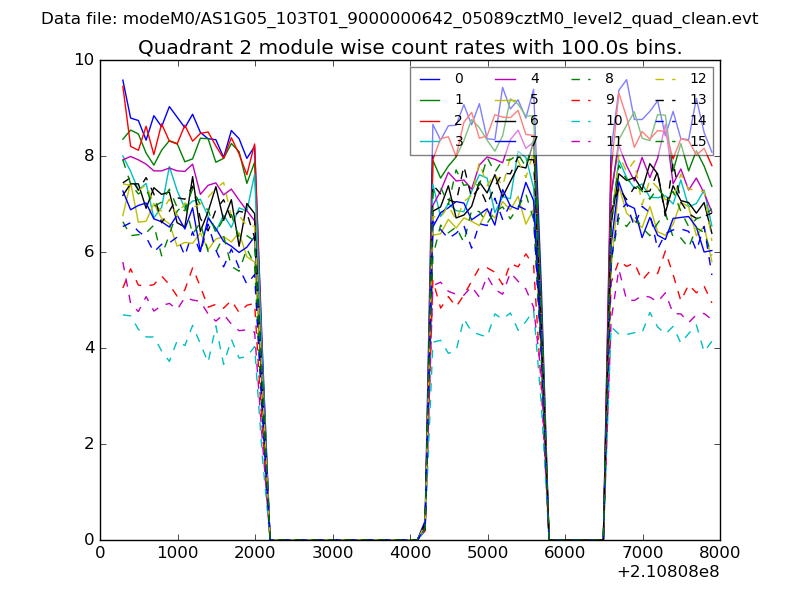
| Module-wise count rates for Quadrant B Data is divided into 100 sec bins |
 |
 |
| Module-wise count rates for Quadrant C Data is divided into 100 sec bins |
 |
 |
| Module-wise count rates for Quadrant D Data is divided into 100 sec bins |
 |
 |
| Parameter | Plot |
|---|---|
| CZT HV Monitor | 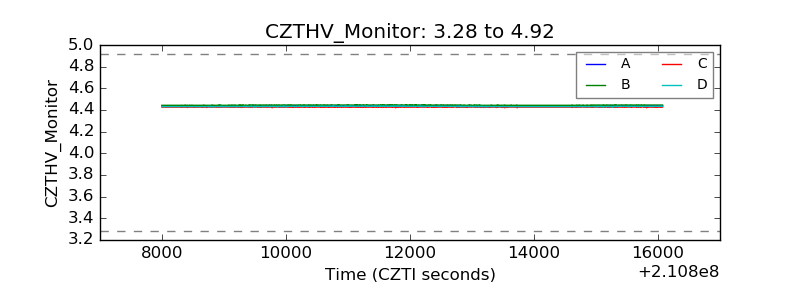 |
| D_VDD | 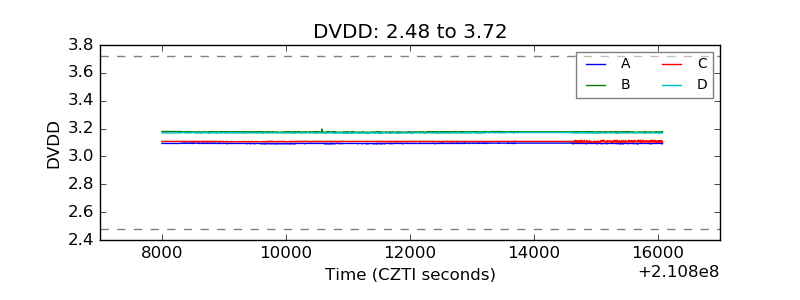 |
| Temperature 1 | 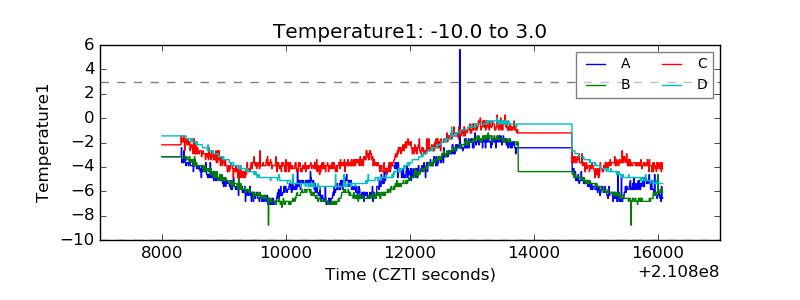 |
| Veto HV Monitor | 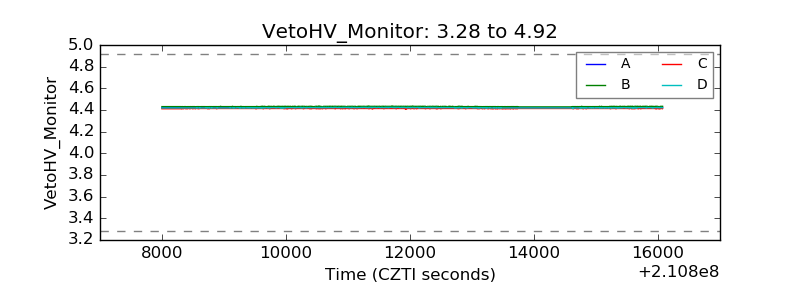 |
| Veto LLD | 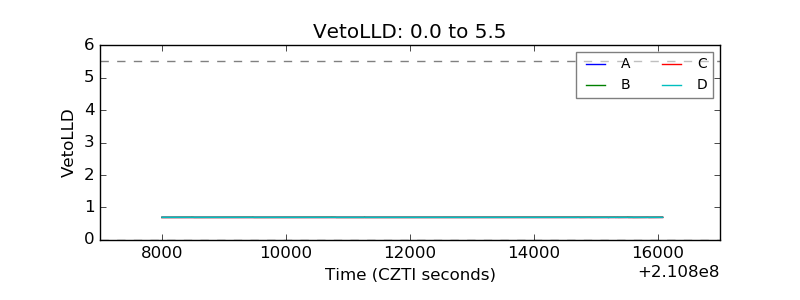 |
| Alpha Counter | 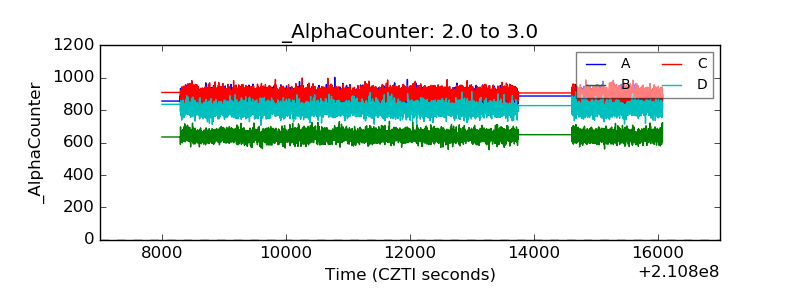 |
| _CPM_Rate | 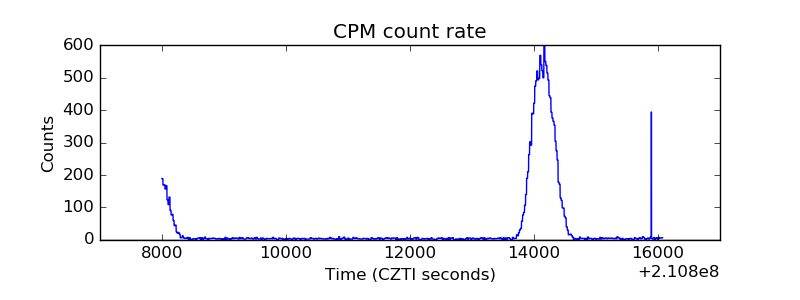 |
| CZT Counter | 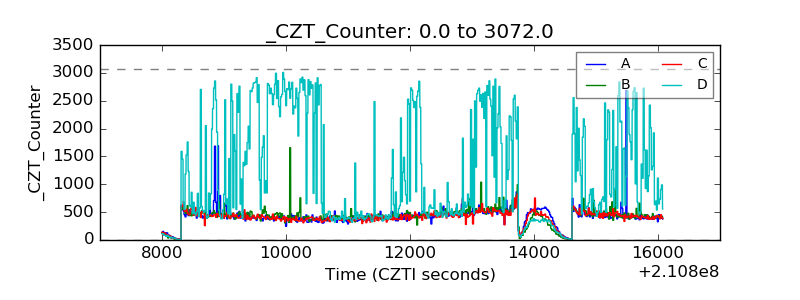 |
| +2.5 Volts monitor | 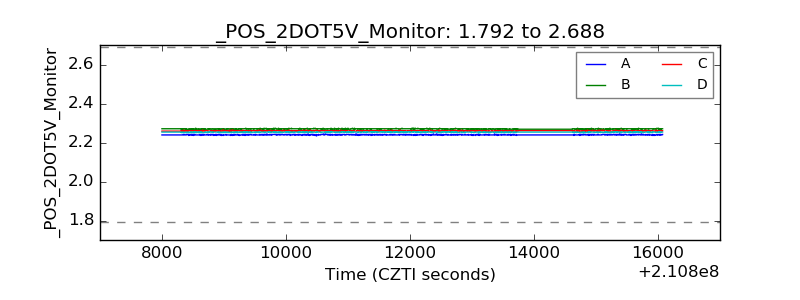 |
| +5 Volts monitor | 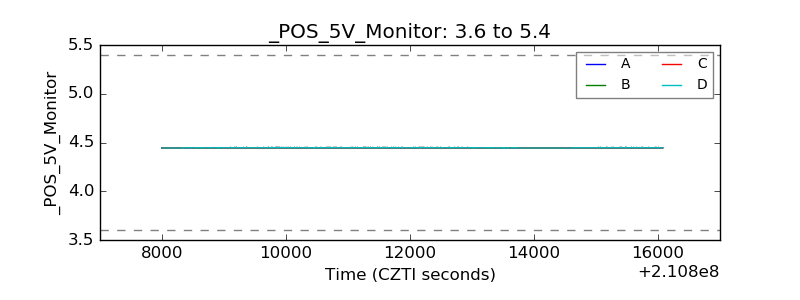 |
| _ROLL_ROT | 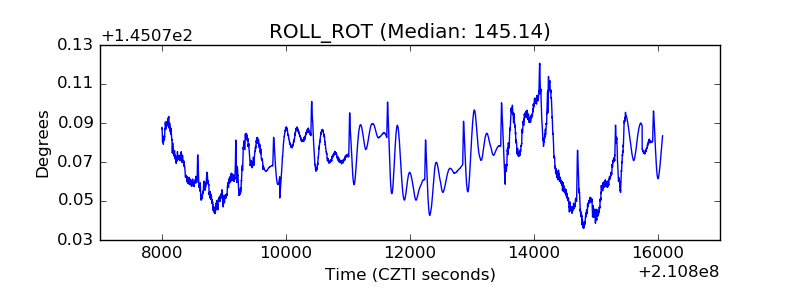 |
| _Roll_DEC | 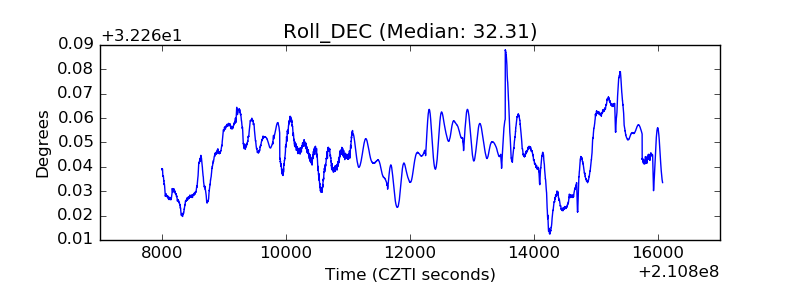 |
| _Roll_RA | 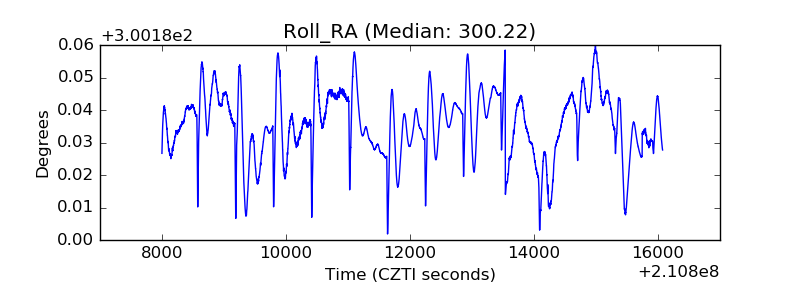 |
| Veto Counter | 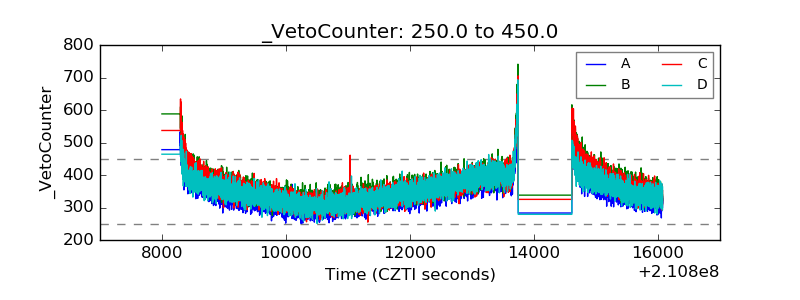 |