| Param | Original file | Final file |
|---|---|---|
| Filename | modeM0/AS1G05_103T01_9000000642_05090cztM0_level2.evt | modeM0/AS1G05_103T01_9000000642_05090cztM0_level2_quad_clean.evt |
| Size (bytes) | 446,411,520 | 55,558,080 |
| Size | 425.7 MB | 53.0 MB |
| Events in quadrant A | 2,304,380 | 348,070 |
| Events in quadrant B | 2,729,327 | 349,410 |
| Events in quadrant C | 2,294,814 | 346,158 |
| Events in quadrant D | 5,833,717 | 269,769 |
| Mode SS | |||
|---|---|---|---|
| Quadrant | BADHDUFLAG | Total packets | Discarded packets |
| A | 0 | 106 | 0 |
| B | 0 | 106 | 0 |
| C | 0 | 106 | 0 |
| D | 0 | 106 | 0 |
| Mode M0 | |||
|---|---|---|---|
| Quadrant | BADHDUFLAG | Total packets | Discarded packets |
| A | 0 | 10659 | 1 |
| B | 0 | 11784 | 1 |
| C | 0 | 10610 | 1 |
| D | 0 | 21000 | 1 |
| Mode M9 | |||
|---|---|---|---|
| Quadrant | BADHDUFLAG | Total packets | Discarded packets |
| A | 0 | 10 | 0 |
| B | 0 | 10 | 0 |
| C | 0 | 10 | 0 |
| D | 0 | 11 | 0 |
| Quadrant | Total seconds | Saturated seconds | Saturation percentage |
|---|---|---|---|
| A | 5260 | 14 | 0.266160% |
| B | 5260 | 49 | 0.931559% |
| C | 5260 | 6 | 0.114068% |
| D | 5260 | 1131 | 21.501901% |
Noise dominated data is calculated using 1-second bins in cleaned event files. If a bin has >2000 counts, and if more than 50% of those come from <1% of pixels, then it is considered to be noise-dominated and hence unusable.
| Quadrant | # 1 sec bins | Bins with >0 counts | Bins with >2000 counts | High rate bins dominated by noise | Noise dominated (total time) | Noise dominated (detector-on time) | Marked lightcurve |
|---|---|---|---|---|---|---|---|
| A | 5260 | 5260 | 2 | 2 | 0.04% | 0.04% | 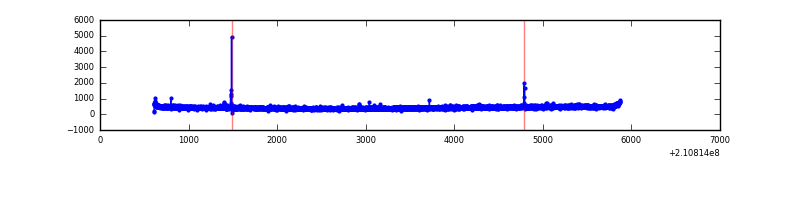 |
| B | 5260 | 5260 | 30 | 30 | 0.57% | 0.57% | 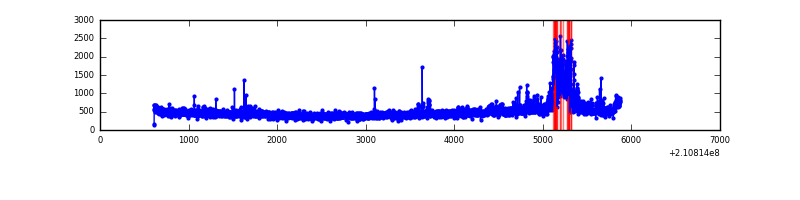 |
| C | 5260 | 5260 | 0 | 0 | 0.00% | 0.00% | 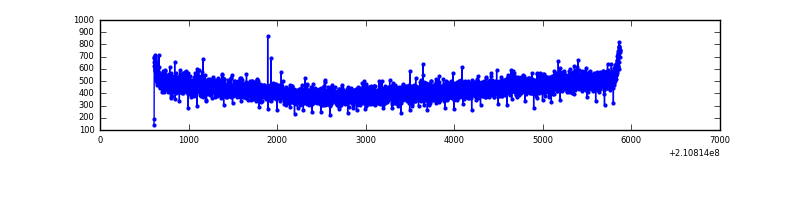 |
| D | 5260 | 5259 | 800 | 800 | 15.21% | 15.21% | 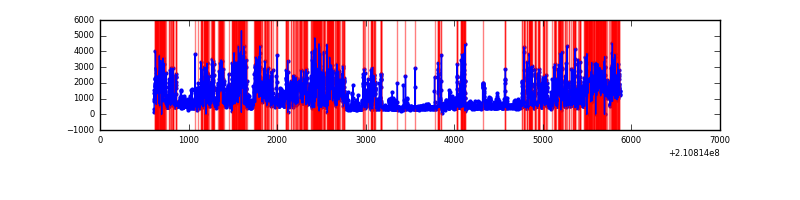 |
Top three noisy pixels from each quadrant. If the there are fewer than three noisy pixels in the level2.evt file, extra rows are filled as -1
| Pixel properties | Quadrant properties | ||||||
|---|---|---|---|---|---|---|---|
| Quadrant | DetID | PixID | Counts | Sigma | Mean | Median | Sigma |
| A | 0 | 50 | 21379 | 169.3 | 593 | 579 | 122.9 |
| A | 12 | 194 | 5995 | 44.08 | 593 | 579 | 122.9 |
| A | 0 | 226 | 5613 | 40.97 | 593 | 579 | 122.9 |
| B | 8 | 3 | 246075 | 2109.15 | 600 | 587 | 116.4 |
| B | 15 | 204 | 96845 | 827.02 | 600 | 587 | 116.4 |
| B | 0 | 219 | 23265 | 194.84 | 600 | 587 | 116.4 |
| C | 8 | 128 | 17538 | 126.3 | 579 | 583 | 134.2 |
| C | 8 | 112 | 7426 | 50.98 | 579 | 583 | 134.2 |
| C | 8 | 144 | 6617 | 44.95 | 579 | 583 | 134.2 |
| D | 13 | 235 | 1452734 | 11699.02 | 508 | 494 | 124.1 |
| D | 12 | 22 | 890391 | 7168.87 | 508 | 494 | 124.1 |
| D | 10 | 15 | 480644 | 3868.01 | 508 | 494 | 124.1 |
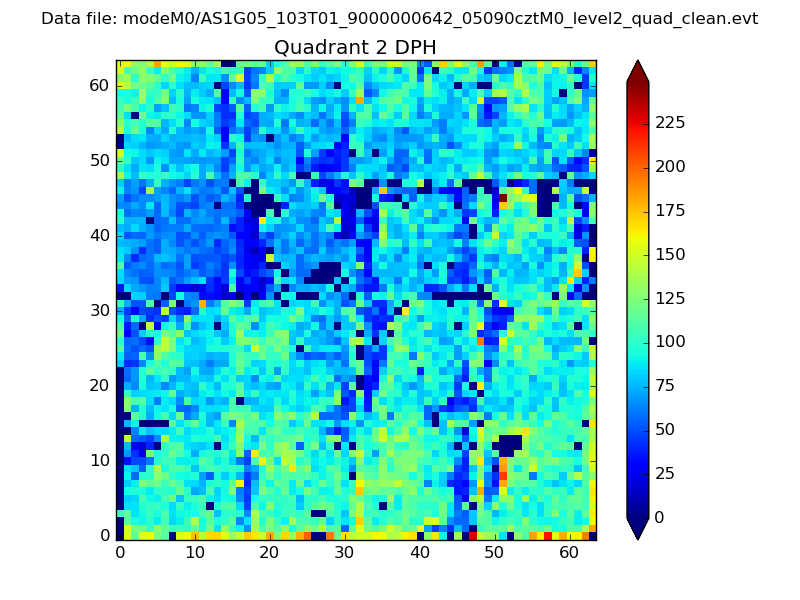
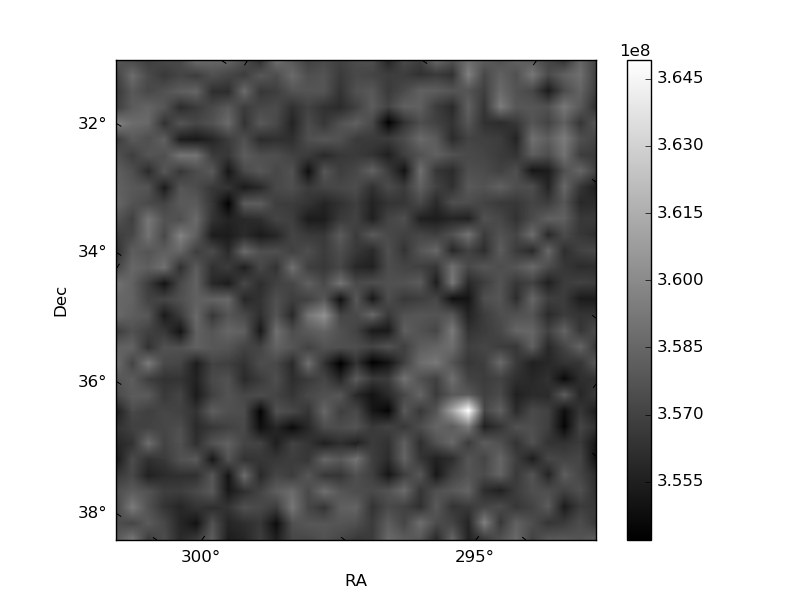
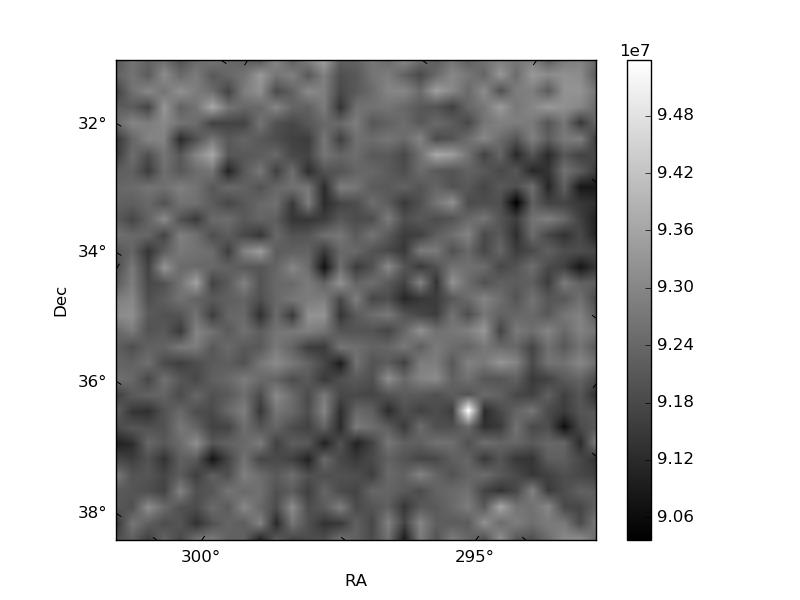
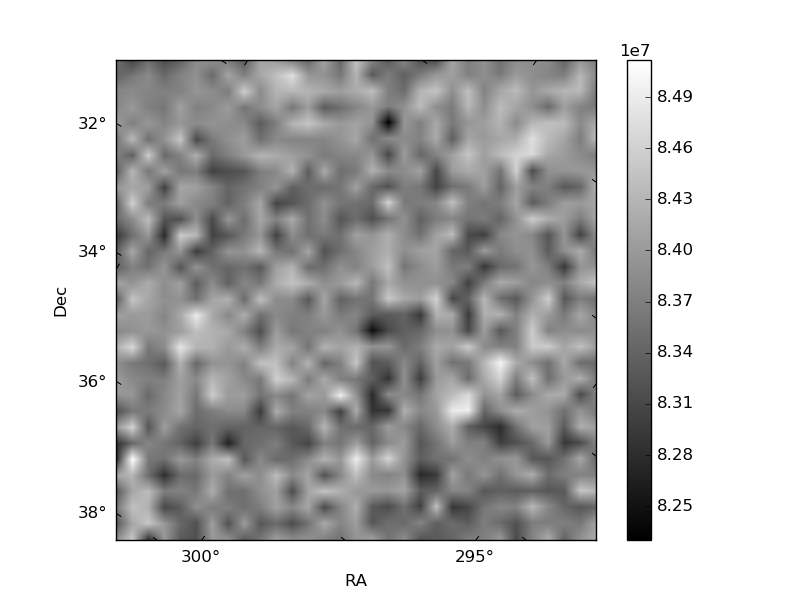
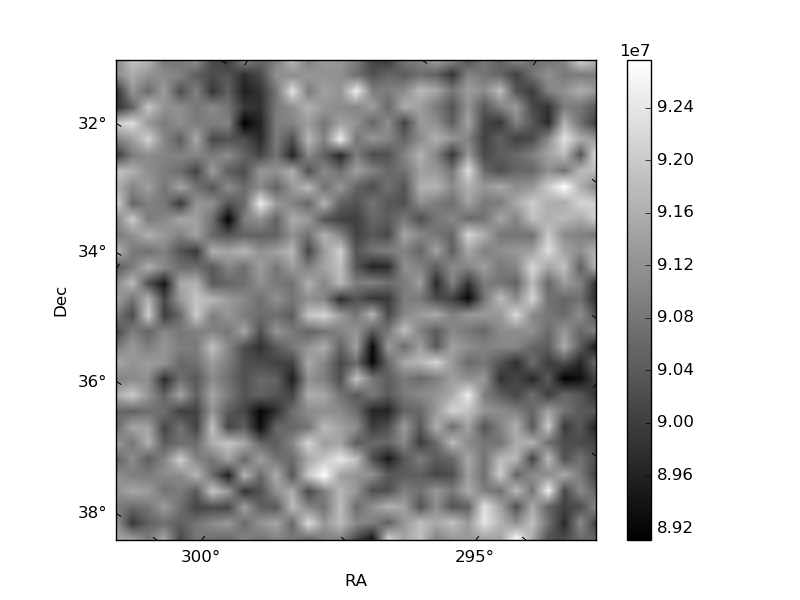
Histogram calculated using DETX and DETY for each event in the final _common_clean file
| Quadrant A | 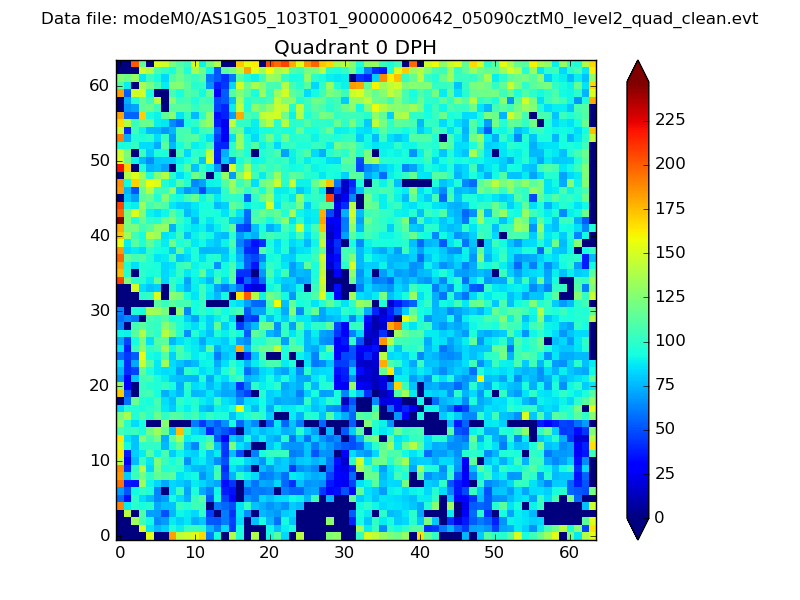 |
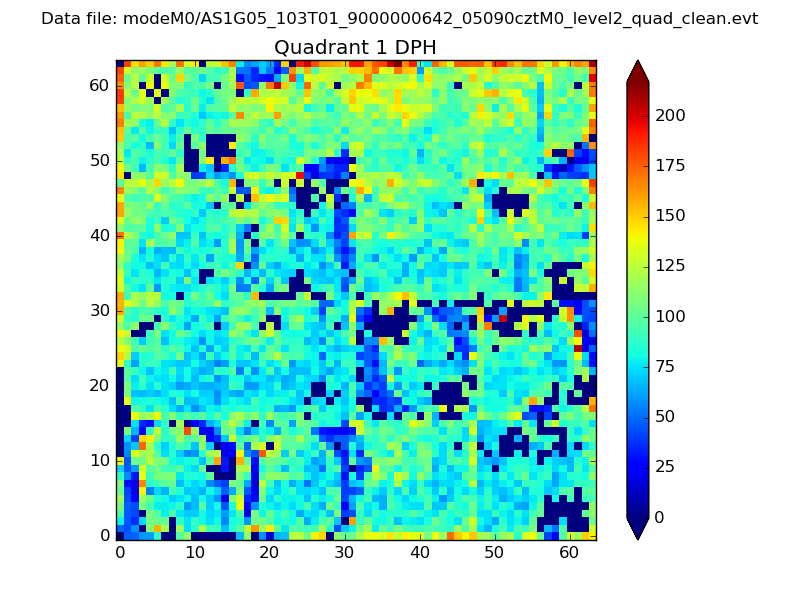 |
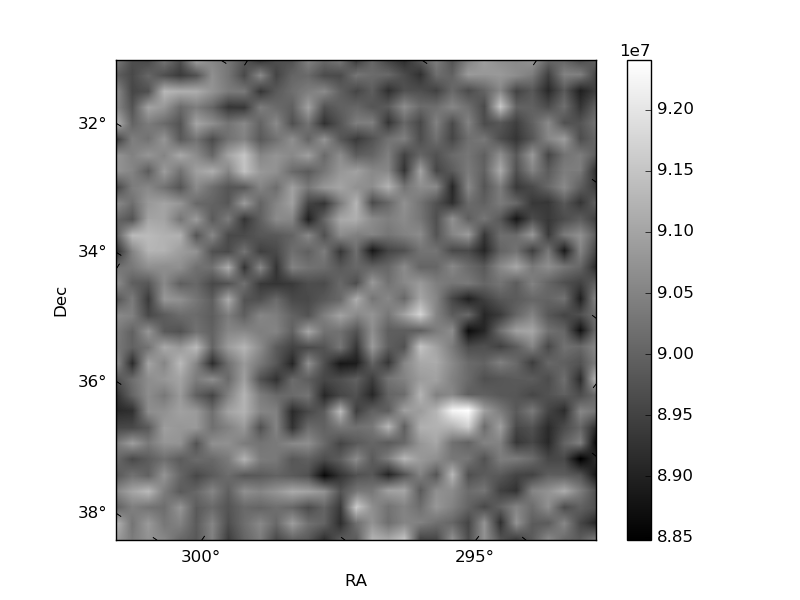
Quadrant B |
|---|---|---|---|
| Quadrant D | 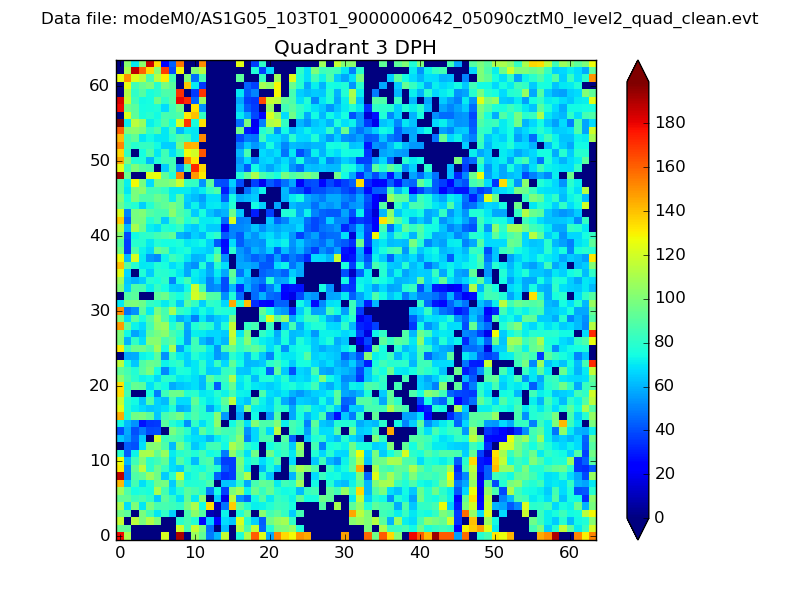 |
 |
Quadrant C |
| Plot type | Count rate plots | Images |
|---|---|---|
| Comparison with Poisson distribution Blue bars denote a histogram of data divided into 1 sec bins. Red curve is a Poisson curve with rate = median count rate of data. |
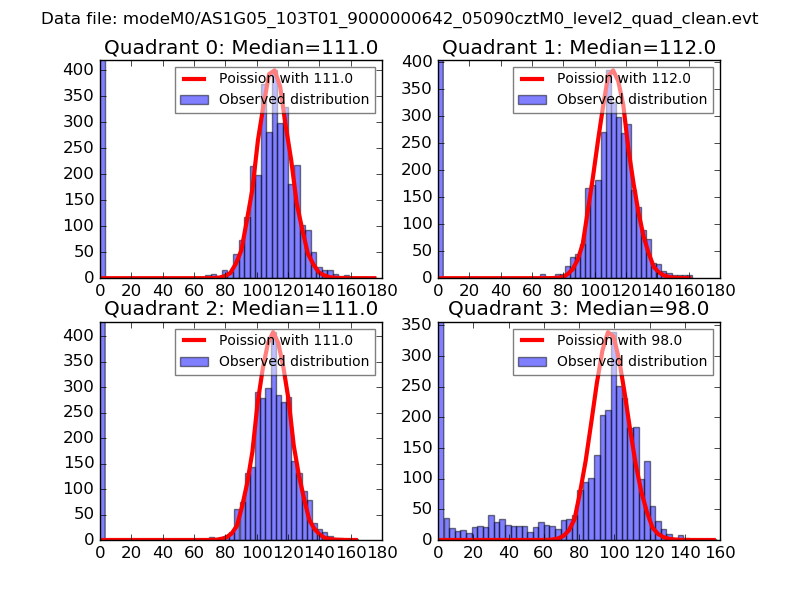 |
 |
| Quadrant-wise count rates Data is divided into 100 sec bins |
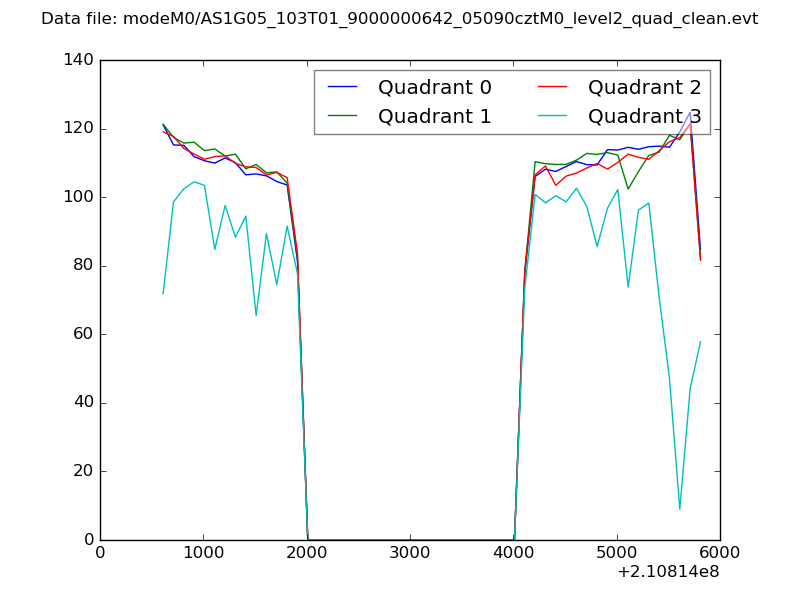 |
|
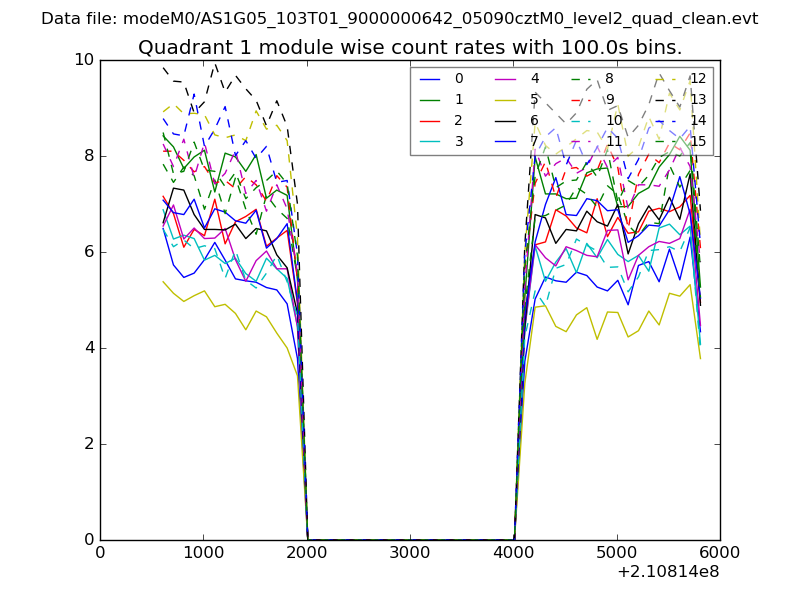
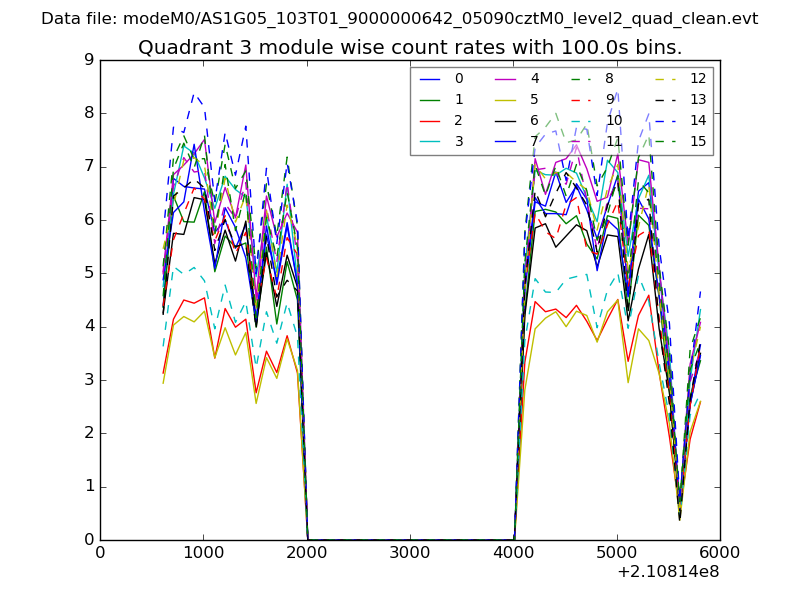
| Module-wise count rates for Quadrant A Data is divided into 100 sec bins |
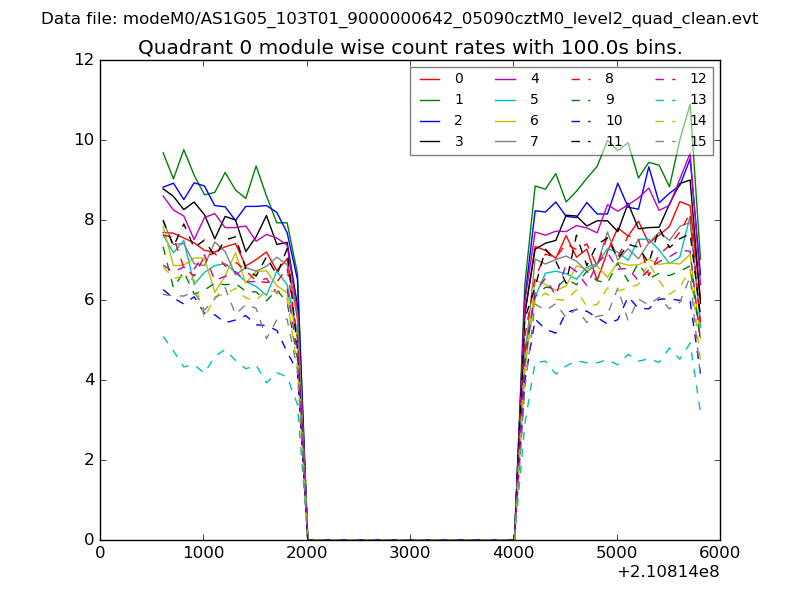 |
 |
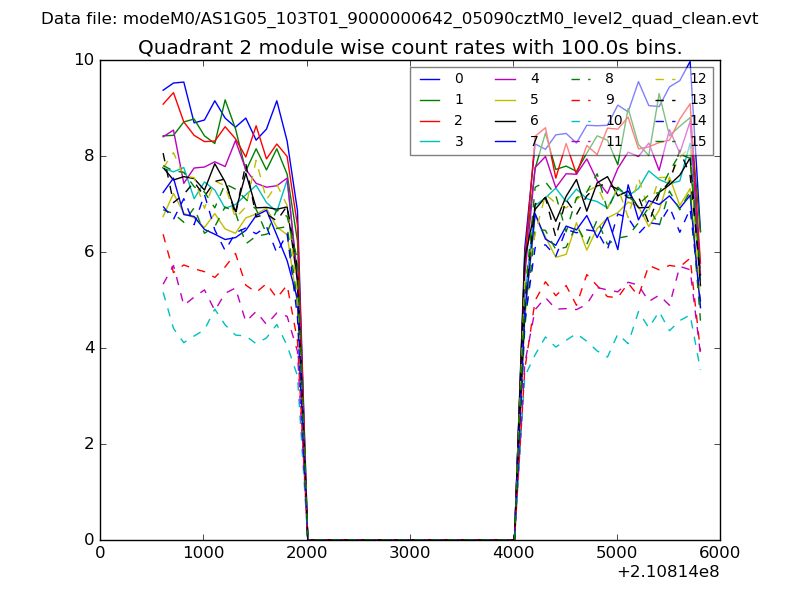
| Module-wise count rates for Quadrant B Data is divided into 100 sec bins |
 |
 |
| Module-wise count rates for Quadrant C Data is divided into 100 sec bins |
 |
 |
| Module-wise count rates for Quadrant D Data is divided into 100 sec bins |
 |
 |
| Parameter | Plot |
|---|---|
| CZT HV Monitor | 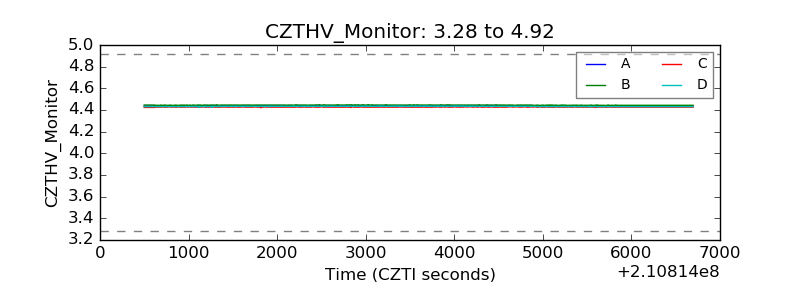 |
| D_VDD | 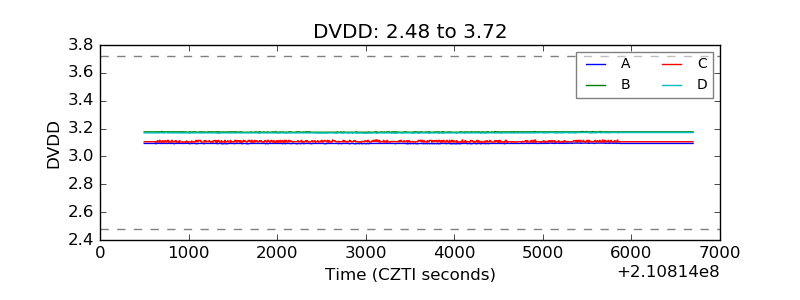 |
| Temperature 1 | 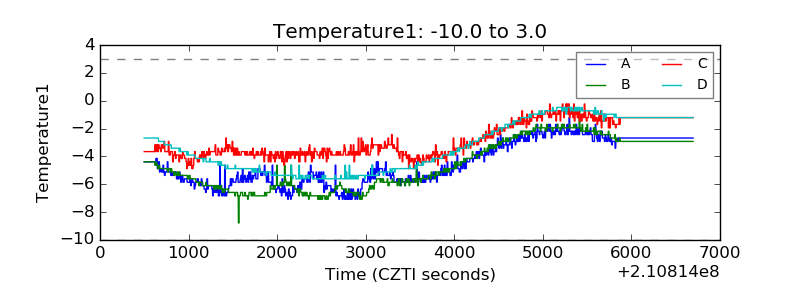 |
| Veto HV Monitor | 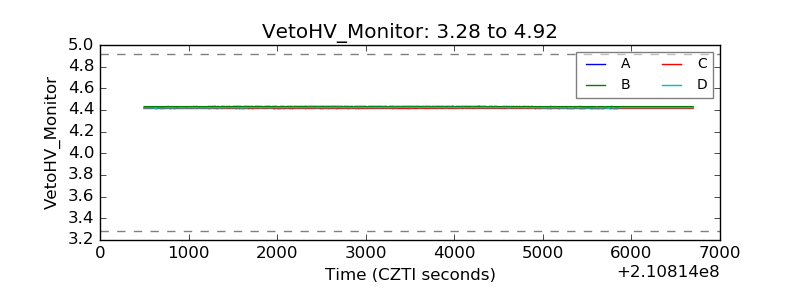 |
| Veto LLD | 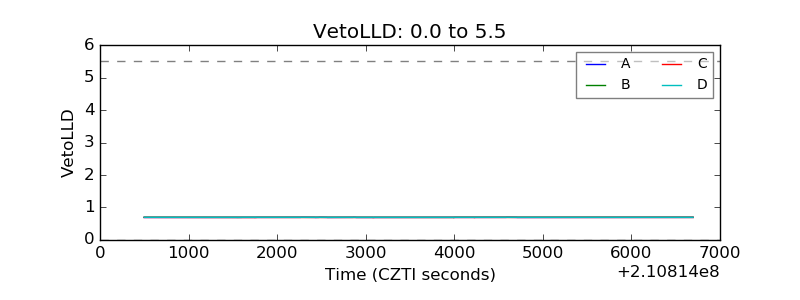 |
| Alpha Counter | 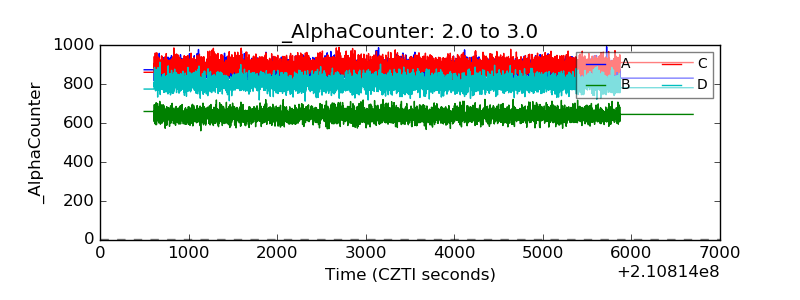 |
| _CPM_Rate | 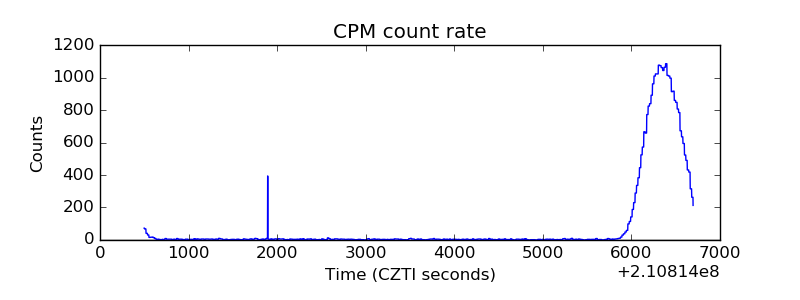 |
| CZT Counter | 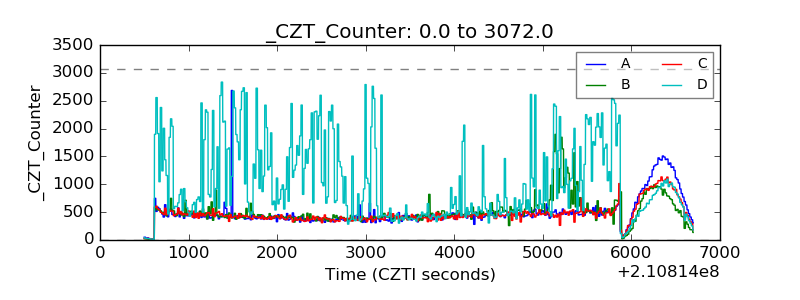 |
| +2.5 Volts monitor | 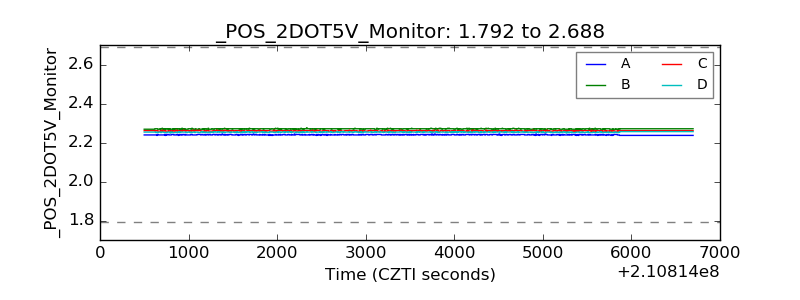 |
| +5 Volts monitor | 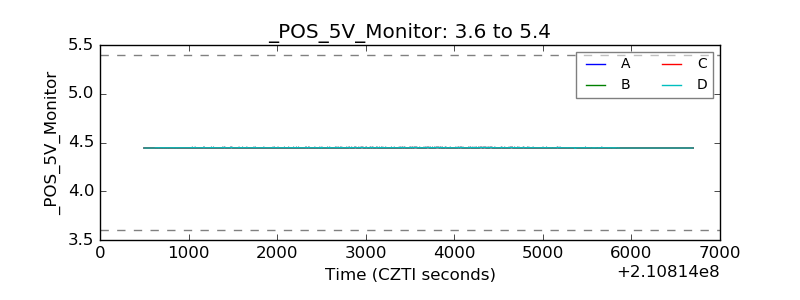 |
| _ROLL_ROT | 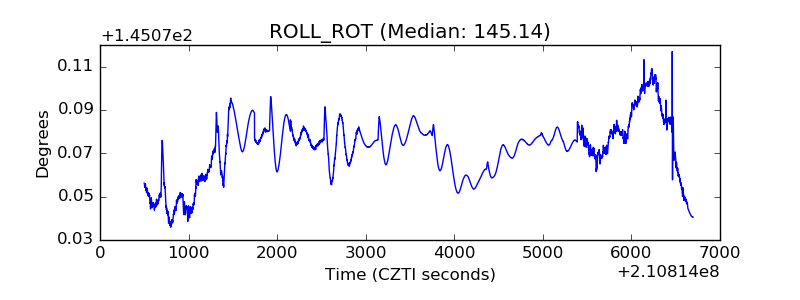 |
| _Roll_DEC | 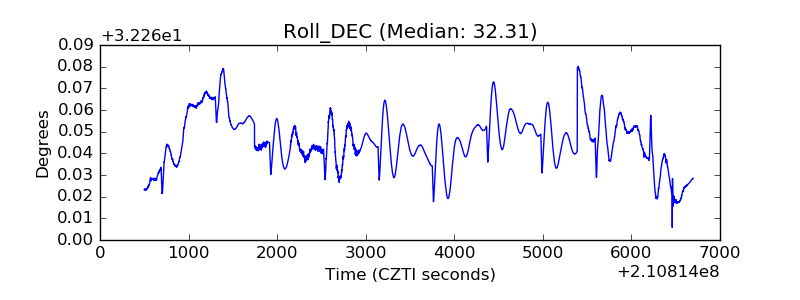 |
| _Roll_RA | 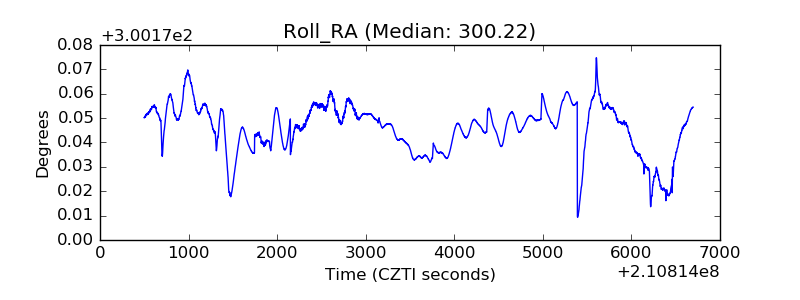 |
| Veto Counter | 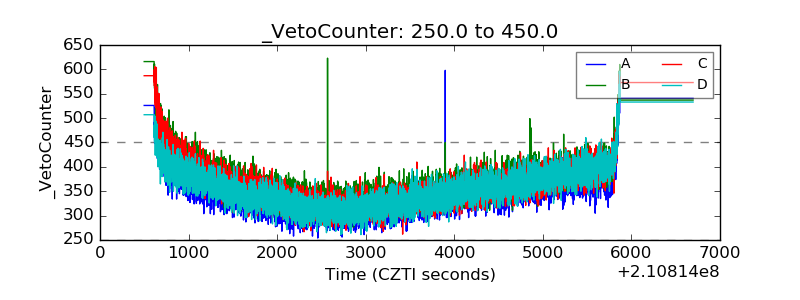 |