| Param | Original file | Final file |
|---|---|---|
| Filename | modeM0/AS1G05_105T01_9000000644cztM0_level2.fits | modeM0/AS1G05_105T01_9000000644cztM0_level2_quad_clean.evt |
| Size (bytes) | 1,050,560,640 | 818,729,280 |
| Size | 1001.9 MB | 780.8 MB |
| Events in quadrant A | 3,908,535 | 4,775,020 |
| Events in quadrant B | 9,874,187 | 6,189,029 |
| Events in quadrant C | 10,010,720 | 5,328,606 |
| Events in quadrant D | 3,060,442 | 3,542,436 |
| Mode SS | |||
|---|---|---|---|
| Quadrant | BADHDUFLAG | Total packets | Discarded packets |
| A | 0 | 1489 | 0 |
| B | 0 | 1491 | 0 |
| C | 0 | 1489 | 0 |
| D | 0 | 1490 | 0 |
| Mode M9 | |||
|---|---|---|---|
| Quadrant | BADHDUFLAG | Total packets | Discarded packets |
| A | 1 | 140350465071144 | 140346646331438 |
| B | 1 | 140350465071144 | 140346646331438 |
| C | 1 | 140350465071144 | 140346646331438 |
| D | 1 | 140350465071144 | 140346646331438 |
| Mode M0 | |||
|---|---|---|---|
| Quadrant | BADHDUFLAG | Total packets | Discarded packets |
| A | 0 | 150165 | 0 |
| B | 0 | 165771 | 0 |
| C | 0 | 147284 | 0 |
| D | 0 | 245957 | 0 |
| Quadrant | Total seconds | Saturated seconds | Saturation percentage |
|---|---|---|---|
| A | 72218 | 967 | 1.339001% |
| B | 72195 | 2563 | 3.550107% |
| C | 72217 | 676 | 0.936068% |
| D | 72736 | 11976 | 16.465024% |
Noise dominated data is calculated using 1-second bins in cleaned event files. If a bin has >2000 counts, and if more than 50% of those come from <1% of pixels, then it is considered to be noise-dominated and hence unusable.
| Quadrant | # 1 sec bins | Bins with >0 counts | Bins with >2000 counts | High rate bins dominated by noise | Noise dominated (total time) | Noise dominated (detector-on time) | Marked lightcurve |
|---|---|---|---|---|---|---|---|
| A | 88594 | 71913 | 0 | 0 | 0.00% | 0.00% |  |
| B | 1045437 | 71836 | 0 | 0 | 0.00% | 0.00% |  |
| C | 1045437 | 71919 | 0 | 0 | 0.00% | 0.00% |  |
| D | 1045057 | 71407 | 0 | 0 | 0.00% | 0.00% |  |
Top three noisy pixels from each quadrant. If the there are fewer than three noisy pixels in the level2.evt file, extra rows are filled as -1
| Pixel properties | Quadrant properties | ||||||
|---|---|---|---|---|---|---|---|
| Quadrant | DetID | PixID | Counts | Sigma | Mean | Median | Sigma |
| A | 14 | 188 | 3953 | 11.55 | 1014 | 948 | 260.1 |
| A | 0 | 29 | 3810 | 11.0 | 1014 | 948 | 260.1 |
| A | 14 | 204 | 3403 | 9.44 | 1014 | 948 | 260.1 |
| B | 9 | 144 | 5747 | 5.96 | 2640 | 2580 | 531.7 |
| B | 12 | 144 | 5321 | 5.16 | 2640 | 2580 | 531.7 |
| B | -1 | -1 | -1 | -1.0 | 2640 | 2580 | 531.7 |
| C | 3 | 202 | 6194 | 5.02 | 2672 | 2679 | 699.8 |
| C | -1 | -1 | -1 | -1.0 | 2672 | 2679 | 699.8 |
| C | -1 | -1 | -1 | -1.0 | 2672 | 2679 | 699.8 |
| D | 3 | 14 | 2414 | 6.85 | 870 | 788 | 237.5 |
| D | 11 | 82 | 2408 | 6.82 | 870 | 788 | 237.5 |
| D | 6 | 231 | 2357 | 6.61 | 870 | 788 | 237.5 |
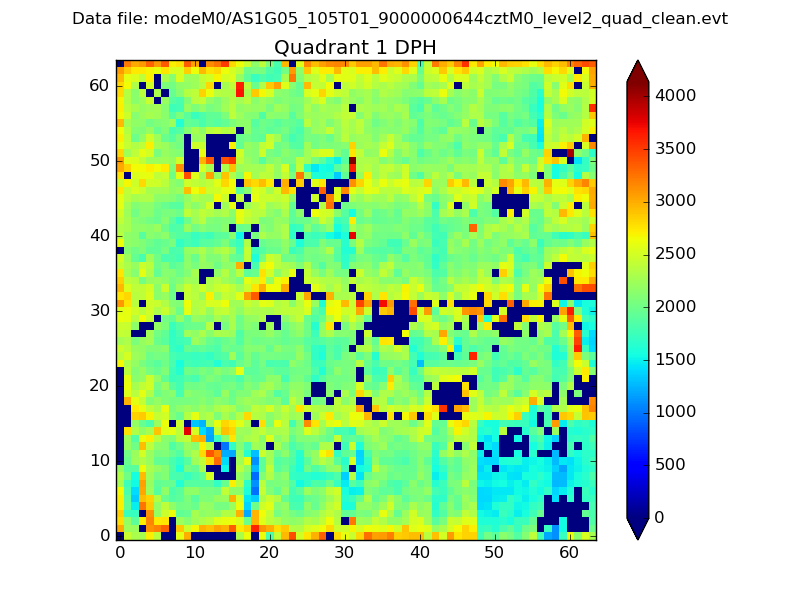
Histogram calculated using DETX and DETY for each event in the final _common_clean file
| Quadrant A |  |
 |
Quadrant B |
|---|---|---|---|
| Quadrant D | 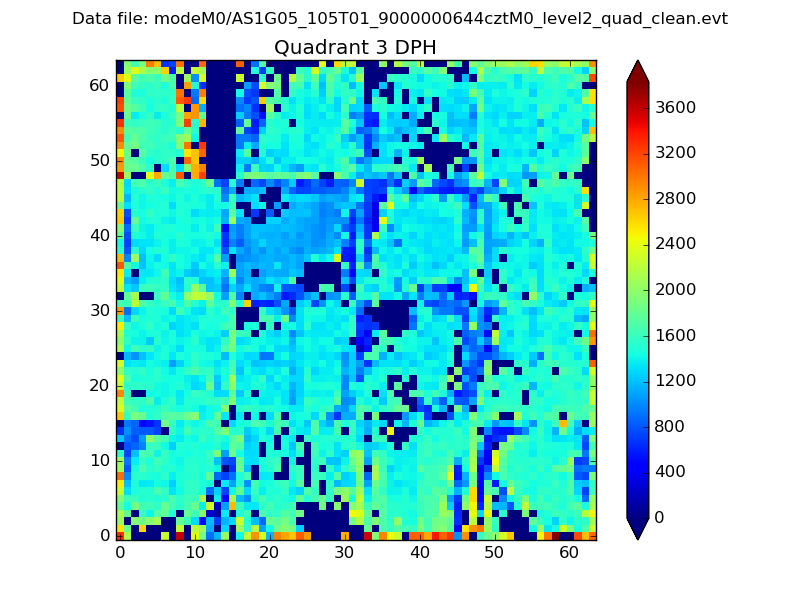 |
 |
Quadrant C |
| Plot type | Count rate plots | Images |
|---|---|---|
| Comparison with Poisson distribution Blue bars denote a histogram of data divided into 1 sec bins. Red curve is a Poisson curve with rate = median count rate of data. |
 |
 |
| Quadrant-wise count rates Data is divided into 100 sec bins |
 |
|
| Module-wise count rates for Quadrant A Data is divided into 100 sec bins |
 |
 |
| Module-wise count rates for Quadrant B Data is divided into 100 sec bins |
 |
 |
| Module-wise count rates for Quadrant C Data is divided into 100 sec bins |
 |
 |
| Module-wise count rates for Quadrant D Data is divided into 100 sec bins |
 |
 |
| Parameter | Plot |
|---|---|
| CZT HV Monitor |  |
| D_VDD | 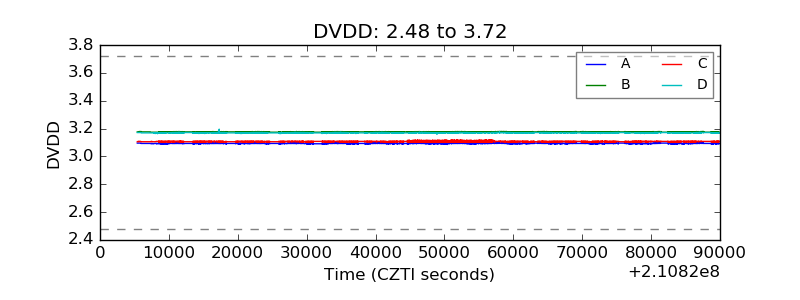 |
| Temperature 1 |  |
| Veto HV Monitor |  |
| Veto LLD |  |
| Alpha Counter |  |
| _CPM_Rate |  |
| CZT Counter |  |
| +2.5 Volts monitor |  |
| +5 Volts monitor |  |
| _ROLL_ROT |  |
| _Roll_DEC |  |
| _Roll_RA |  |
| Veto Counter |  |