| Param | Original file | Final file |
|---|---|---|
| Filename | modeM0/AS1G05_105T01_9000000644_05092cztM0_level2.evt | modeM0/AS1G05_105T01_9000000644_05092cztM0_level2_quad_clean.evt |
| Size (bytes) | 7,914,240 | 2,609,280 |
| Size | 7.5 MB | 2.5 MB |
| Events in quadrant A | 75,861 | 18,529 |
| Events in quadrant B | 68,671 | 19,329 |
| Events in quadrant C | 75,234 | 20,461 |
| Events in quadrant D | 5,998 | 1,220 |
| Mode SS | |||
|---|---|---|---|
| Quadrant | BADHDUFLAG | Total packets | Discarded packets |
| A | 0 | 102 | 85 |
| B | 0 | 102 | 83 |
| C | 0 | 102 | 85 |
| D | 0 | 102 | 84 |
| Mode M9 | |||
|---|---|---|---|
| Quadrant | BADHDUFLAG | Total packets | Discarded packets |
| A | 0 | 11 | 0 |
| B | 1 | 11 | 0 |
| C | 1 | -1 | -1 |
| D | 1 | -1 | -1 |
| Mode M0 | |||
|---|---|---|---|
| Quadrant | BADHDUFLAG | Total packets | Discarded packets |
| A | 0 | 10209 | 9882 |
| B | 0 | 10592 | 10310 |
| C | 0 | 10161 | 9836 |
| D | 0 | 18823 | 18799 |
| Quadrant | Total seconds | Saturated seconds | Saturation percentage |
|---|---|---|---|
| A | 164 | 1 | 0.609756% |
| B | 141 | 0 | 0.000000% |
| C | 163 | 1 | 0.613497% |
| D | 12 | 0 | 0.000000% |
Noise dominated data is calculated using 1-second bins in cleaned event files. If a bin has >2000 counts, and if more than 50% of those come from <1% of pixels, then it is considered to be noise-dominated and hence unusable.
| Quadrant | # 1 sec bins | Bins with >0 counts | Bins with >2000 counts | High rate bins dominated by noise | Noise dominated (total time) | Noise dominated (detector-on time) | Marked lightcurve |
|---|---|---|---|---|---|---|---|
| A | 3030 | 326 | 0 | 0 | 0.00% | 0.00% | 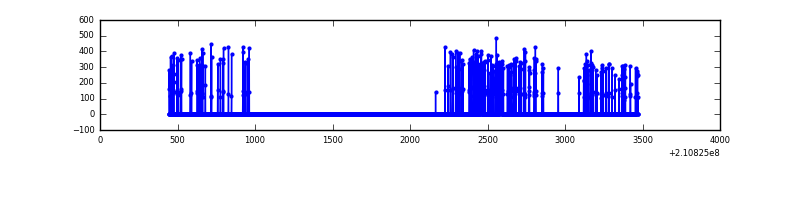 |
| B | 3030 | 280 | 0 | 0 | 0.00% | 0.00% | 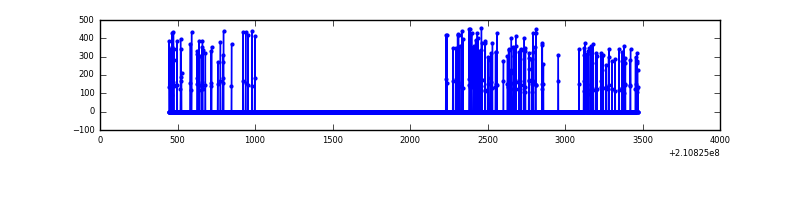 |
| C | 3030 | 322 | 0 | 0 | 0.00% | 0.00% | 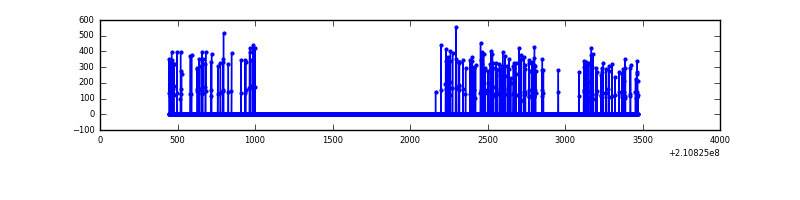 |
| D | 1976 | 22 | 0 | 0 | 0.00% | 0.00% | 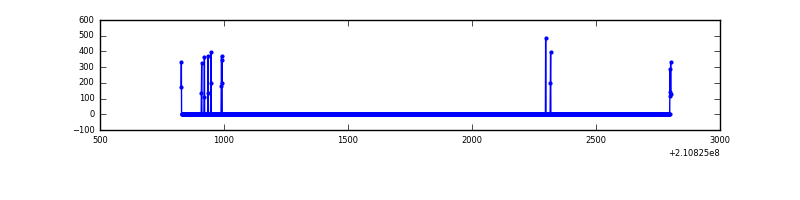 |
Top three noisy pixels from each quadrant. If the there are fewer than three noisy pixels in the level2.evt file, extra rows are filled as -1
| Pixel properties | Quadrant properties | ||||||
|---|---|---|---|---|---|---|---|
| Quadrant | DetID | PixID | Counts | Sigma | Mean | Median | Sigma |
| A | 0 | 50 | 227 | 34.61 | 19 | 19 | 6.0 |
| A | 12 | 194 | 188 | 28.12 | 19 | 19 | 6.0 |
| A | 0 | 226 | 177 | 26.29 | 19 | 19 | 6.0 |
| B | 15 | 204 | 1049 | 192.86 | 17 | 16 | 5.4 |
| B | 4 | 80 | 907 | 166.35 | 17 | 16 | 5.4 |
| B | 12 | 111 | 283 | 49.85 | 17 | 16 | 5.4 |
| C | 1 | 16 | 474 | 73.85 | 19 | 18 | 6.2 |
| C | 13 | 61 | 162 | 23.32 | 19 | 18 | 6.2 |
| C | 9 | 54 | 91 | 11.82 | 19 | 18 | 6.2 |
| D | 13 | 235 | 294 | 325.64 | 1 | 1 | 0.9 |
| D | 2 | 136 | 158 | 174.49 | 1 | 1 | 0.9 |
| D | 13 | 238 | 110 | 121.14 | 1 | 1 | 0.9 |
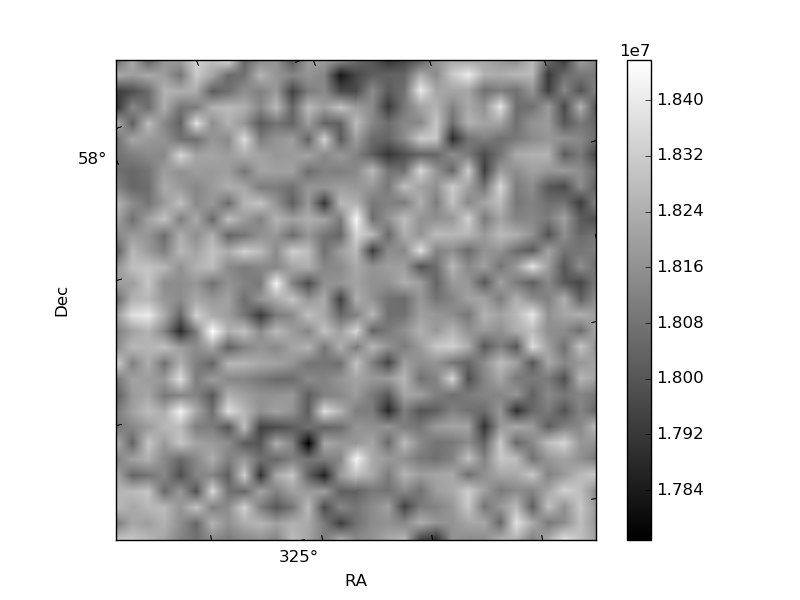
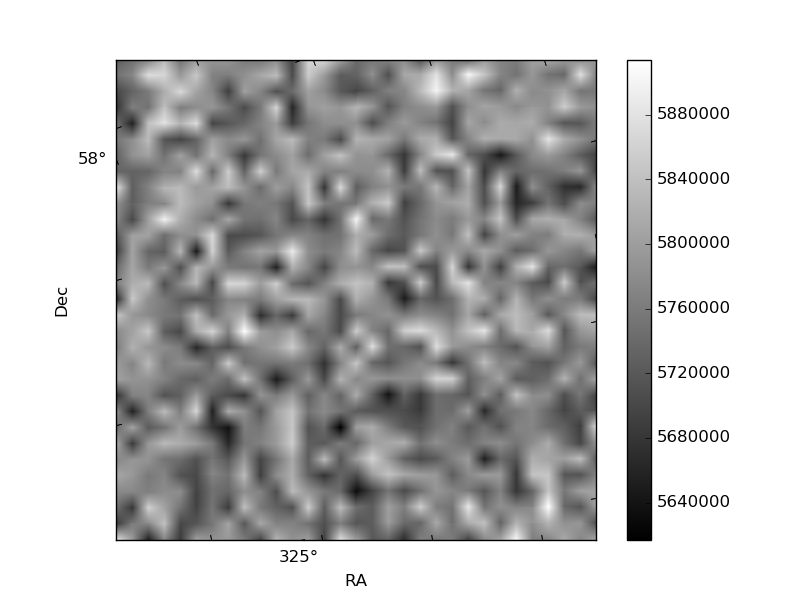
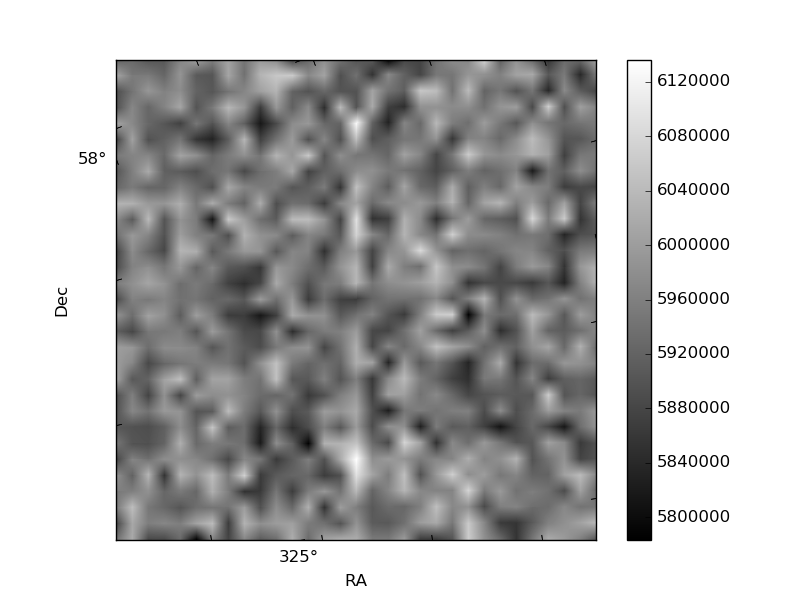
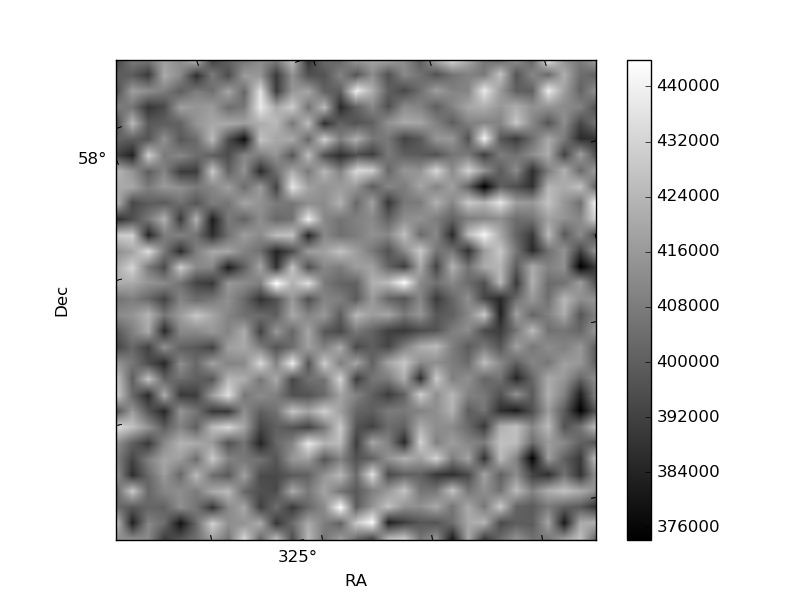
Histogram calculated using DETX and DETY for each event in the final _common_clean file
| Quadrant A | 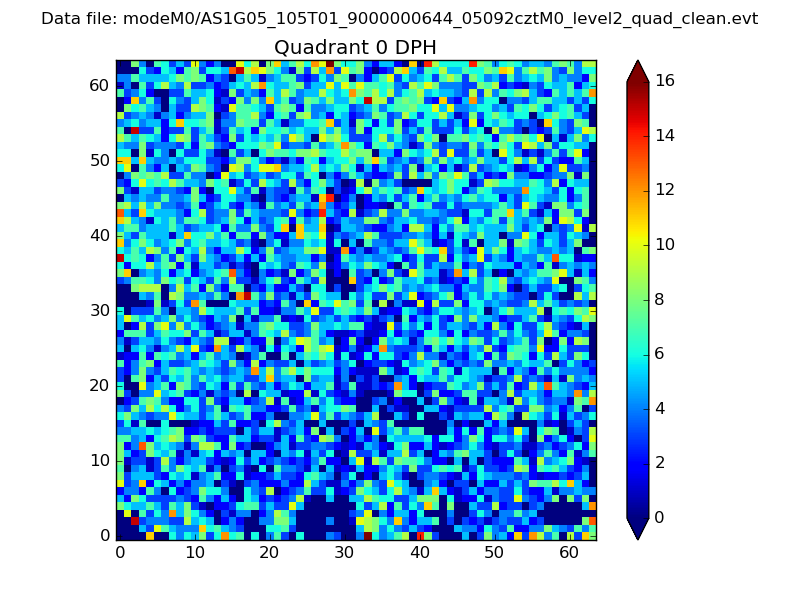 |
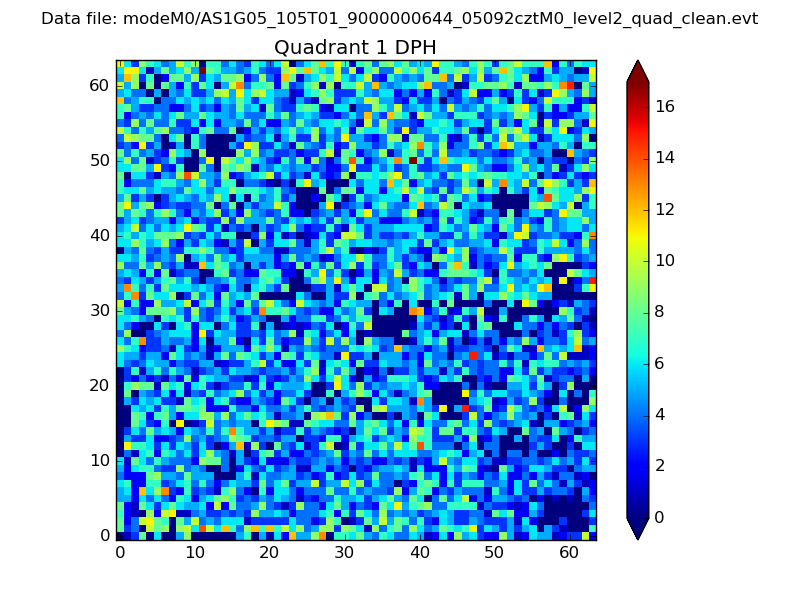 |
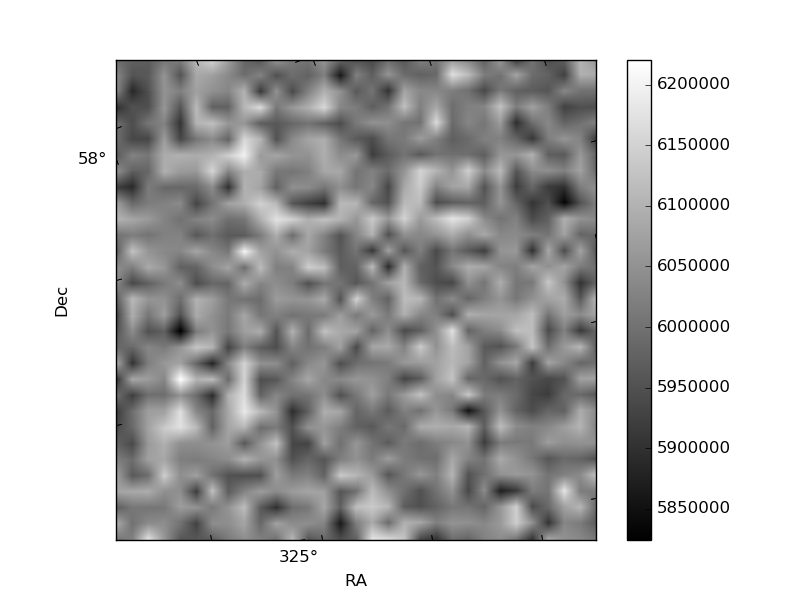
Quadrant B |
|---|---|---|---|
| Quadrant D | 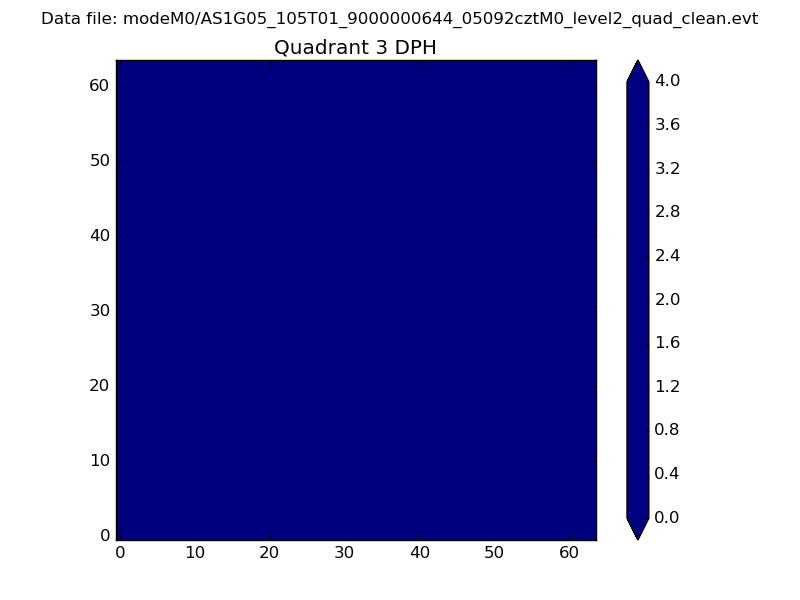 |
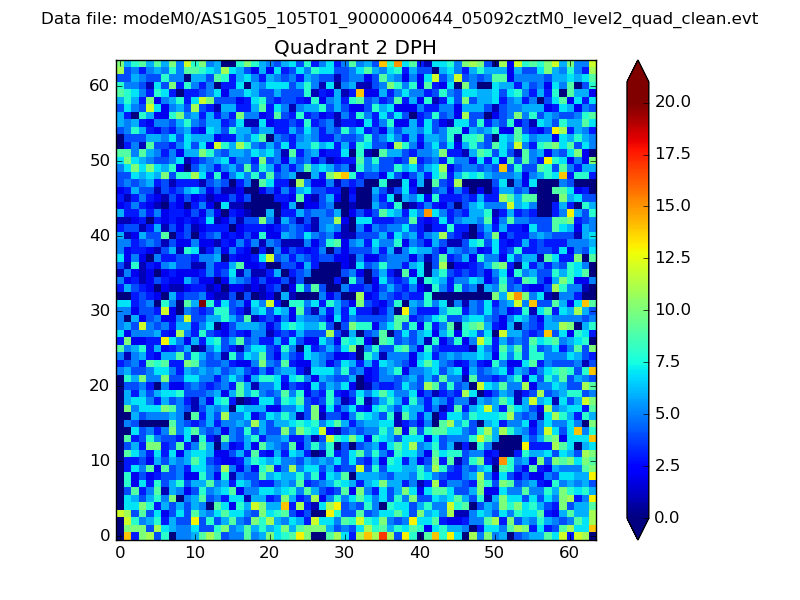 |
Quadrant C |
| Plot type | Count rate plots | Images |
|---|---|---|
| Comparison with Poisson distribution Blue bars denote a histogram of data divided into 1 sec bins. Red curve is a Poisson curve with rate = median count rate of data. |
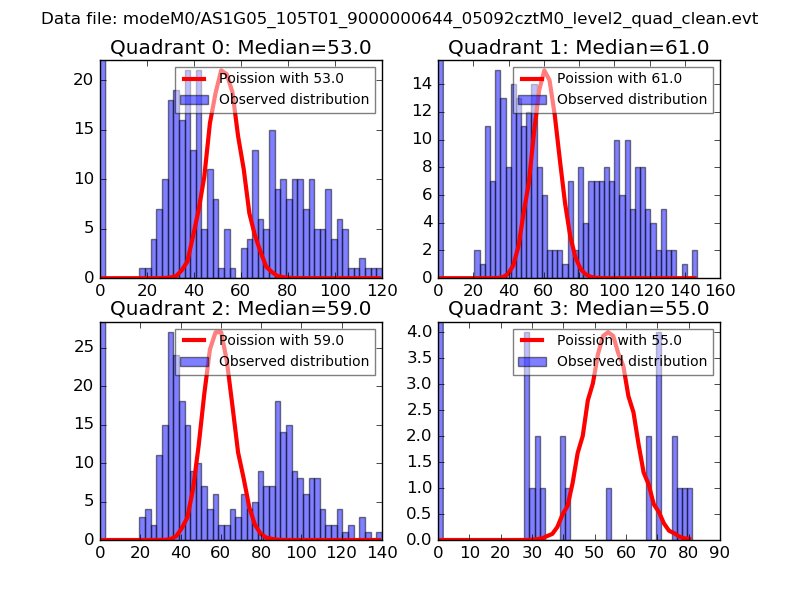 |
 |
| Quadrant-wise count rates Data is divided into 100 sec bins |
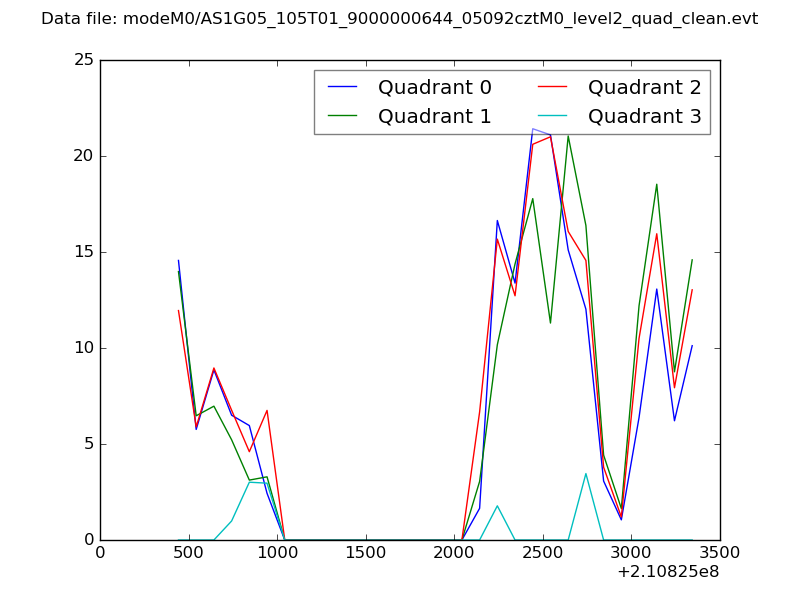 |
|
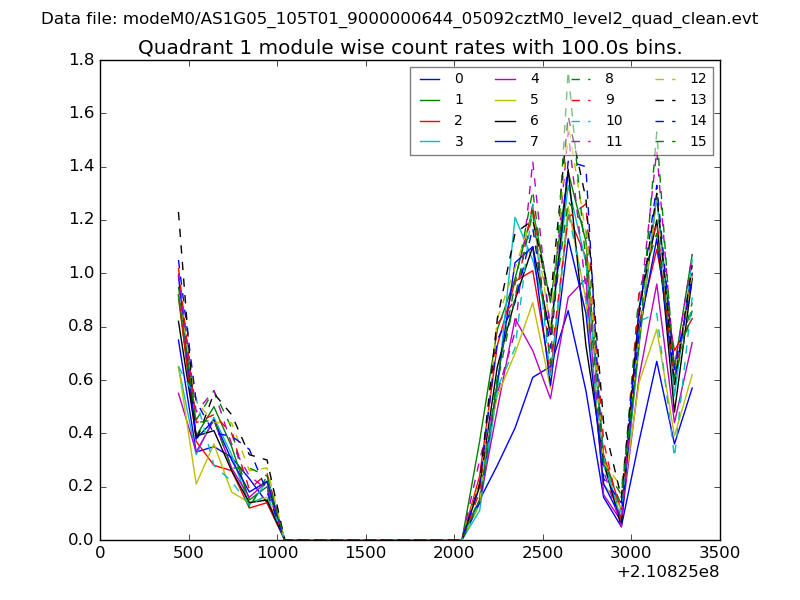
| Module-wise count rates for Quadrant A Data is divided into 100 sec bins |
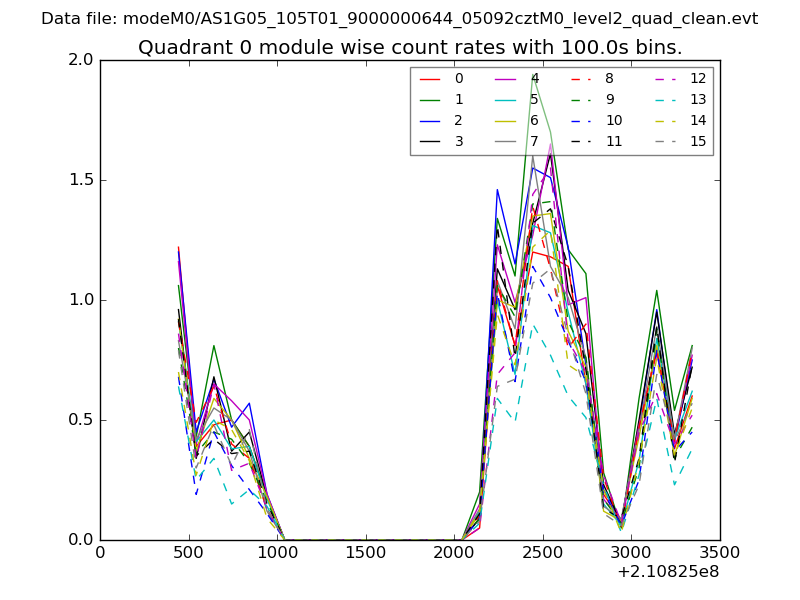 |
 |
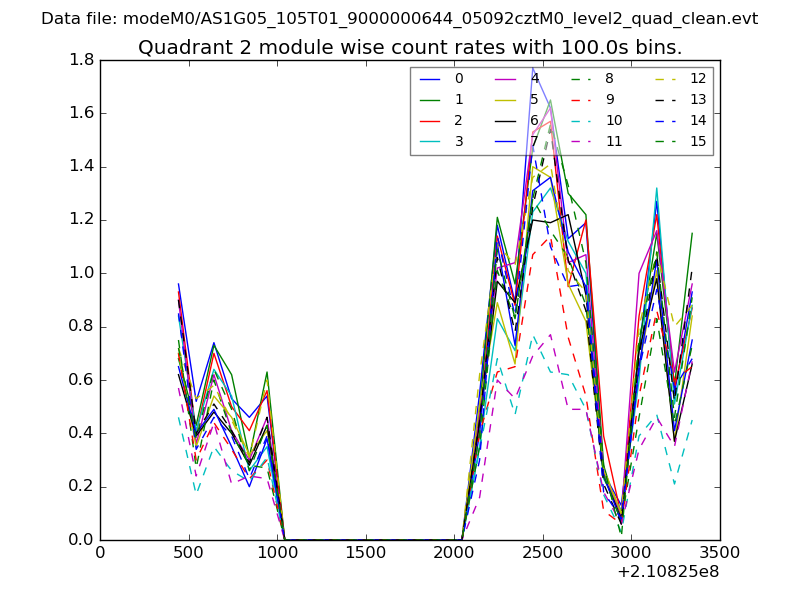
| Module-wise count rates for Quadrant B Data is divided into 100 sec bins |
 |
 |
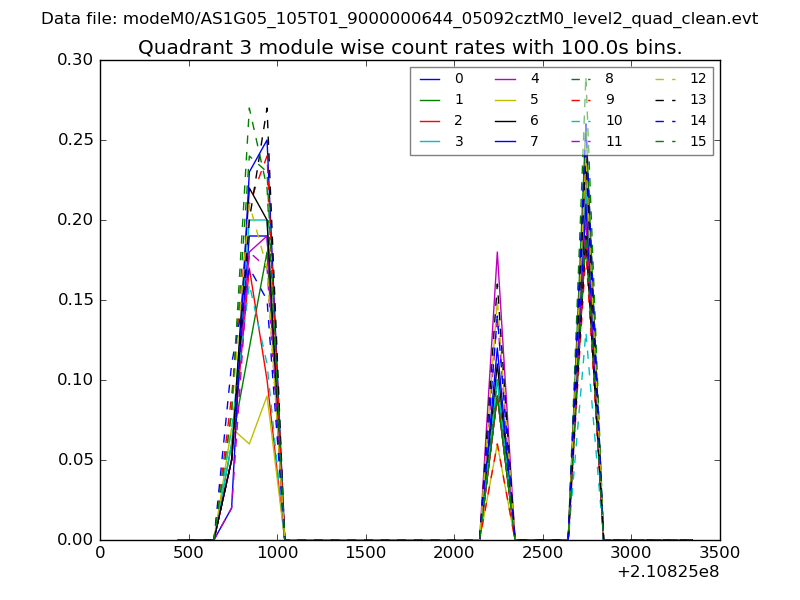
| Module-wise count rates for Quadrant C Data is divided into 100 sec bins |
 |
 |
| Module-wise count rates for Quadrant D Data is divided into 100 sec bins |
 |
 |
| Parameter | Plot |
|---|---|
| CZT HV Monitor | 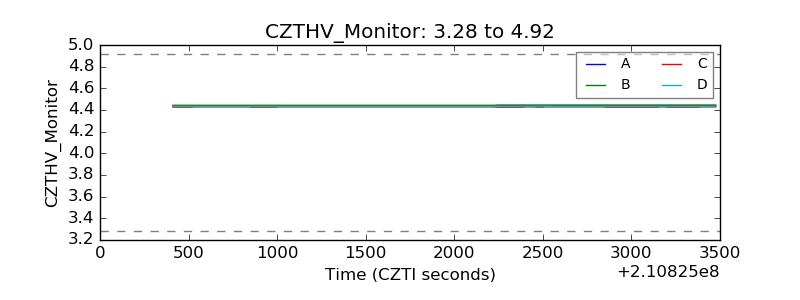 |
| D_VDD | 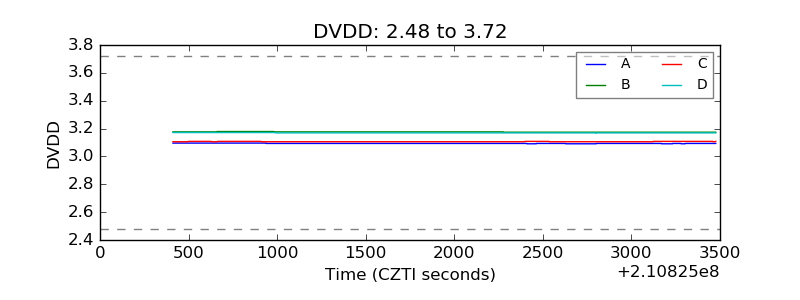 |
| Temperature 1 | 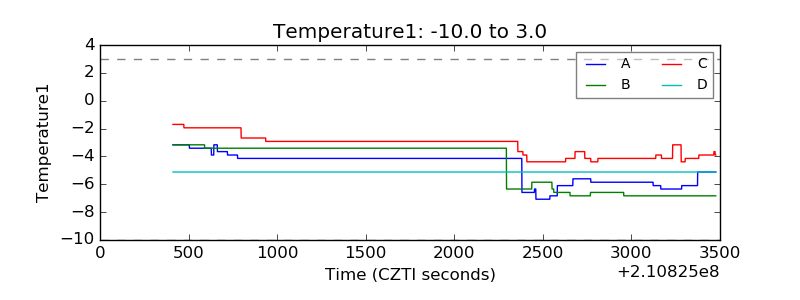 |
| Veto HV Monitor | 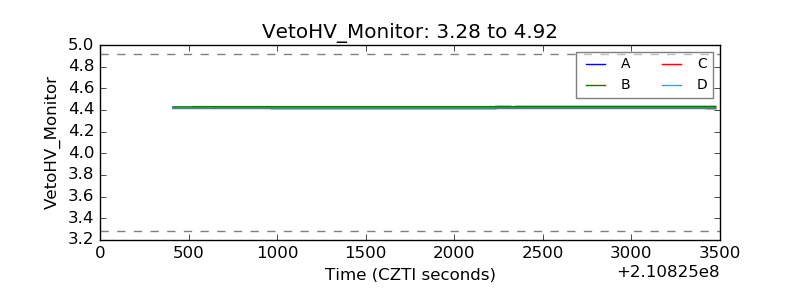 |
| Veto LLD | 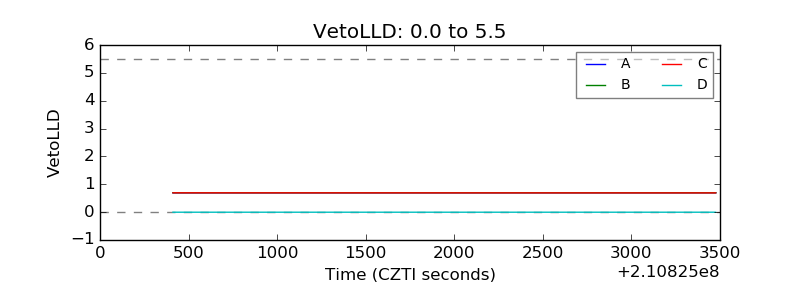 |
| Alpha Counter | 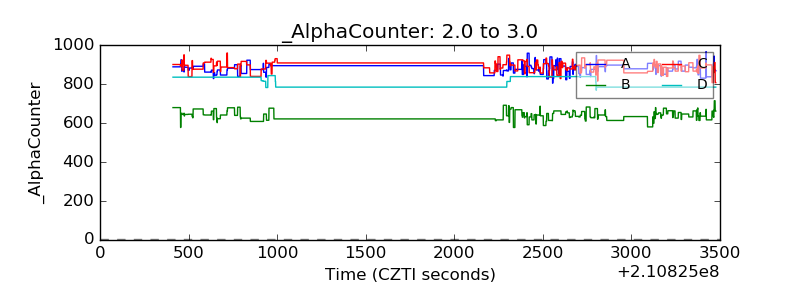 |
| _CPM_Rate | 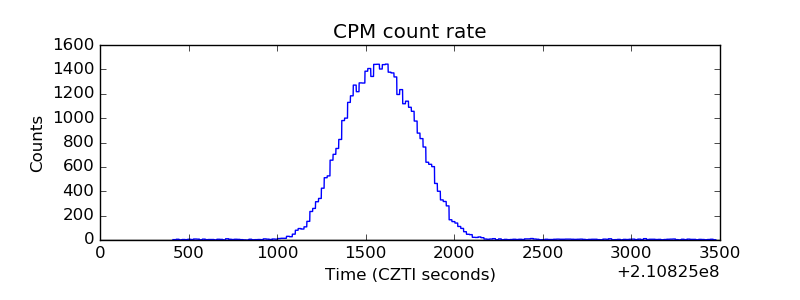 |
| CZT Counter | 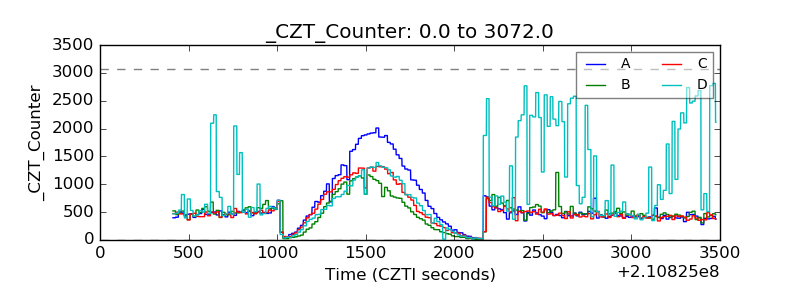 |
| +2.5 Volts monitor |  |
| +5 Volts monitor | 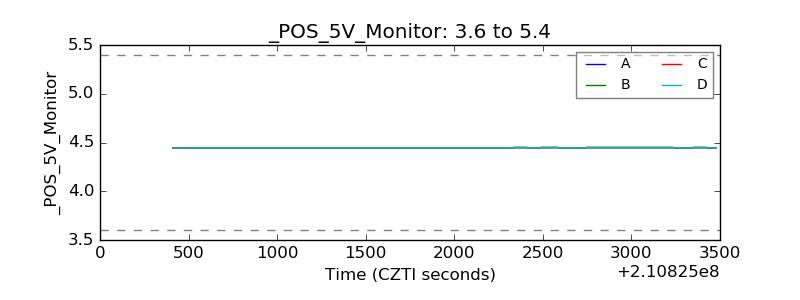 |
| _ROLL_ROT | 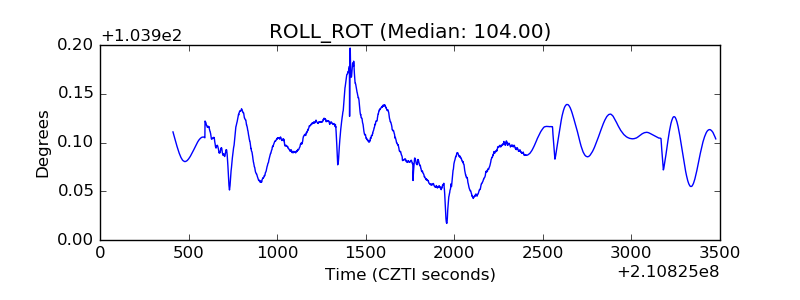 |
| _Roll_DEC | 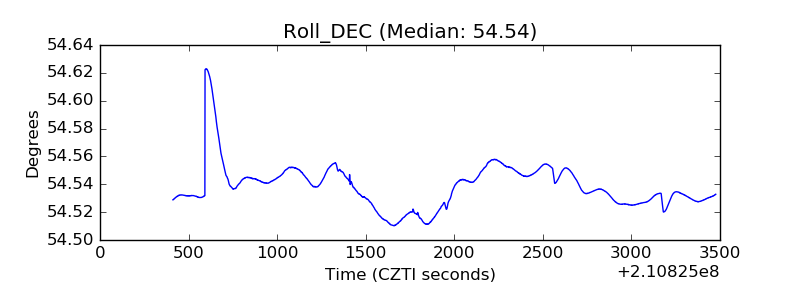 |
| _Roll_RA | 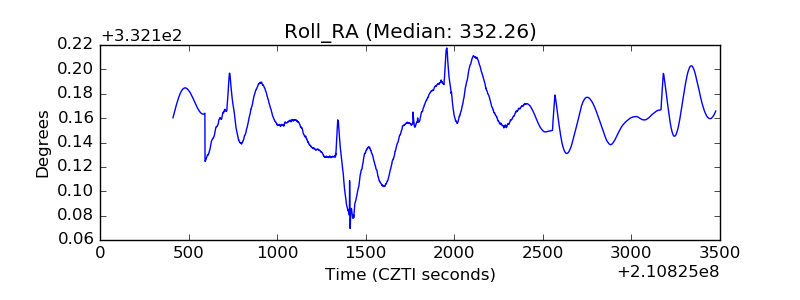 |
| Veto Counter | 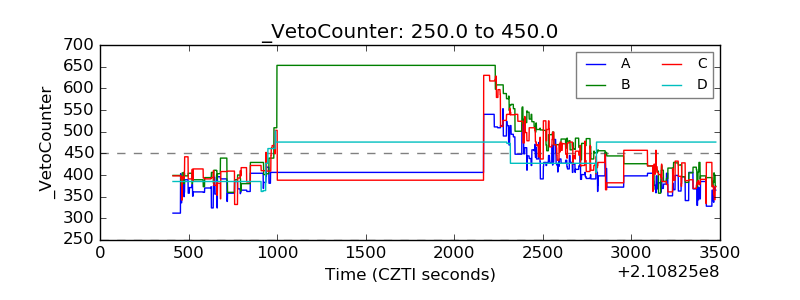 |