| Param | Original file | Final file |
|---|---|---|
| Filename | modeM0/AS1G05_105T01_9000000644_05094cztM0_level2.evt | modeM0/AS1G05_105T01_9000000644_05094cztM0_level2_quad_clean.evt |
| Size (bytes) | 484,436,160 | 72,141,120 |
| Size | 462.0 MB | 68.8 MB |
| Events in quadrant A | 2,996,633 | 464,638 |
| Events in quadrant B | 3,170,847 | 470,089 |
| Events in quadrant C | 2,901,325 | 442,722 |
| Events in quadrant D | 5,167,810 | 360,469 |
| Mode SS | |||
|---|---|---|---|
| Quadrant | BADHDUFLAG | Total packets | Discarded packets |
| A | 0 | 130 | 0 |
| B | 0 | 130 | 0 |
| C | 0 | 130 | 0 |
| D | 0 | 130 | 0 |
| Mode M9 | |||
|---|---|---|---|
| Quadrant | BADHDUFLAG | Total packets | Discarded packets |
| A | 0 | 17 | 0 |
| B | 0 | 17 | 0 |
| C | 0 | 17 | 0 |
| D | 0 | 18 | 0 |
| Mode M0 | |||
|---|---|---|---|
| Quadrant | BADHDUFLAG | Total packets | Discarded packets |
| A | 0 | 13116 | 3 |
| B | 0 | 13437 | 2 |
| C | 0 | 13075 | 2 |
| D | 0 | 19804 | 2 |
| Quadrant | Total seconds | Saturated seconds | Saturation percentage |
|---|---|---|---|
| A | 6392 | 78 | 1.220275% |
| B | 6392 | 86 | 1.345432% |
| C | 6392 | 52 | 0.813517% |
| D | 6392 | 971 | 15.190864% |
Noise dominated data is calculated using 1-second bins in cleaned event files. If a bin has >2000 counts, and if more than 50% of those come from <1% of pixels, then it is considered to be noise-dominated and hence unusable.
| Quadrant | # 1 sec bins | Bins with >0 counts | Bins with >2000 counts | High rate bins dominated by noise | Noise dominated (total time) | Noise dominated (detector-on time) | Marked lightcurve |
|---|---|---|---|---|---|---|---|
| A | 7642 | 6393 | 1 | 1 | 0.01% | 0.02% | 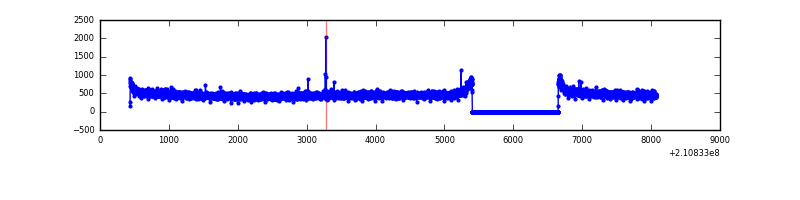 |
| B | 7642 | 6393 | 1 | 1 | 0.01% | 0.02% | 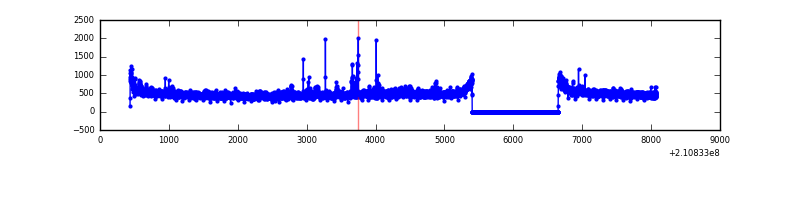 |
| C | 7642 | 6393 | 0 | 0 | 0.00% | 0.00% | 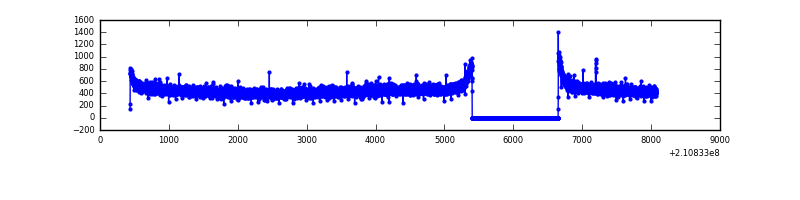 |
| D | 7642 | 6392 | 709 | 709 | 9.28% | 11.09% | 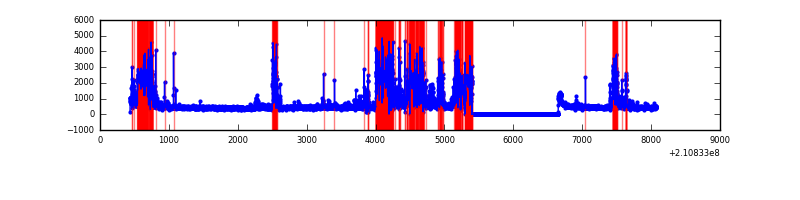 |
Top three noisy pixels from each quadrant. If the there are fewer than three noisy pixels in the level2.evt file, extra rows are filled as -1
| Pixel properties | Quadrant properties | ||||||
|---|---|---|---|---|---|---|---|
| Quadrant | DetID | PixID | Counts | Sigma | Mean | Median | Sigma |
| A | 12 | 194 | 7574 | 43.62 | 777 | 761 | 156.2 |
| A | 0 | 226 | 7539 | 43.39 | 777 | 761 | 156.2 |
| A | 0 | 50 | 6185 | 34.73 | 777 | 761 | 156.2 |
| B | 15 | 204 | 77001 | 512.27 | 784 | 767 | 148.8 |
| B | 4 | 80 | 29468 | 192.86 | 784 | 767 | 148.8 |
| B | 12 | 111 | 13378 | 84.74 | 784 | 767 | 148.8 |
| C | 13 | 61 | 6240 | 32.2 | 741 | 745 | 170.7 |
| C | 12 | 4 | 5423 | 27.41 | 741 | 745 | 170.7 |
| C | 1 | 16 | 3533 | 16.34 | 741 | 745 | 170.7 |
| D | 12 | 22 | 1600643 | 9912.83 | 663 | 644 | 161.4 |
| D | 13 | 235 | 632142 | 3912.46 | 663 | 644 | 161.4 |
| D | 13 | 239 | 188247 | 1162.3 | 663 | 644 | 161.4 |
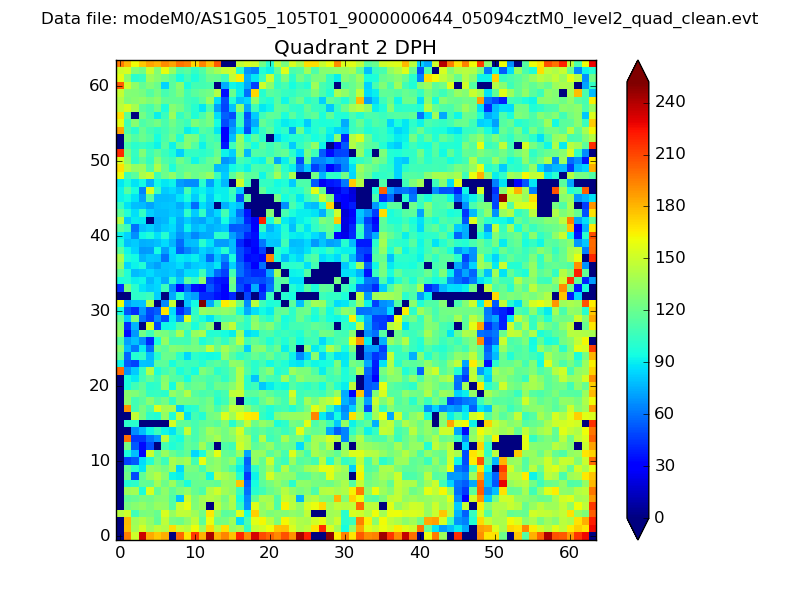
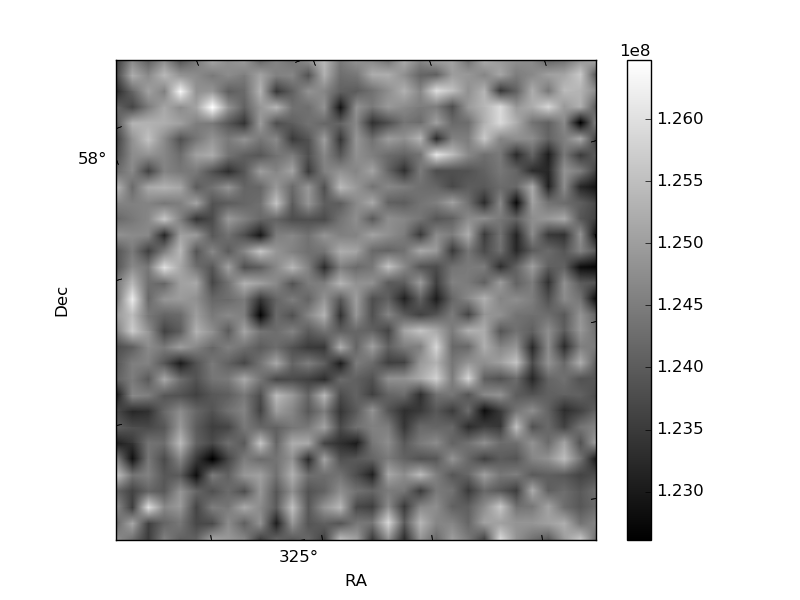
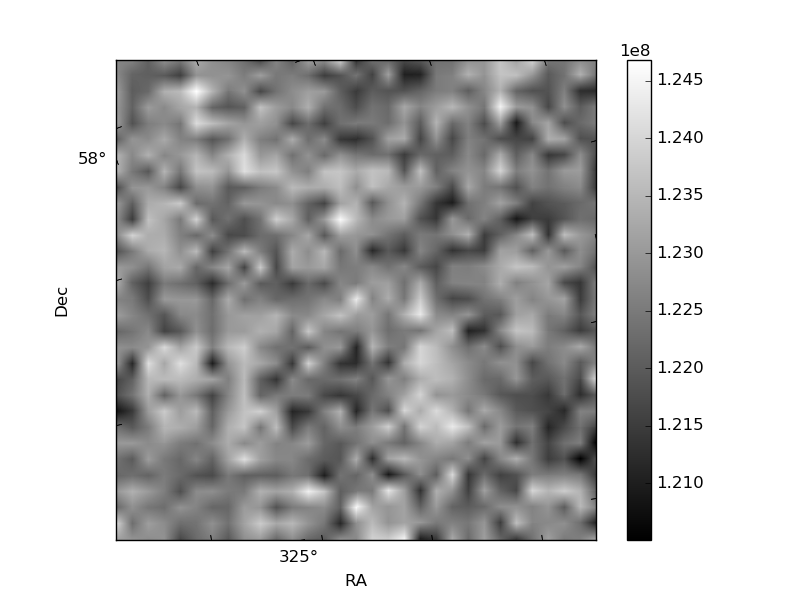
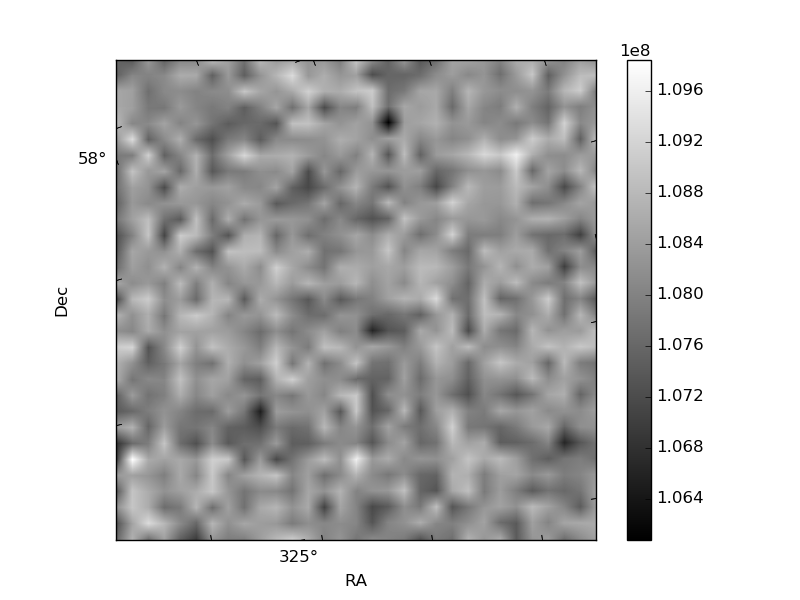
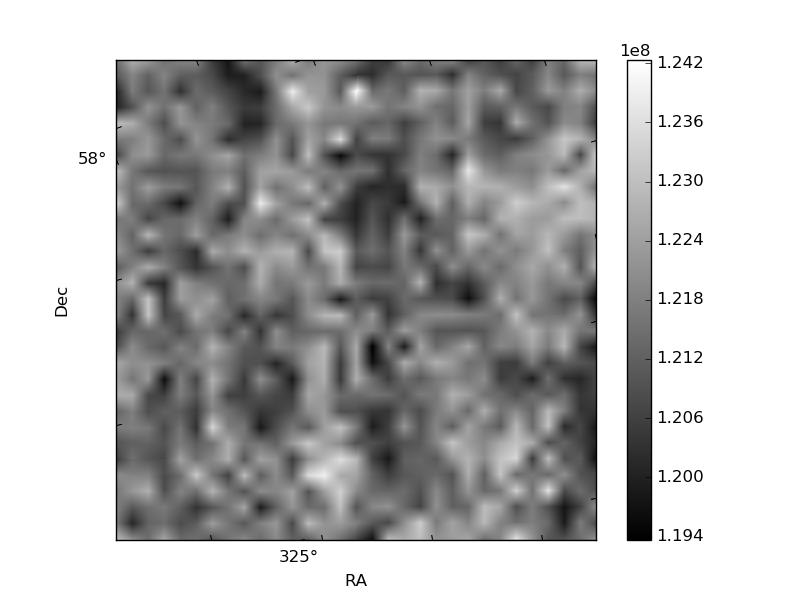
Histogram calculated using DETX and DETY for each event in the final _common_clean file
| Quadrant A | 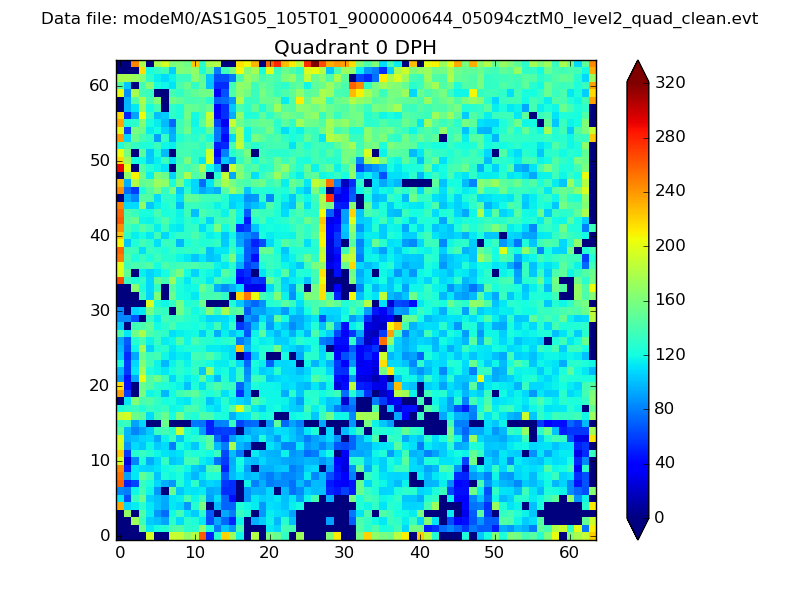 |
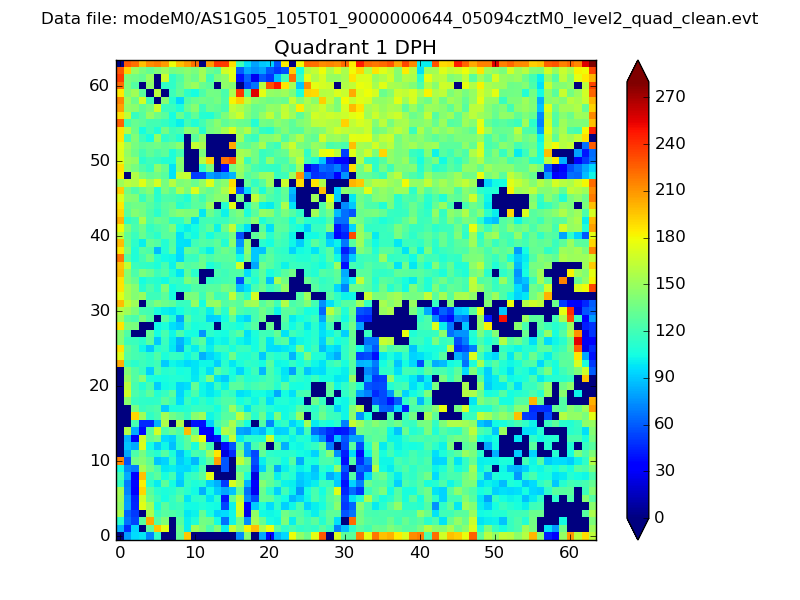 |
Quadrant B |
|---|---|---|---|
| Quadrant D | 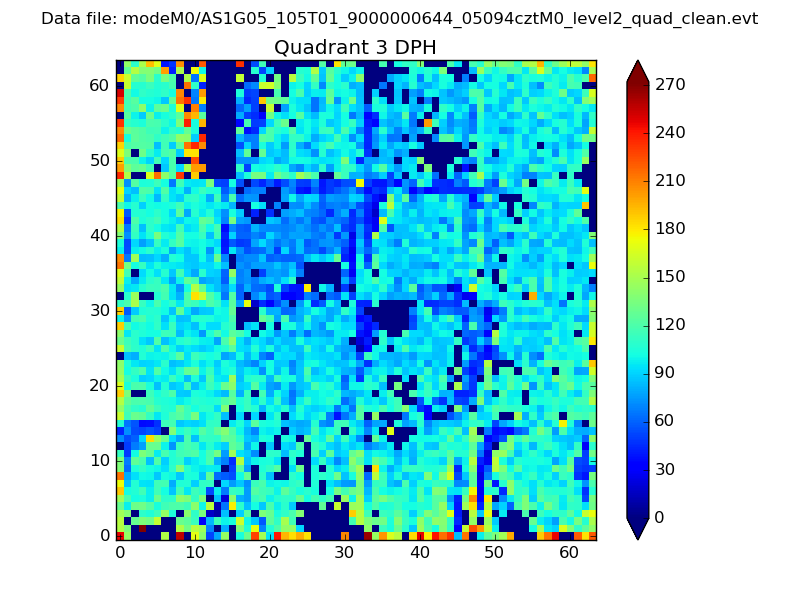 |
 |
Quadrant C |
| Plot type | Count rate plots | Images |
|---|---|---|
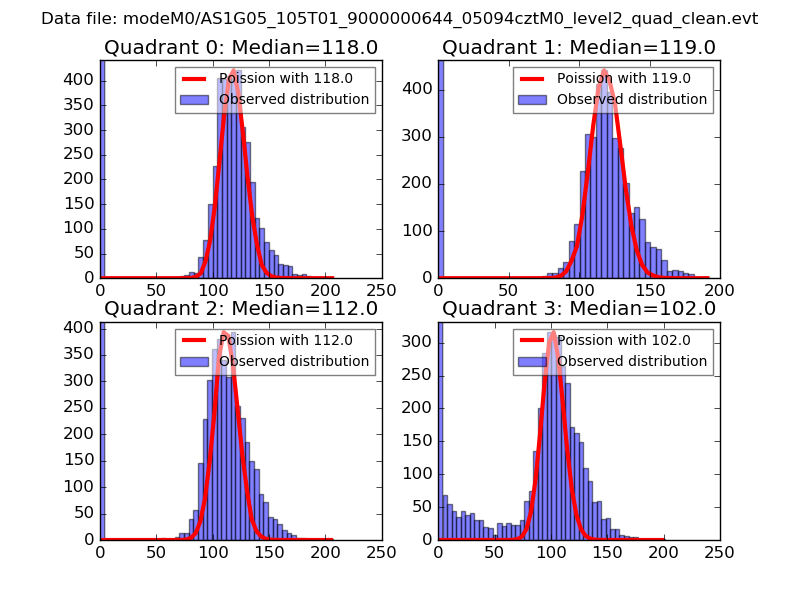
| Comparison with Poisson distribution Blue bars denote a histogram of data divided into 1 sec bins. Red curve is a Poisson curve with rate = median count rate of data. |
 |
 |
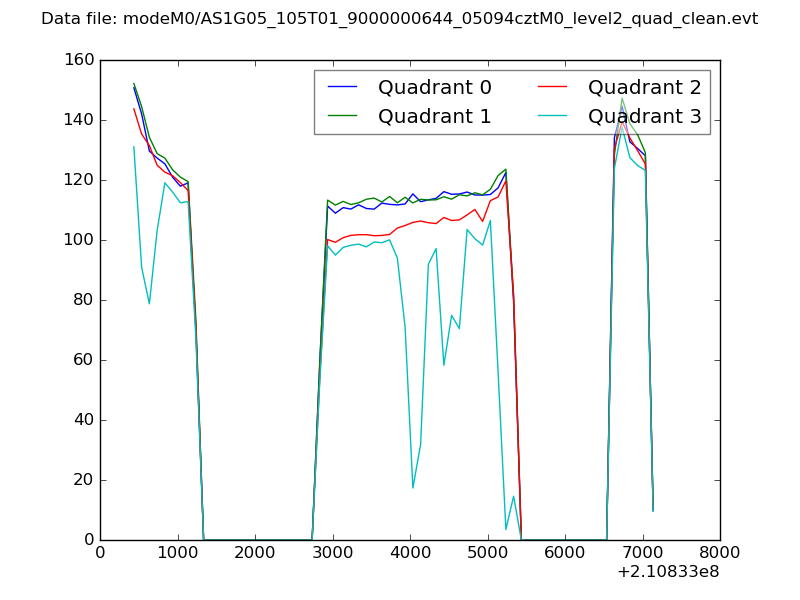
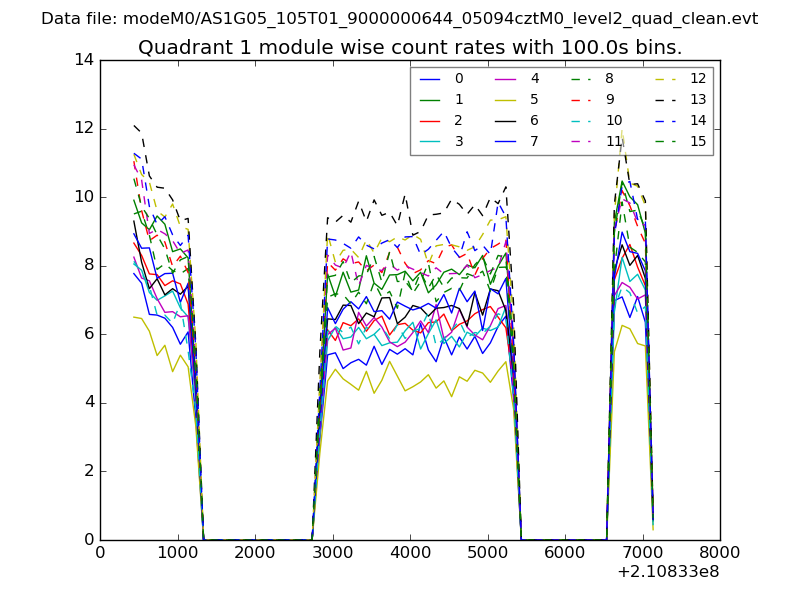
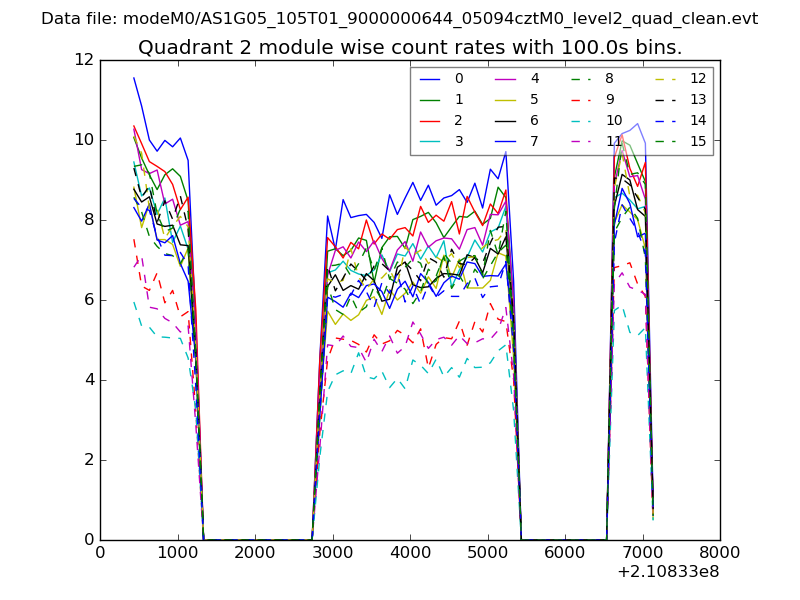
| Quadrant-wise count rates Data is divided into 100 sec bins |
 |
|
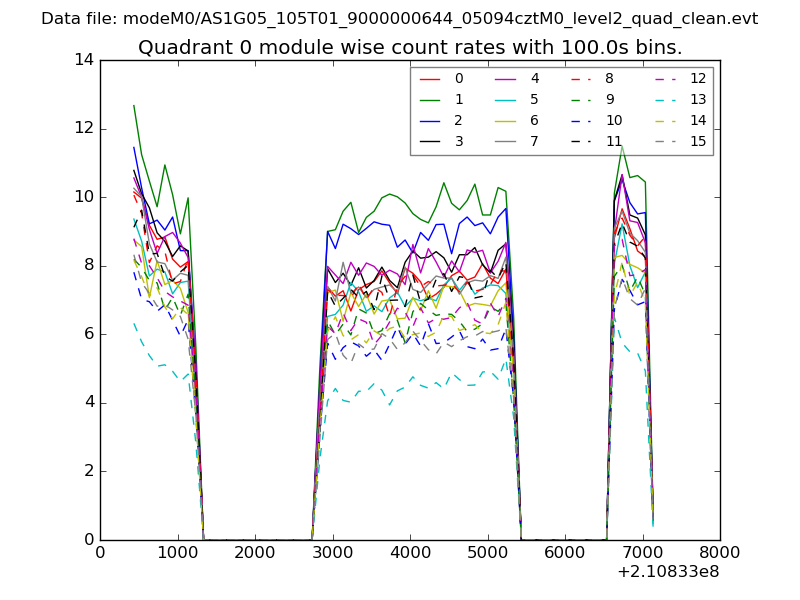
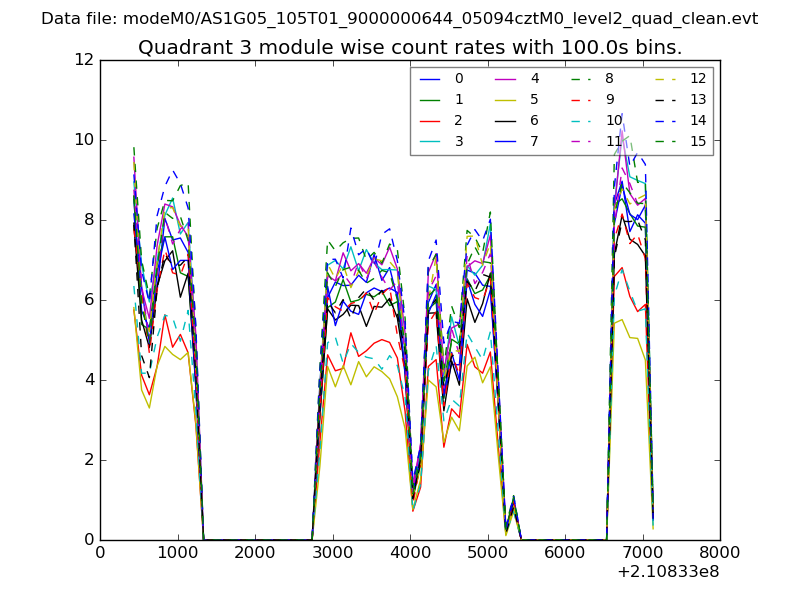
| Module-wise count rates for Quadrant A Data is divided into 100 sec bins |
 |
 |
| Module-wise count rates for Quadrant B Data is divided into 100 sec bins |
 |
 |
| Module-wise count rates for Quadrant C Data is divided into 100 sec bins |
 |
 |
| Module-wise count rates for Quadrant D Data is divided into 100 sec bins |
 |
 |
| Parameter | Plot |
|---|---|
| CZT HV Monitor | 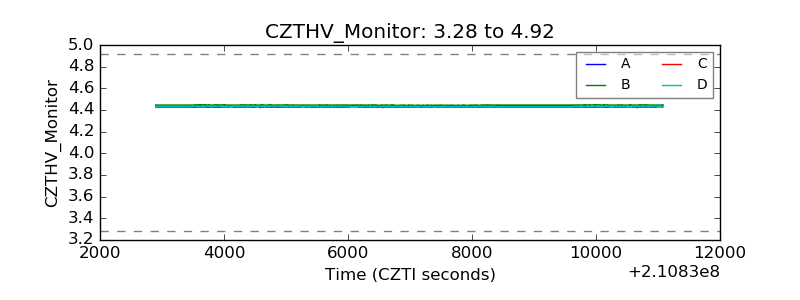 |
| D_VDD | 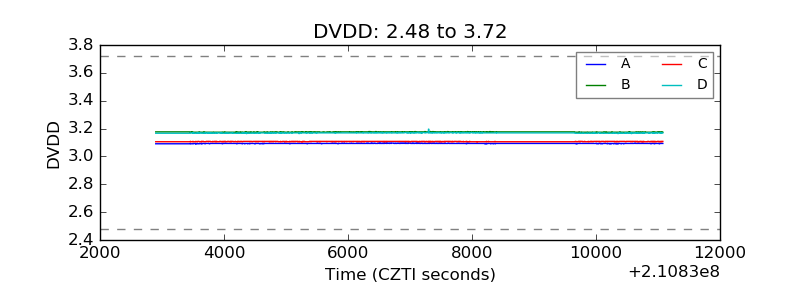 |
| Temperature 1 | 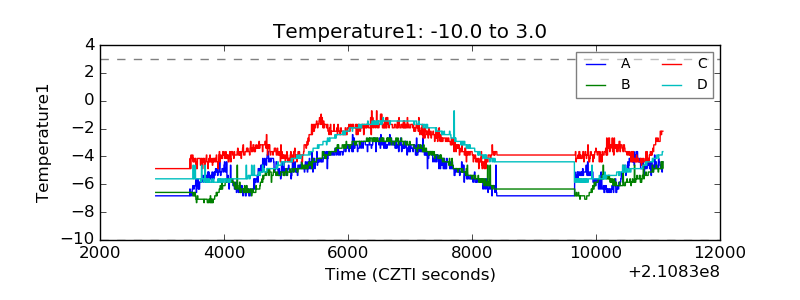 |
| Veto HV Monitor | 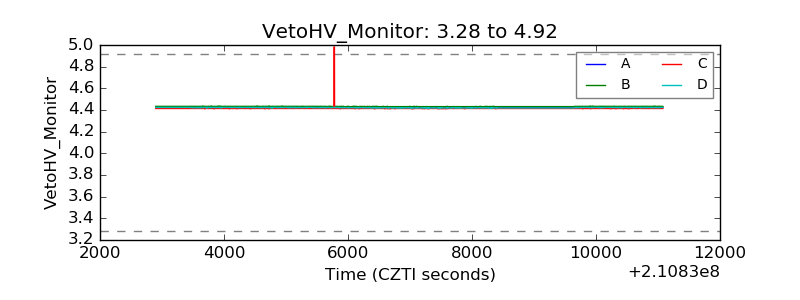 |
| Veto LLD | 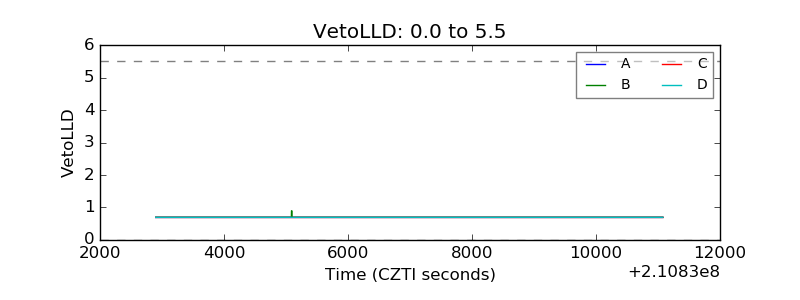 |
| Alpha Counter | 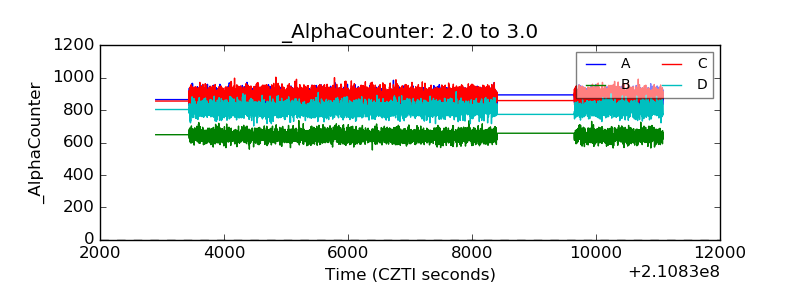 |
| _CPM_Rate | 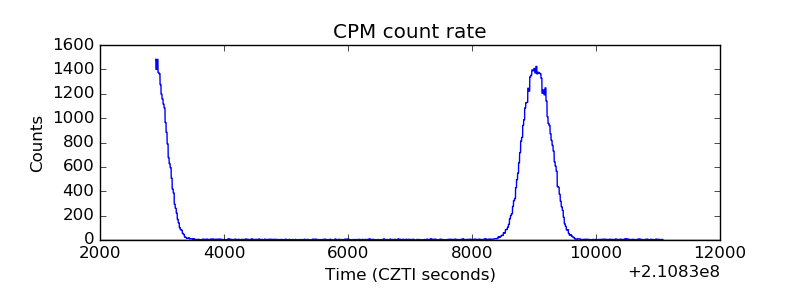 |
| CZT Counter | 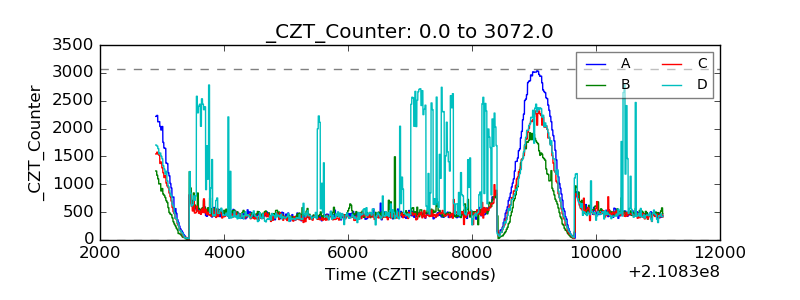 |
| +2.5 Volts monitor | 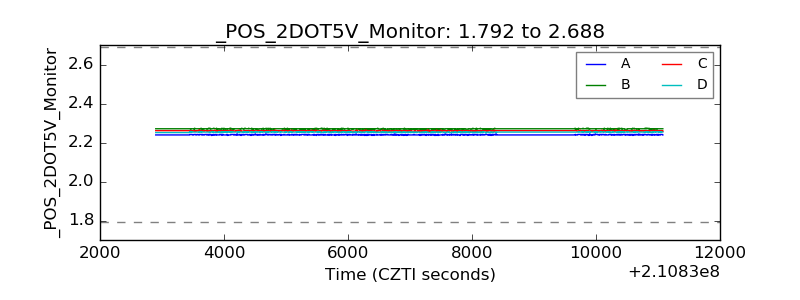 |
| +5 Volts monitor | 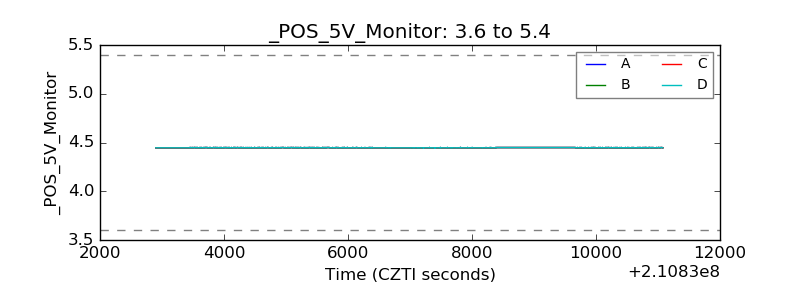 |
| _ROLL_ROT | 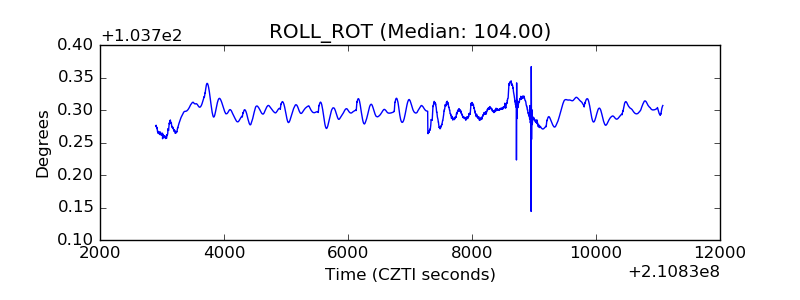 |
| _Roll_DEC | 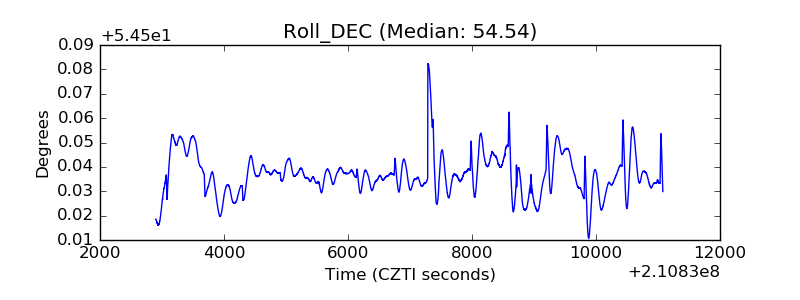 |
| _Roll_RA | 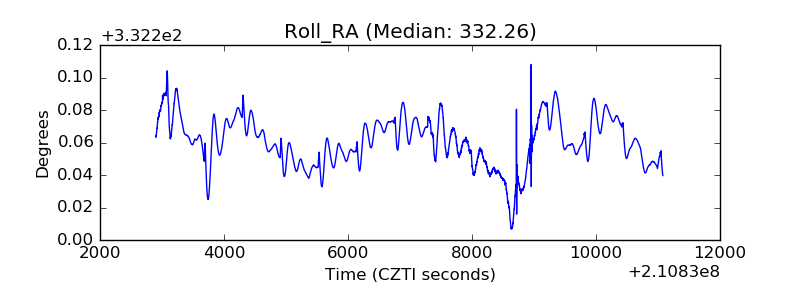 |
| Veto Counter | 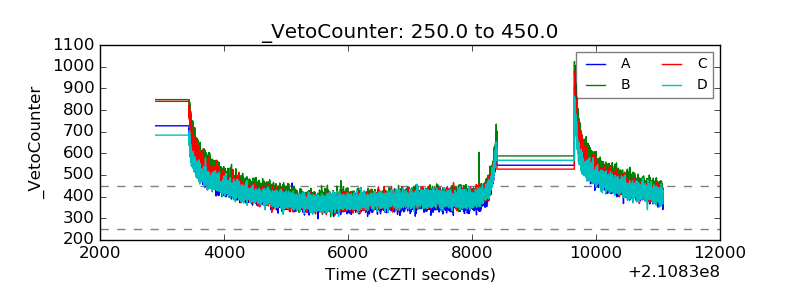 |