| Param | Original file | Final file |
|---|---|---|
| Filename | modeM0/AS1G05_105T01_9000000644_05095cztM0_level2.evt | modeM0/AS1G05_105T01_9000000644_05095cztM0_level2_quad_clean.evt |
| Size (bytes) | 458,447,040 | 66,971,520 |
| Size | 437.2 MB | 63.9 MB |
| Events in quadrant A | 2,969,271 | 418,260 |
| Events in quadrant B | 3,426,458 | 417,073 |
| Events in quadrant C | 2,875,307 | 394,148 |
| Events in quadrant D | 4,191,224 | 364,957 |
| Mode SS | |||
|---|---|---|---|
| Quadrant | BADHDUFLAG | Total packets | Discarded packets |
| A | 0 | 126 | 0 |
| B | 0 | 126 | 0 |
| C | 0 | 126 | 0 |
| D | 0 | 126 | 0 |
| Mode M9 | |||
|---|---|---|---|
| Quadrant | BADHDUFLAG | Total packets | Discarded packets |
| A | 0 | 19 | 0 |
| B | 0 | 19 | 0 |
| C | 0 | 19 | 0 |
| D | 0 | 20 | 0 |
| Mode M0 | |||
|---|---|---|---|
| Quadrant | BADHDUFLAG | Total packets | Discarded packets |
| A | 0 | 12832 | 3 |
| B | 0 | 14072 | 2 |
| C | 0 | 12791 | 2 |
| D | 0 | 16640 | 2 |
| Quadrant | Total seconds | Saturated seconds | Saturation percentage |
|---|---|---|---|
| A | 6206 | 113 | 1.820819% |
| B | 6206 | 165 | 2.658717% |
| C | 6206 | 73 | 1.176281% |
| D | 6206 | 515 | 8.298421% |
Noise dominated data is calculated using 1-second bins in cleaned event files. If a bin has >2000 counts, and if more than 50% of those come from <1% of pixels, then it is considered to be noise-dominated and hence unusable.
| Quadrant | # 1 sec bins | Bins with >0 counts | Bins with >2000 counts | High rate bins dominated by noise | Noise dominated (total time) | Noise dominated (detector-on time) | Marked lightcurve |
|---|---|---|---|---|---|---|---|
| A | 7461 | 6207 | 1 | 1 | 0.01% | 0.02% | 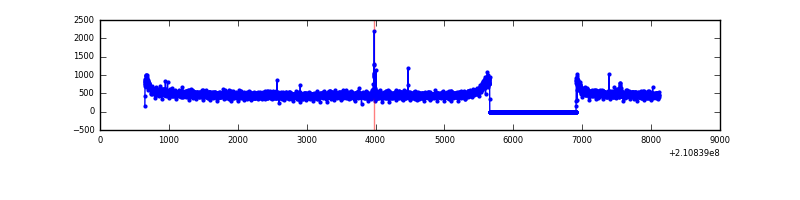 |
| B | 7461 | 6207 | 15 | 15 | 0.20% | 0.24% | 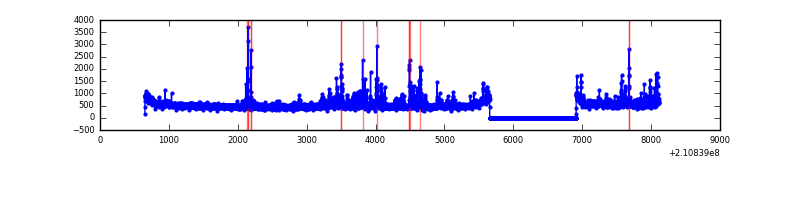 |
| C | 7461 | 6207 | 1 | 1 | 0.01% | 0.02% | 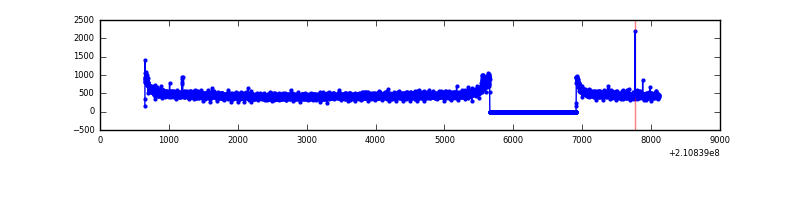 |
| D | 7461 | 6207 | 327 | 327 | 4.38% | 5.27% | 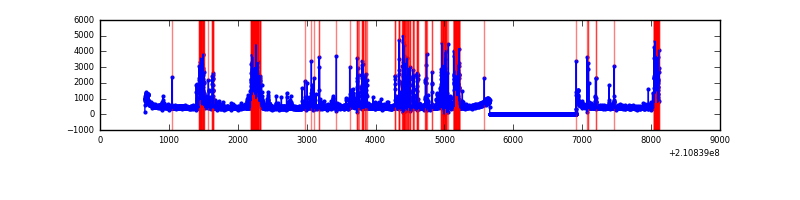 |
Top three noisy pixels from each quadrant. If the there are fewer than three noisy pixels in the level2.evt file, extra rows are filled as -1
| Pixel properties | Quadrant properties | ||||||
|---|---|---|---|---|---|---|---|
| Quadrant | DetID | PixID | Counts | Sigma | Mean | Median | Sigma |
| A | 0 | 50 | 12354 | 75.04 | 766 | 752 | 154.6 |
| A | 12 | 194 | 7546 | 43.94 | 766 | 752 | 154.6 |
| A | 0 | 226 | 7468 | 43.44 | 766 | 752 | 154.6 |
| B | 4 | 80 | 229559 | 1567.91 | 770 | 753 | 145.9 |
| B | 15 | 204 | 153780 | 1048.63 | 770 | 753 | 145.9 |
| B | 5 | 200 | 29245 | 195.24 | 770 | 753 | 145.9 |
| C | 12 | 4 | 16394 | 93.77 | 730 | 732 | 167.0 |
| C | 1 | 16 | 8776 | 48.16 | 730 | 732 | 167.0 |
| C | 13 | 61 | 6059 | 31.89 | 730 | 732 | 167.0 |
| D | 13 | 235 | 591386 | 3450.74 | 709 | 687 | 171.2 |
| D | 13 | 239 | 449093 | 2619.49 | 709 | 687 | 171.2 |
| D | 12 | 22 | 206127 | 1200.14 | 709 | 687 | 171.2 |
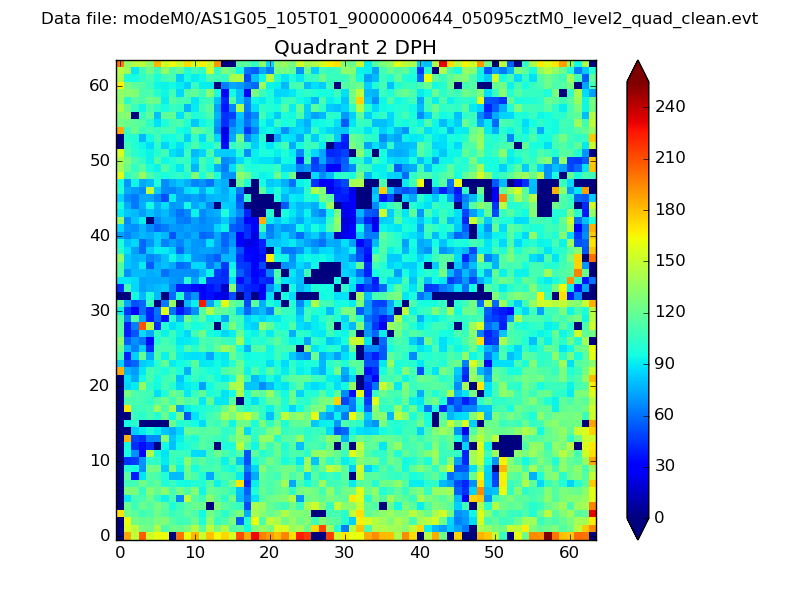
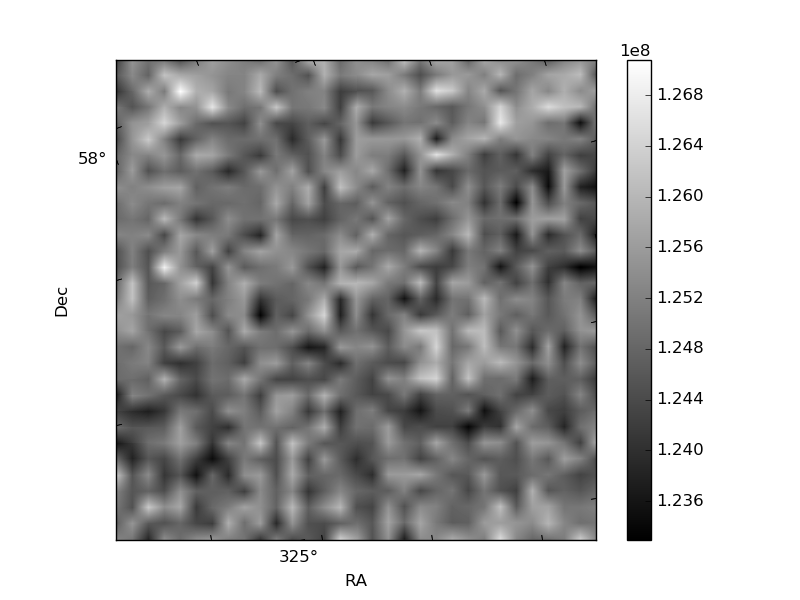
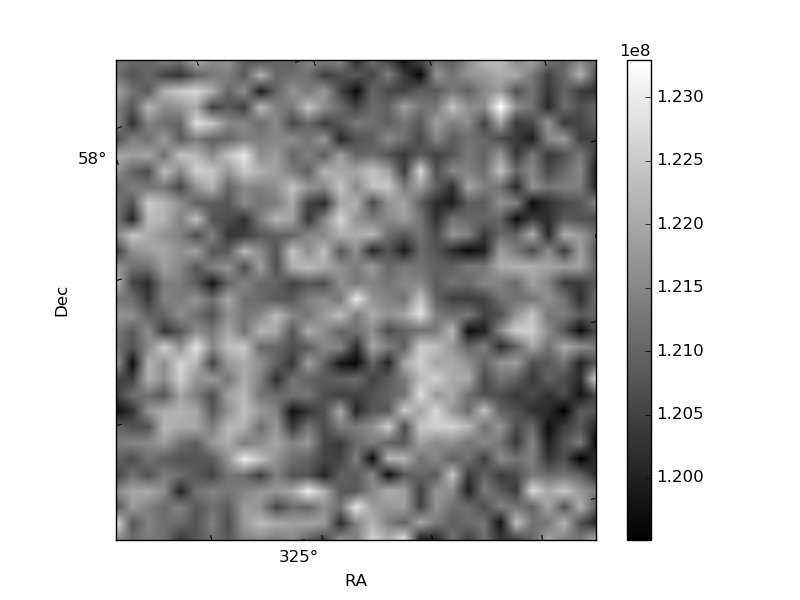
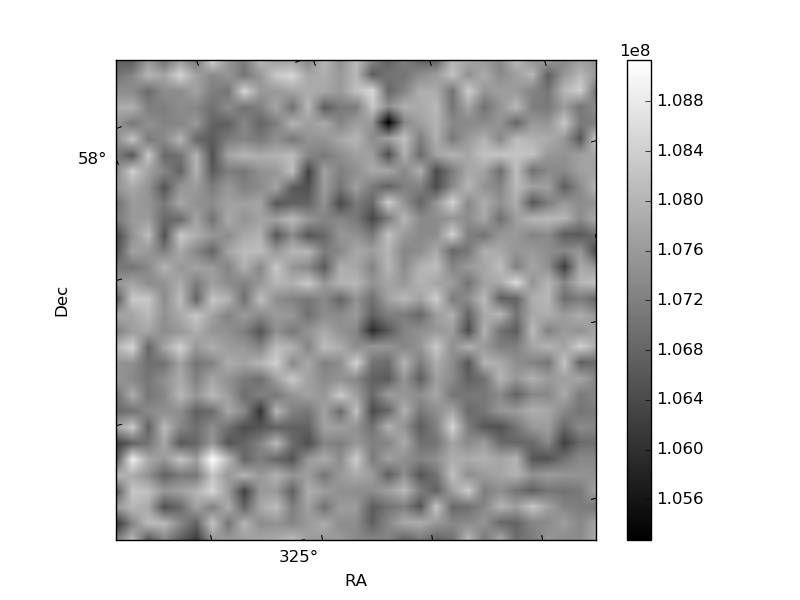
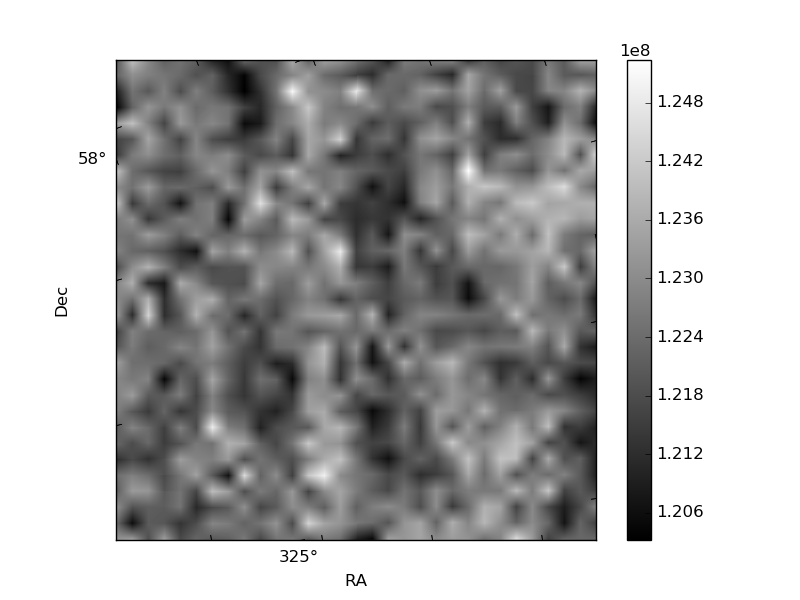
Histogram calculated using DETX and DETY for each event in the final _common_clean file
| Quadrant A | 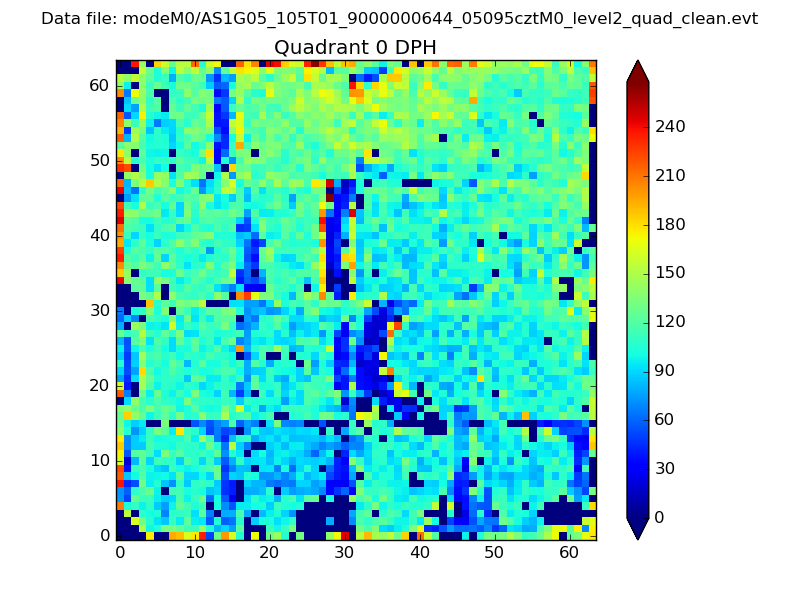 |
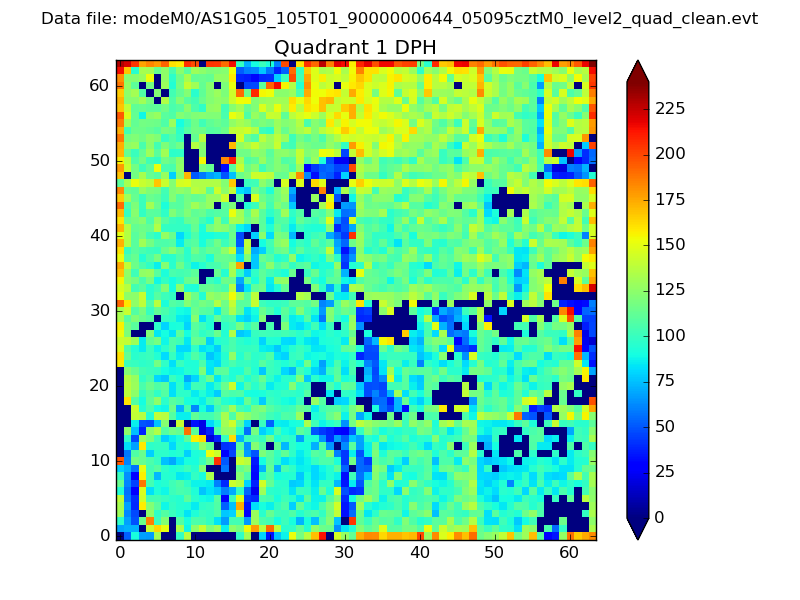 |
Quadrant B |
|---|---|---|---|
| Quadrant D | 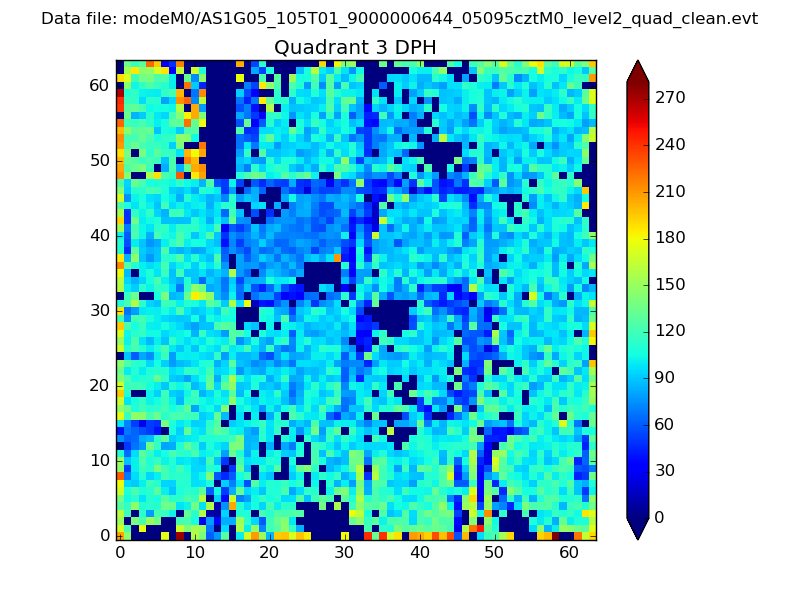 |
 |
Quadrant C |
| Plot type | Count rate plots | Images |
|---|---|---|
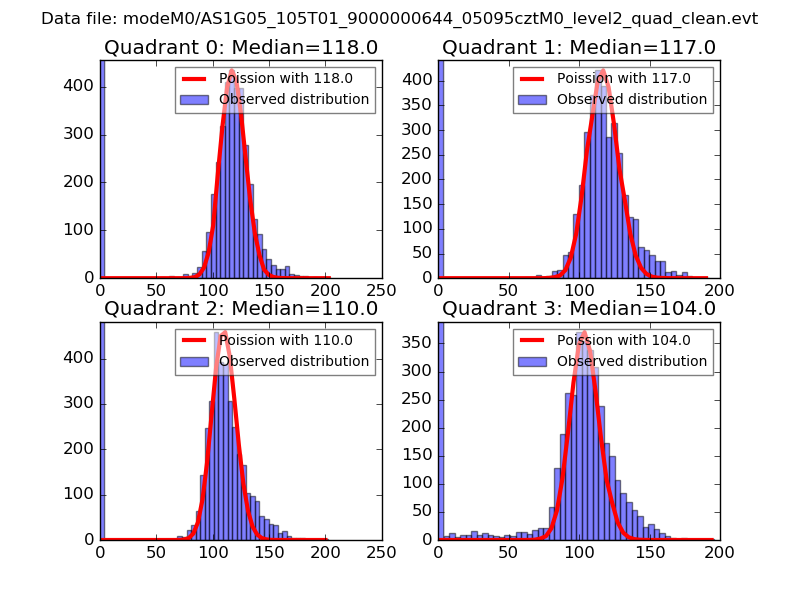
| Comparison with Poisson distribution Blue bars denote a histogram of data divided into 1 sec bins. Red curve is a Poisson curve with rate = median count rate of data. |
 |
 |
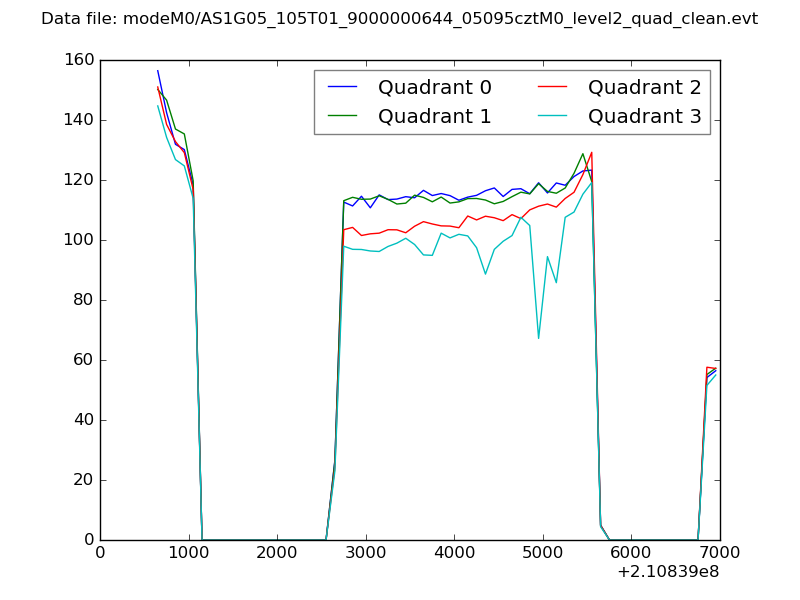
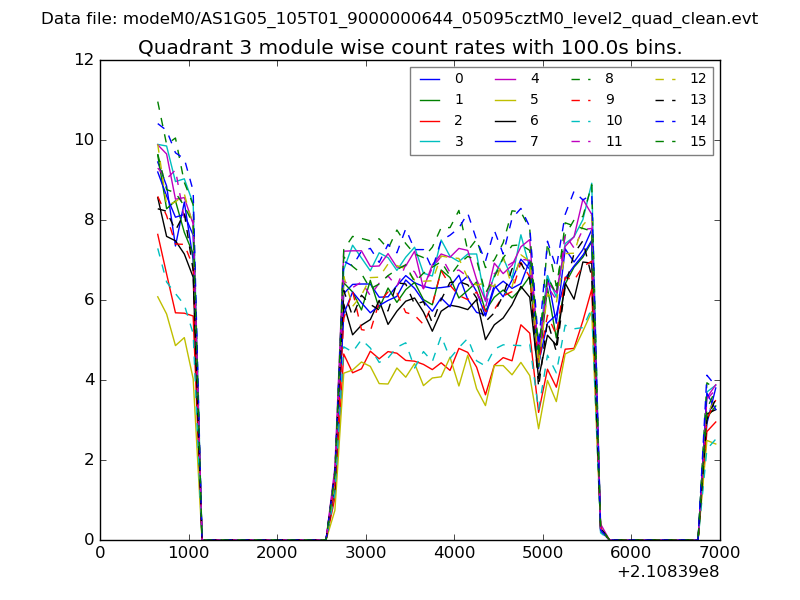
| Quadrant-wise count rates Data is divided into 100 sec bins |
 |
|
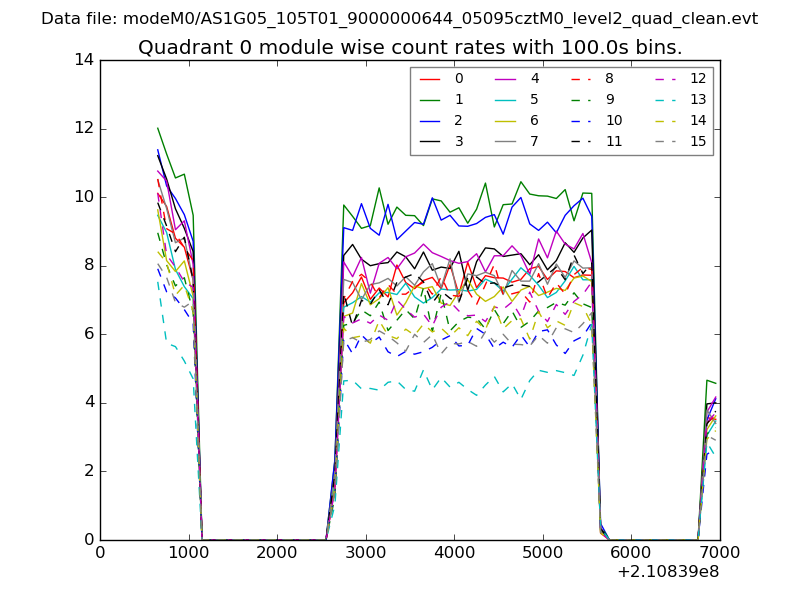
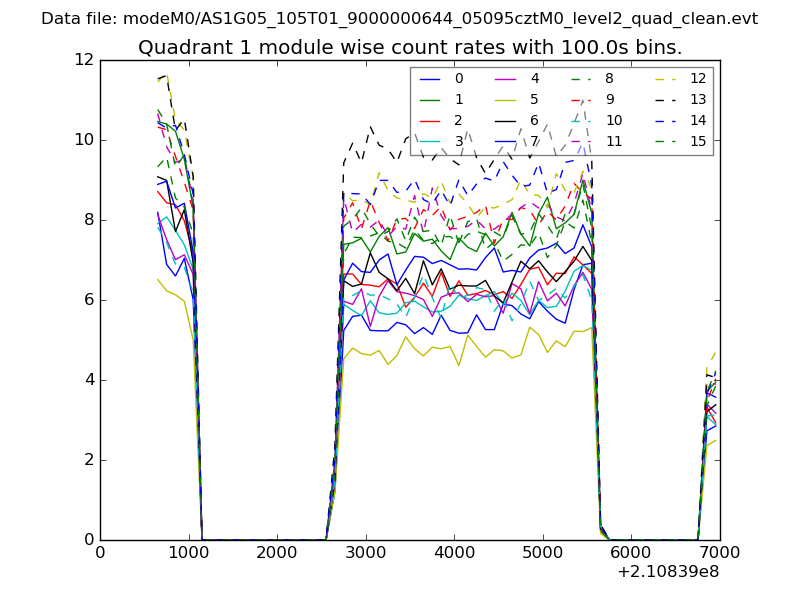
| Module-wise count rates for Quadrant A Data is divided into 100 sec bins |
 |
 |
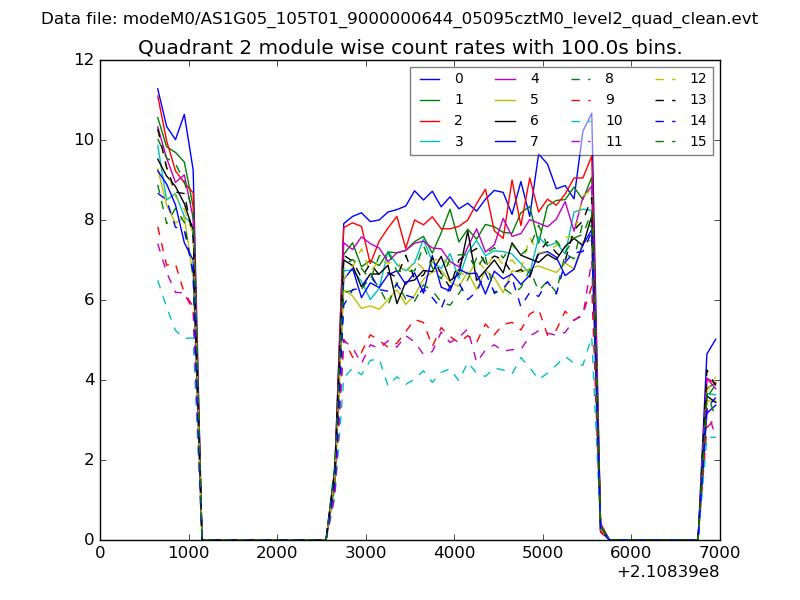
| Module-wise count rates for Quadrant B Data is divided into 100 sec bins |
 |
 |
| Module-wise count rates for Quadrant C Data is divided into 100 sec bins |
 |
 |
| Module-wise count rates for Quadrant D Data is divided into 100 sec bins |
 |
 |
| Parameter | Plot |
|---|---|
| CZT HV Monitor | 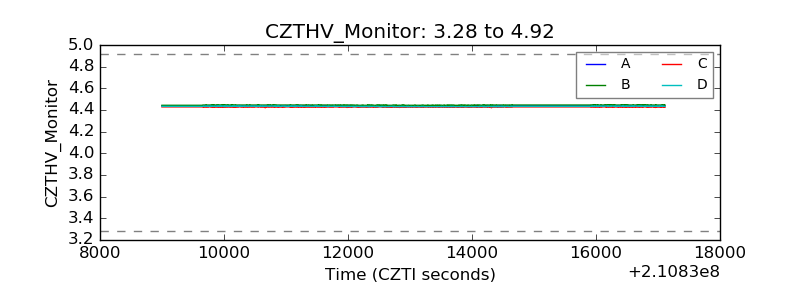 |
| D_VDD | 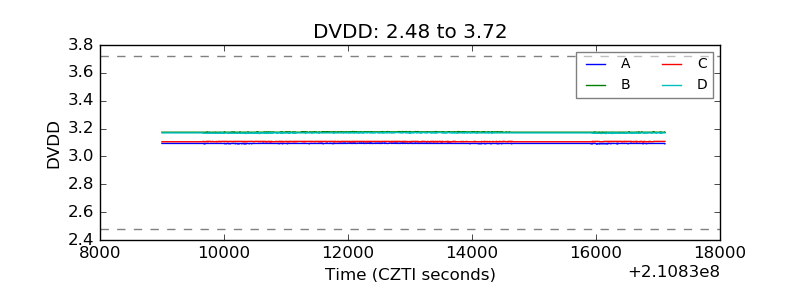 |
| Temperature 1 | 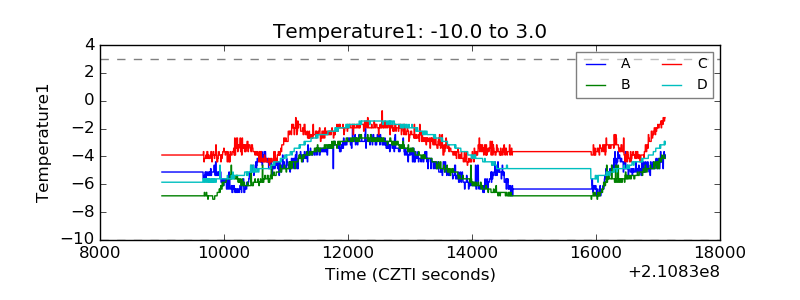 |
| Veto HV Monitor | 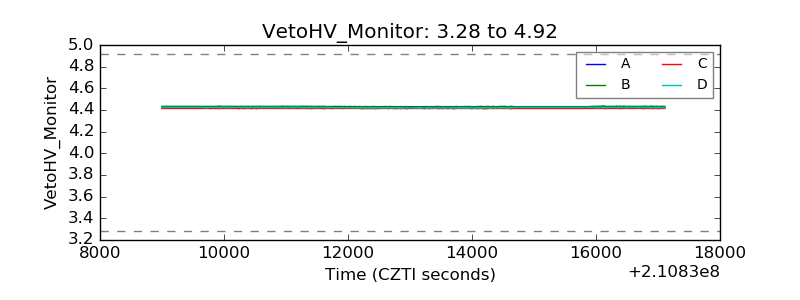 |
| Veto LLD | 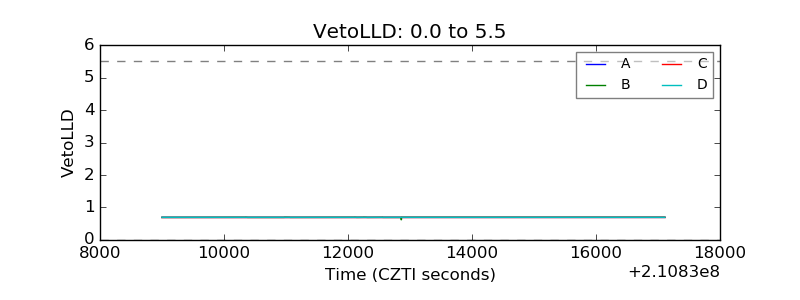 |
| Alpha Counter | 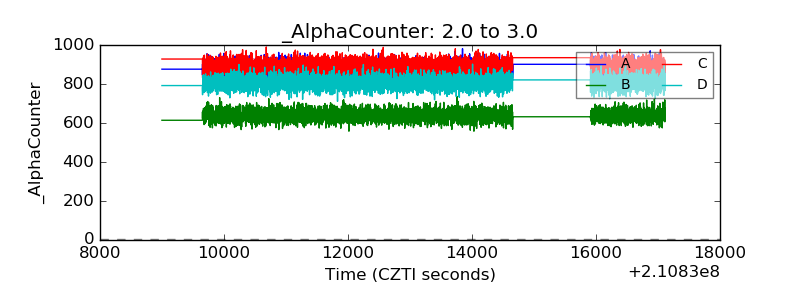 |
| _CPM_Rate | 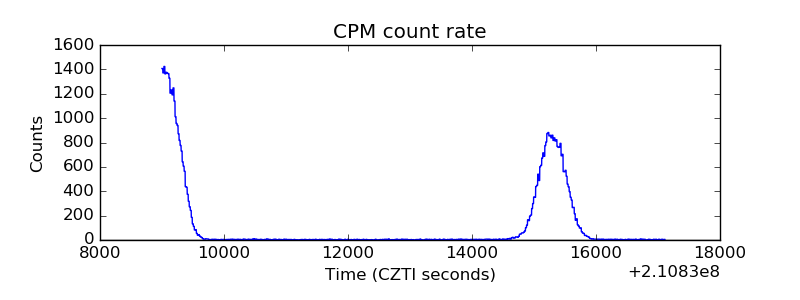 |
| CZT Counter | 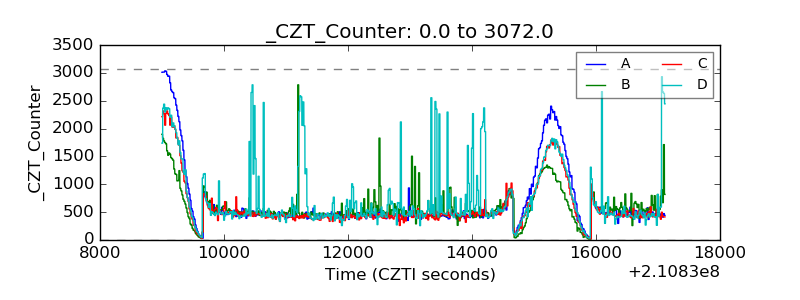 |
| +2.5 Volts monitor |  |
| +5 Volts monitor | 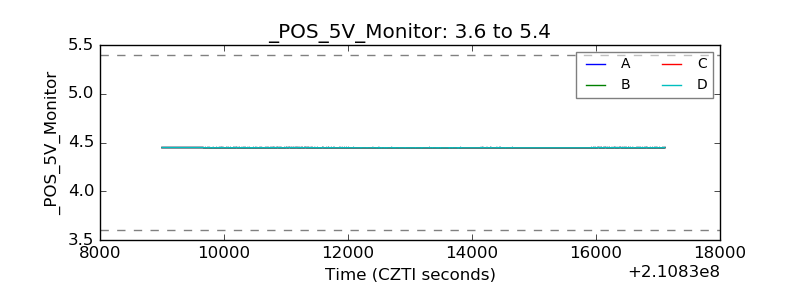 |
| _ROLL_ROT | 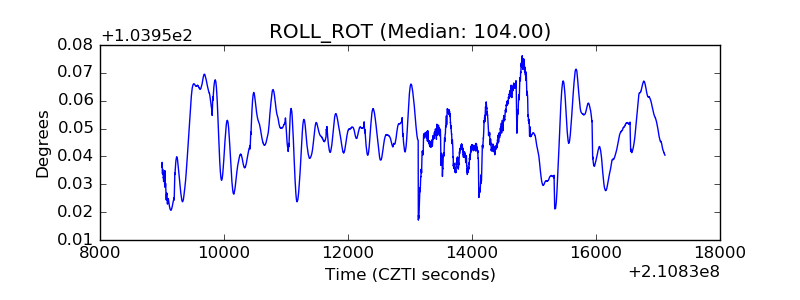 |
| _Roll_DEC | 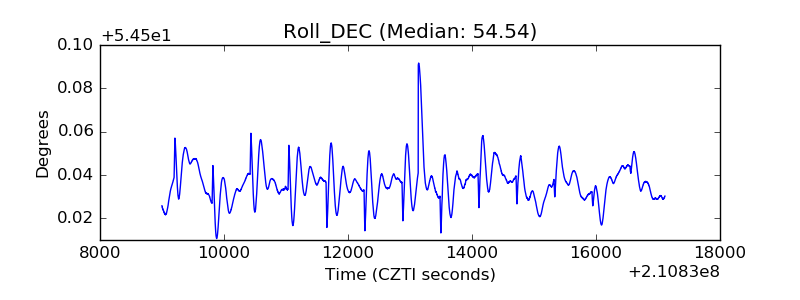 |
| _Roll_RA | 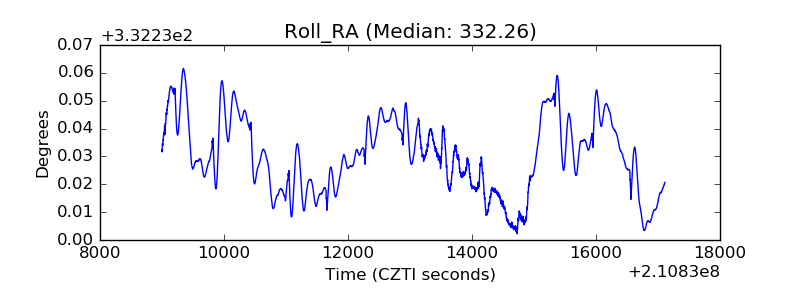 |
| Veto Counter | 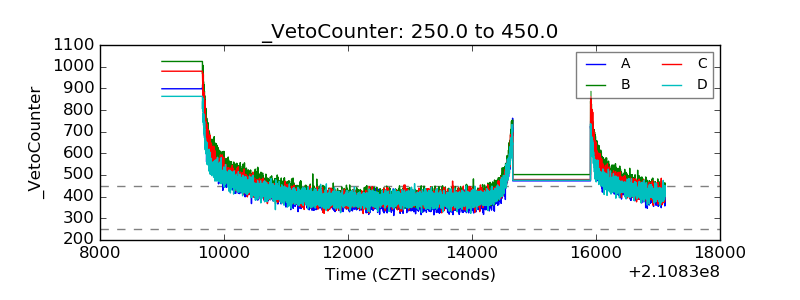 |